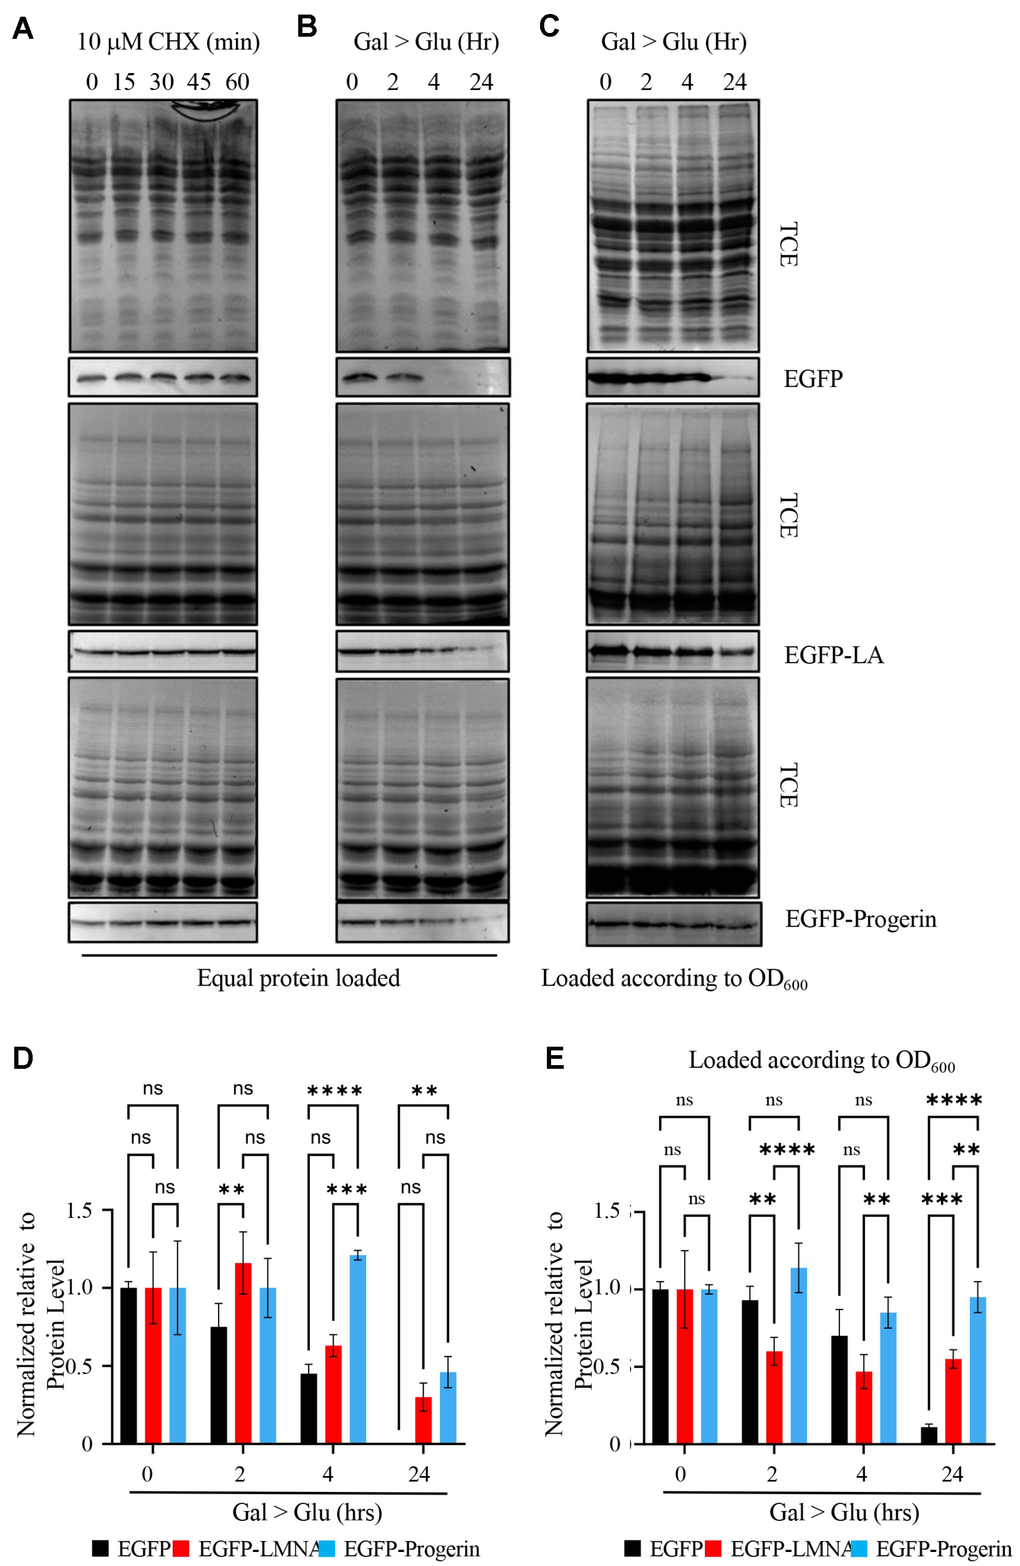
Figure 3.EGFP-Progerin decreases in transformed cultures as a function of total protein but not as a function of cell numbers. (A) To evaluate the fate of EGFP (upper row), EGFP-LMNA (middle row) and EGFP-Progerin (bottom row), we treated cultures expressing these proteins with cycloheximide for 0, 15, 30 and 60 min to determine if cells degraded these proteins. Over the time course, proteins were evaluated for total protein content by trichloroethanol (TCE) staining followed by Western blotting for the EGFP tag. (B) To further evaluate the levels of these proteins, we switched EGFP (upper row), EGFP-LMNA (middle row) and EGFP-Progerin (bottom row) cultures from induction media (GAL) to glucose (GLU) to repress the transgenes and followed the levels of EGFP tagged proteins over 0h, 2h, 4h and 24h. Total protein was isolated from each culture and equal protein amounts were loaded onto gels. Total protein was evaluated by TCE staining and Western blots performed to evaluate the level of EGFP tagged proteins. (C) Total protein was isolated from cell equivalents based on cell density with the culture and EGFP (upper row), EGFP-LMNA (middle row) and EGFP-Progerin (bottom row) evaluated by Western blot. (D) The experiment described in (B) was repeated 3 times, with bands scanned and quantified. SEM is shown. Two-way ANOVA with post hoc Tukey’s multiple comparisons test was used to determine p-values. (E) The experiment described in (C) was repeated 3 times, with bands scanned and quantified. SEM is shown. Two-way ANOVA with post hoc Tukey’s multiple comparisons test was used to determine p-values. p < 0.01**, p < 0.001***, and p < 0.0001****.