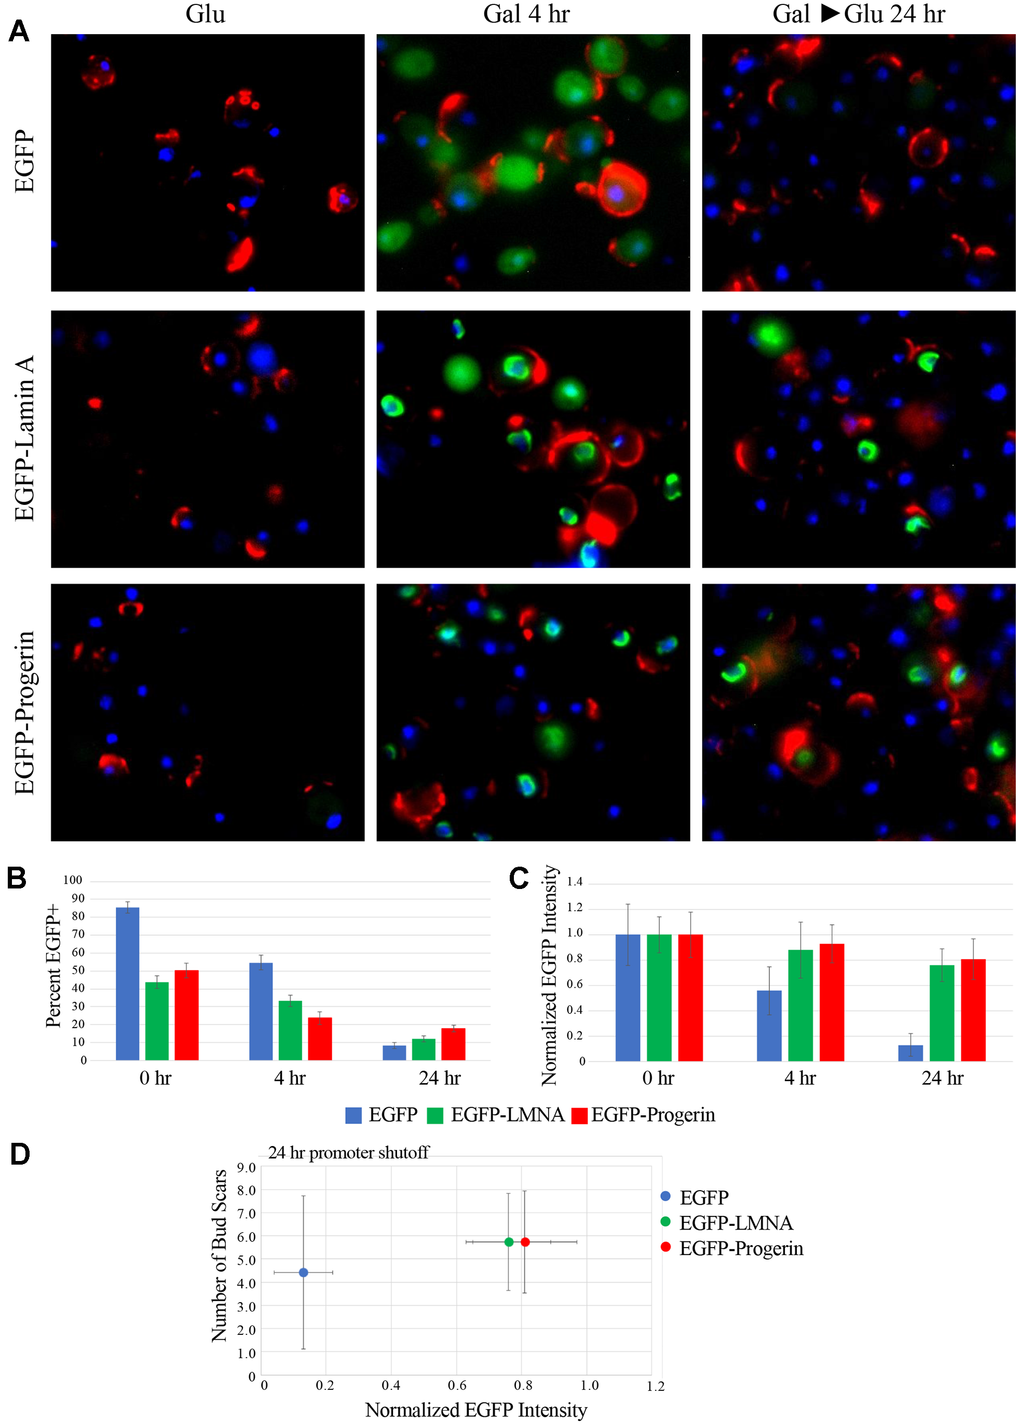
Figure 4.EGFP-LMNA and EGFP-Progerin are maintained at high levels in a subpopulation of cells following removal of galactose induction. (A) Aliquots of cells were taken from EGFP (upper row), EGFP-LMNA (middle row) and EGFP-Progerin (bottom row) at under either pre-induction (GLU) conditions, following 4h of induction (GAL 4H) or 24 of removal from induction (GAL>GLU 24H). Cells were fixed and labelled with WGA (red), DNA counterstained with H33342 (blue) and EGFP signal is shown in green. (B) Micrographs of fixed and labelled cells from EGFP (blue bars), EGFP-LMNA (green bars) and EGFP-Progerin (red bars) were quantified. The percentage of positive cells from each culture after induction and moving the cells back into glucose containing media following 0h, 4h and 24h were scored as a percentage (y-axis). (C) From the positive cells from each of the EGFP (blue bars), EGFP-LMNA (green bars) and EGFP-Progerin (red bars), the intensity levels of signal were measured at 0h, 4h and 24h. Data is normalized to the 0h time point. Images were collected from n=3 cultures of each EGFP, EGFP-LMNA and EGFP-Progerin. n=200 cells for each. Error bars represent SEM. (D) EGFP-expressing (blue), EGFP-LMNA expressing (Green), or EGFP-Progerin expressing (red) cells analyzed in Figure 3A were further analyzed by measuring the total intensity of green fluorescence in each cell. The average number of bud scars in each population of cells is plotted on the Y-axis while the average normalized EGFP fluorescence is plotted on the X-axis. Error bars represent the SEM.