


This article has been corrected: It was found that there is the overlap between the images showing migration and invasion of Caki-1-shMTDH-KD1-MTDH cells in Figure 3J. The authors confirmed that the image of transwell invasion of Caki-1-shMTDH-KD1-MTDH cells was misplaced during the figure layout. They provided the original images of the transwell assays and corrected Figure 3J with the proper image obtained from the original data. The authors also would like to clarify the use of the same western blot images in Figures 3D and 4E, depicting MTDH and β-actin expression in 786-O-shMTDH-#1 cells. The purpose was to demonstrate the efficacy of MTDH overexpression in lentivirus-infected cells, which is now stated in the legend to Figure 4E. These corrections do not change the results or conclusions of the article. The authors apologize for any confusion or inconvenience possibly caused.
The corrected version of Figure 4 legend and Figure 3 are provided below.
Figure 4. MTDH promotes metastasis by activating ERK signaling and EMT. (A) Heatmap representation of differentially expressed genes identified by RNA-Seq between 786-O-shMTDH-#1-MTDH cells (n = 3) and 786-O-shMTDH-#1-vector Control cells (n = 3). (B) Validation of differentially expressed genes by RT-qPCR. Comparison of mRNA expression of genes in pathways of cancer (CXCL1/2/5 and IGFBP5) and genes in EMT-related pathway (Snail, Slug and ZEB1) between 786-O--shMTDH-#1-MTDH cells and 786-O--shMTDH-#1-vector Control cells. All data are shown as means ± SD. (C) Based on our own RNA sequencing data, genes influenced by MTDH overexpression were mostly enriched in pathways involved with KRAS signaling using Gene Set Enrichment Analysis (GSEA) pathway analysis. (D) Silencing MTDH reduced the protein expression of p-ERK1/2, Snail and SND1 in ccRCC cells. (E) Overexpressing MTDH increased the protein expression of p-ERK1/2, Snail and SND1 in ccRCC cells. (786-O-shMTDH-#1 cells MTDH and b-actin images were used in Figure 3D to demonstrate MTDH overexpression efficacy after lentiviral infection). (F) The result of mass spectrometry analysis of s-tag pull down assay confirm the interaction between MTDH and SND1 at the protein level. (G) MTDH and SND1 were co-localized, mainly in the cytoplasm. (H) The result of immunoprecipitation revealed that MTDH binds to SND1 at the protein level. (I) The correlation of MTDH and SND1in PKU-KIRC dataset was statistically analyzed (P<0.0001).
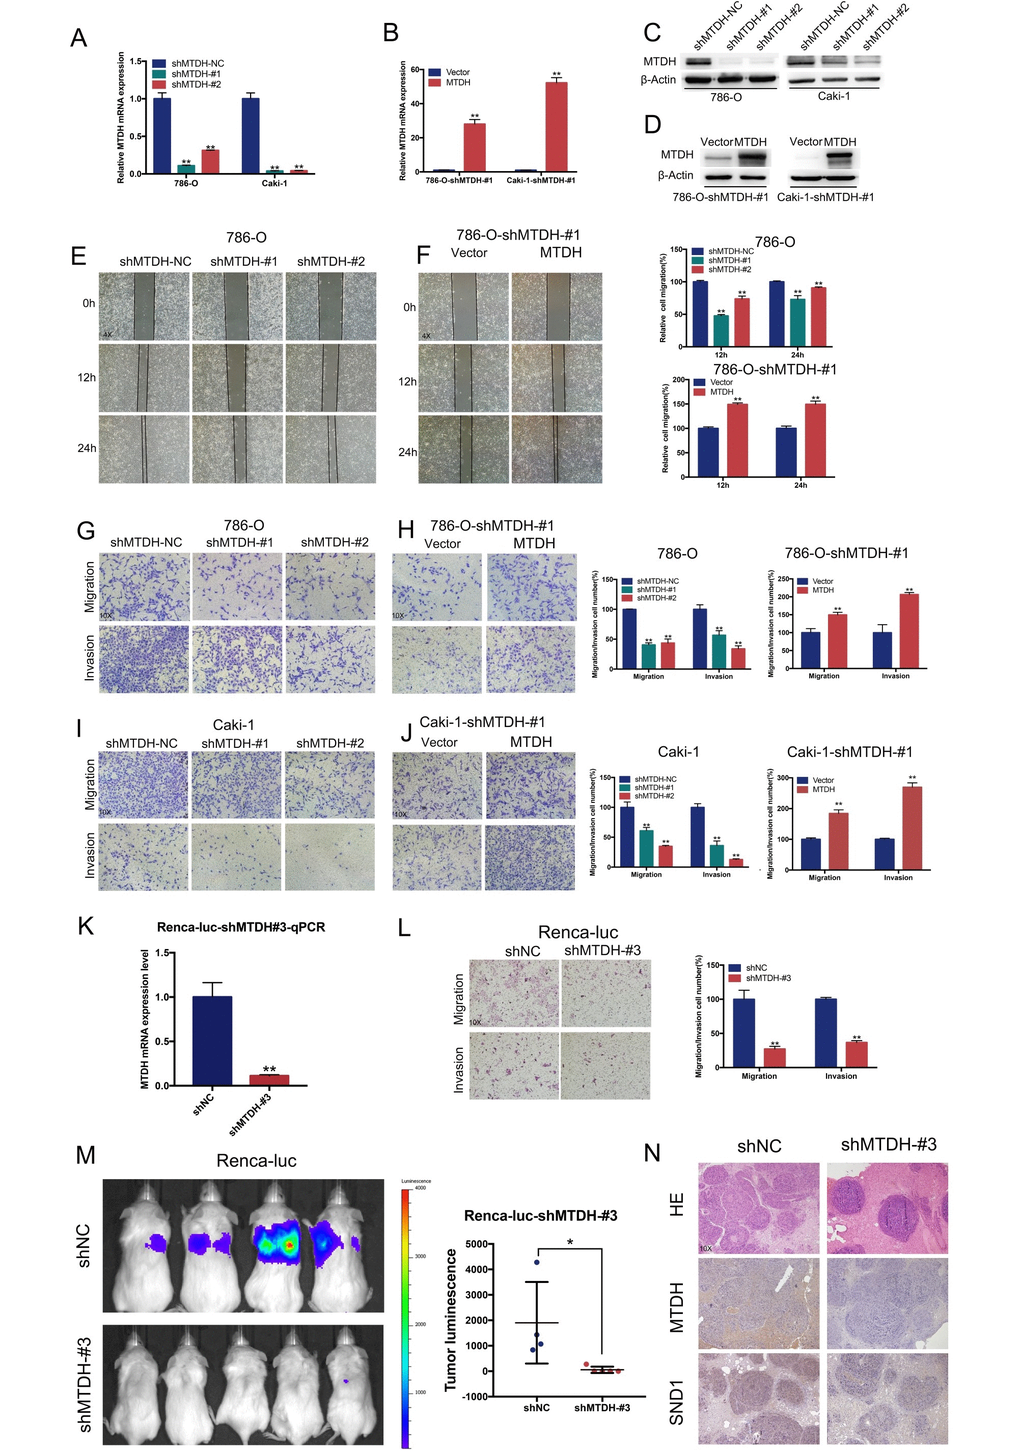
Figure 3. MTDH promotes cell migration and invasion of ccRCC cells. (A–D) RT-qPCR and western blot analyses of ccRCC cells infected with a lentivirus-mediated MTDH-overexpressing vector (D) or MTDH shRNAs (C). (E–F) Wound-healing assay. Representative images of wound-induced cell migration by the 786-O-shMTDH, 786-O-#1-MTDH and control cells(4x). (G–J) Representative images of transwell migration and invasion assay of MTDH-knockdown cells and MTDH-overexpressed cells(10x). (K) RT-qPCR analyses of Renca-luc cells infected with a lentivirus-mediated MTDH shRNAs. (L) Representative images of transwell migration and invasion assay of Renca-luc-shMTDH#3(10x). (M) Tail vein-injected Renca-luc metastasis model. Representative IVIS images of mice injected mouse MTDH-silenced or control cells and analysis of tumor luminescence representing lung metastasis measured on day 21. Five mice per group (Renca-luc-shNC ccRCC cells failed in tail vein injection in one mice.) (N) Lung metastasis was confirmed by H&E and IHC- MTDH staining(10x).