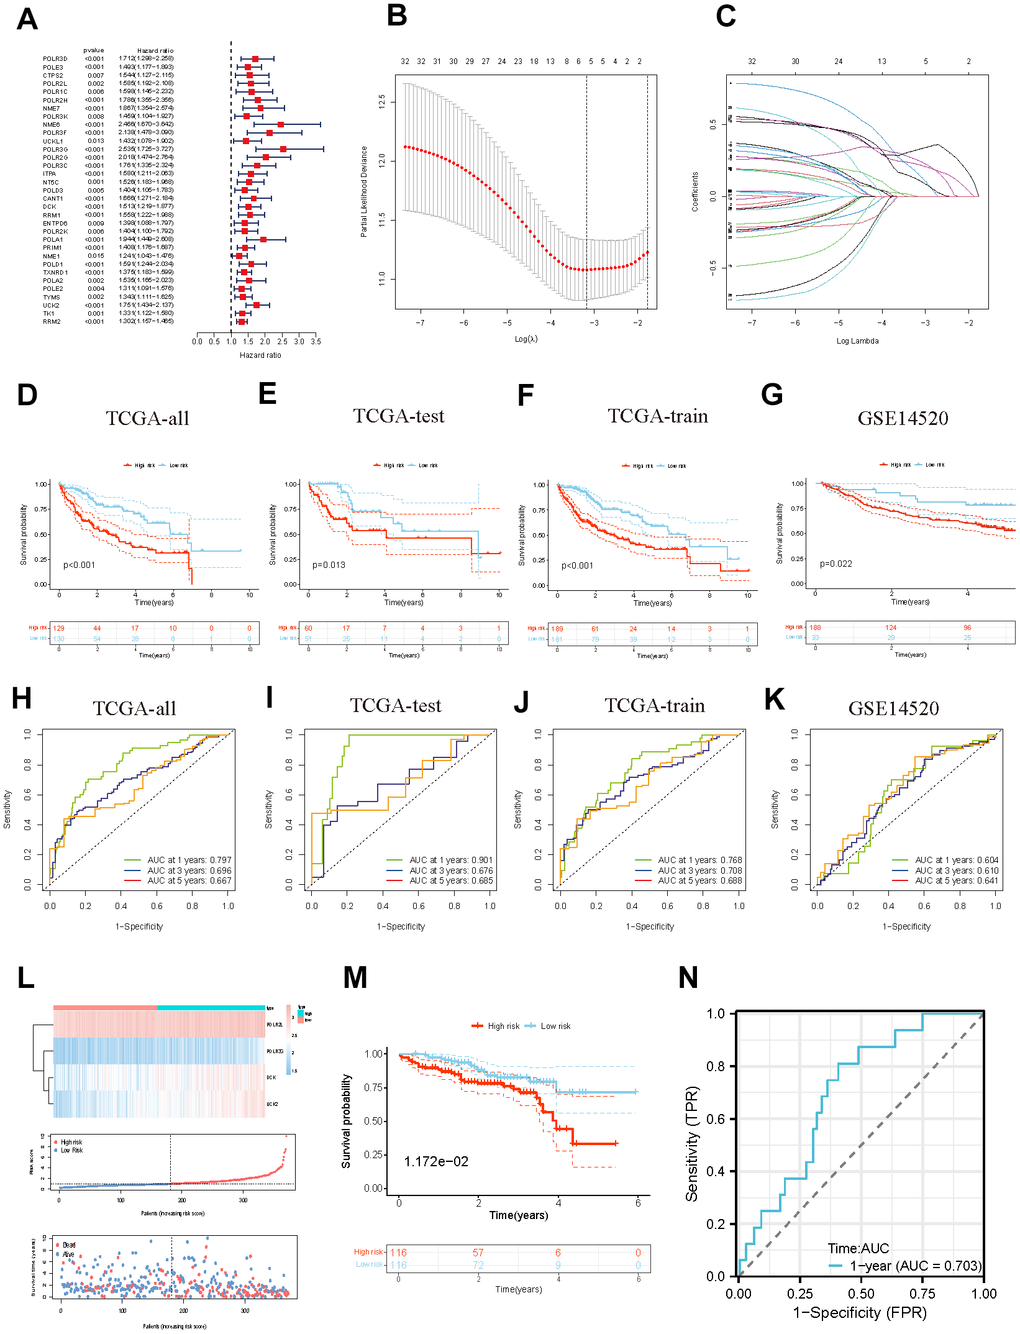
Figure 4.Identification and validation of the PMRS. (A) Forest plot of the univariate Cox regression. (B, C) Construction of PMRS. (D–G) The OS KM curves between different groups respectively in the whole TCGA cohort, test cohort, train cohort, and GSE14520. (H–K) The time-dependent ROC curves of the PMRS respectively in the whole TCGA cohort, test cohort, train cohort, and GSE14520. (L) The risk score and clinical event between the different groups in TCGA cohort. (M) The OS KM curves between high- and low-risk groups in the ICGC cohort. (N) The time-dependent ROC of the PMRS in the ICGC cohort.