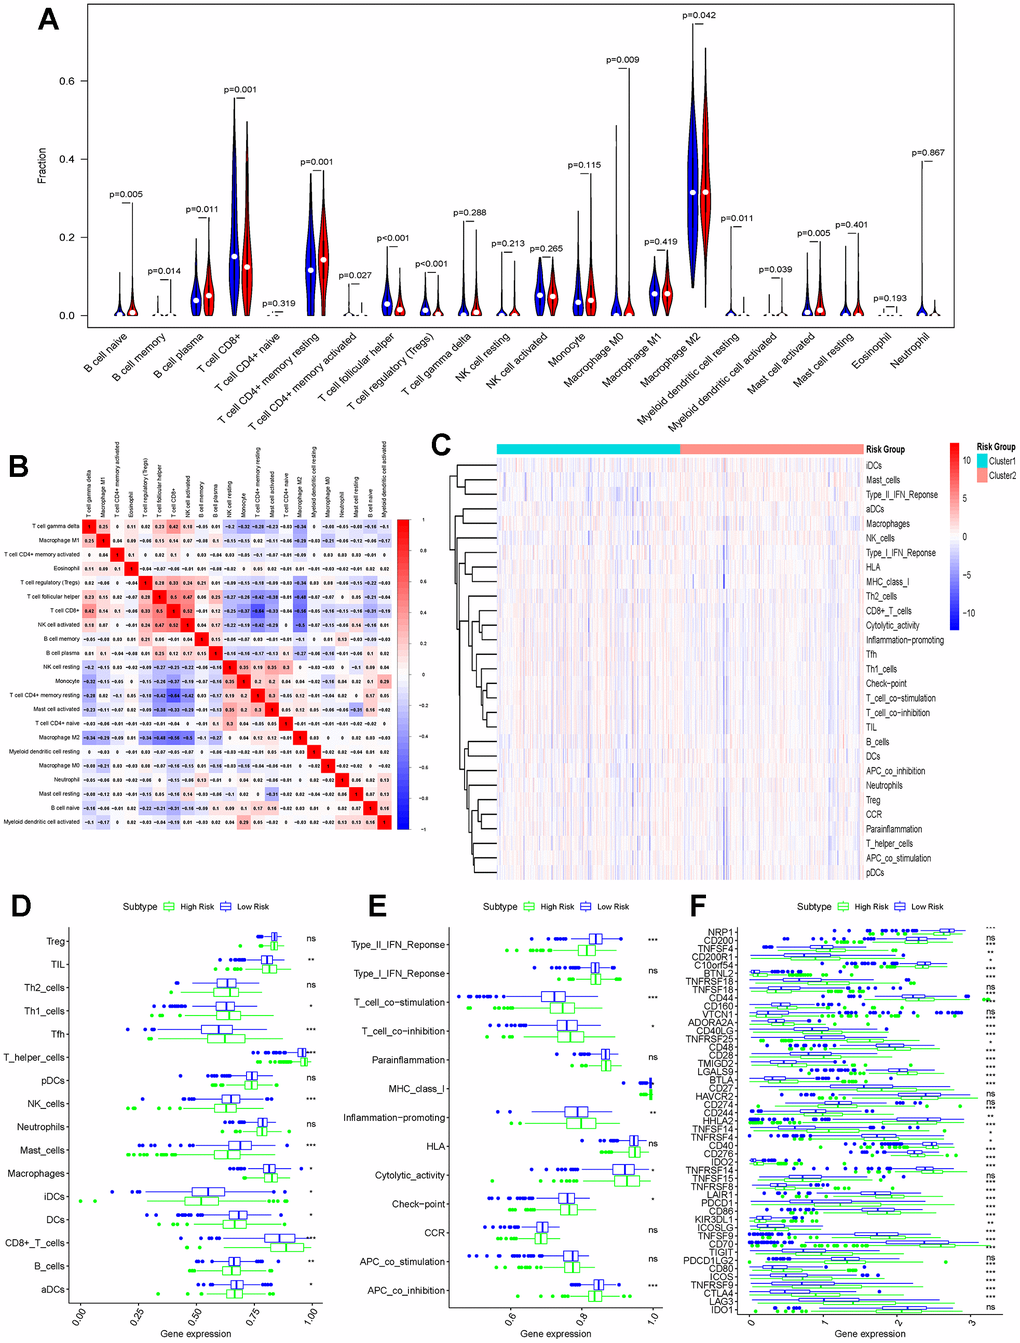
Figure 6.Differences in immune function between high-risk and low-risk groups. (A) CIBERSORT algorithm analysing the landscape of immune infiltration in patients in the high-risk and low-risk groups; (B) Immune cell correlation analysis in the CIBERSORT algorithm; (C) Heatmap showing the ssGESA algorithm analysing the differences in immune cells and immune infiltration in the high-risk and low-risk groups (Cluster1 represents the high-risk group; Cluster2 represents the low-risk group); (D) Bar graph demonstrating the difference in immune cell infiltration in the high-risk and low-risk groups under the ssGESA algorithm; (E) Differences in immune function between high-risk and low-risk groups by the ssGESA algorithm are demonstrated using bar graphs; (F) Bar graphs further demonstrating differences in the expression of immune checkpoints in the high-risk and low-risk groups. (*p < 0.05, **p < 0.01, ***p < 0.001, “ns”: not statistically significant).