


Introduction
Type 2 diabetes is caused by insulin resistance (IR) and/or impaired insulin secretion. In the process of progression to type 2 diabetes, IR often takes place as the initial event. IR, even at pre-diabetic state, is a risk factor for neuropathy [1] and nephropathy [2], for macrovascular disease [3], and for death and morbidity [4]. IR causes impaired glucose tolerance, a state with a larger and/or longer postprandial elevation of blood glucose. The elevated blood glucose impairs various organs, being recognized as glucotoxicity [5,6], which is linked to both diabetic complications and progression of aging [4]. The glucotoxicity that takes place in pancreatic islet β-cells results in reduction of insulin secretion and overt type 2 diabetes. However, the factor that links hyperglycaemia to dysfunction of pancreatic β-cells is not thoroughly understood.
Hyperglycemia alters glucose metabolism within β-cells and elevates osmolarity around β-cells. It is also possible that elevated glucose over-stimulates the release of insulin and ATP form β-cells, resulting in increased interstitial concentrations of insulin and ATP. Regarding the abnormal glucose metabolism associated with glucotoxicity, four glucose-driven or glycolysis metabolites-deriven pathways have been reported (Fig. 1) [7,8]. Among these, hexosamine pathway has been suggested to be involved in the glucotoxicity in β-cells [8,9]. An increased glycolysis due to elevated glucose converts fructose-6-phosphate and glutamine into glucosamine-6-phosphate and glutamate by a rate limiting enzyme, glutamine:fructose-6-phosphate amidotransferase (GFAT). Glucosamine-6-phospate is then metabolized to uridine diphosphate-N-acetylglucosamine (UDP-GlcNAc). Ultimately, this hexosamine pathway in the pancreatic β-cells leads to inhibition of glucose-stimulated insulin secretion (GSIS) and induction of apoptosis by decreasing the levels of glucose transporter 2 and glucokinase expressions [9,10]. These alterations in the glucose metabolism and/or extracellular fluid could contribute to production of glucotoxocity in β-cells.
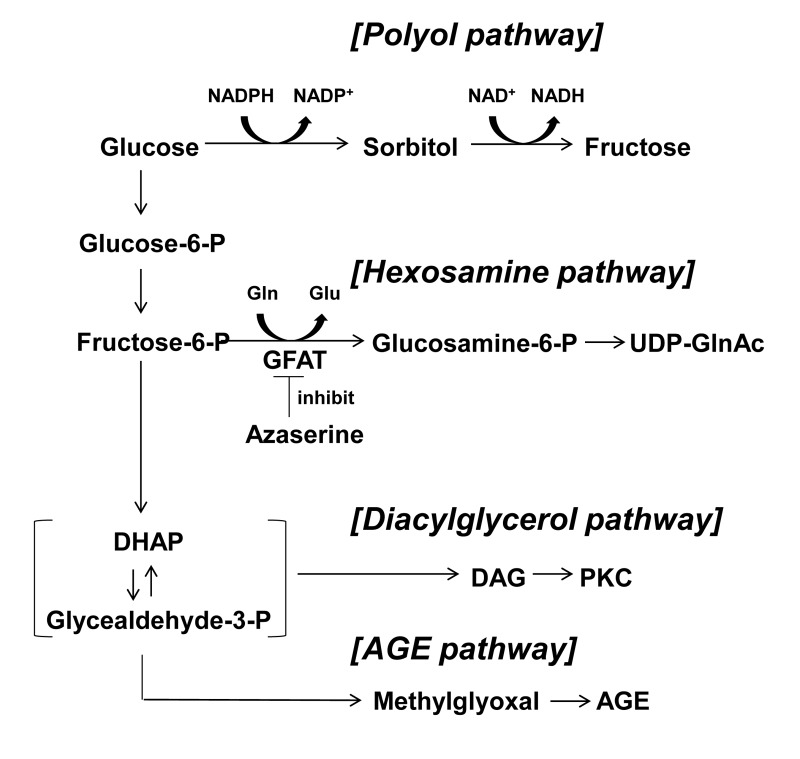
Figure 1. Four major pathways of glucose metabolism underlying glucotoxicity. Azaserine inhibits GFAT. GFAT; glutamine: fructose-6-phosphate amidotransferase, DHAP: dihydroxyacetone phosphate, DAG: diacylglycerol, AGE: advanced glycation product.
In this study, to examine the direct sub-chronic effect of elevated glucose on β-cells, single β-cells were isolated from rats and cultured for 3 days with high (22.3 mM) glucose (HG), compared with control 5.6 mM glucose, to induce glucotoxicity. They were also cultured with candidate mediators and inhibitors of glucotoxicity. Following the culture, the β-cell signaling activity was assessed by measuring cytosolic Ca2+ concentration ([Ca2+]i) using fura-2 and its exocytotic activity was assessed using quinacrine microfluorometry in single β-cells; their responses to physiological (8.3 mM) glucose, arginine and tolbutamide were investigated. In pancreatic β-cells, a rise in glucose concentration increases intracellular ATP and closes the ATP-sensitive K+ (KATP) channel, which depolarizes the cell membrane to open the voltage-dependent Ca2+ channel (VDCC), leading to an increase in [Ca2+]i that triggers exocytosis of insulin [11,12]. Hence, the [Ca2+]i response to glucose reflects the β-cell signaling leading to insulin secretion [13].
Results
A rise in glucose concentration from 2.8 to 8.3 mM induced an increase in [Ca2+]i in a single β-cell following culture for 3 days under control condition with 5.6 mM glucose (Fig. 3A), and the [Ca2+]i response occurred in 41 of 50 β-cells (82%) (Fig. 4). These β-cells also responded to administration of insulin secretagogues, a KATP channel blocker tolbutamide (300 μM) and arginine (10 mM), with increases in [Ca2+]i. In contrast, in β-cells after culture for 3 days with high (22.3 mM) glucose (HG), the [Ca2+]i responses to 8.3 mM glucose were markedly suppressed or inhibited (Fig. 3B), and the [Ca2+]i response occurred in 17 out of 70 β-cells (24%) (Fig. 4). The [Ca2+]i responses to tolbutamide and arginine were also suppressed to a lesser extent than those to 8.3 mM glucose (Fig. 3B). In β-cells after culture with 16.7 mM L-glucose, an enatiomer of D-glucose, the [Ca2+]i responses to 8.3 mM glucose, tolbutamide and arginine occurred in a similar manner to those in β-cells after control culture (Fig. 3C vs. A), and the incidence of the [Ca2+]i response to 8.3 mM glucose was unaltered (Fig. 4).
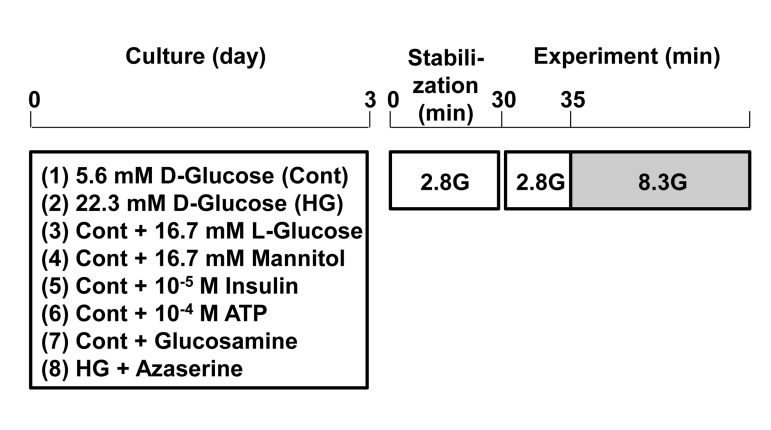
Figure 2. Protocol for induction of glucotoxicity and assessment of responsiveness to physiologic glucosein pancreatic β-cells. Single β-cells isolated from rats were cultured under control and test conditions for 3 days. Subsequently, single β-cells were first incubated for 30 min in HKRB containing 2.8 mM glucose for stabilization and then subjected to [Ca2+]i measurements for functional assay.
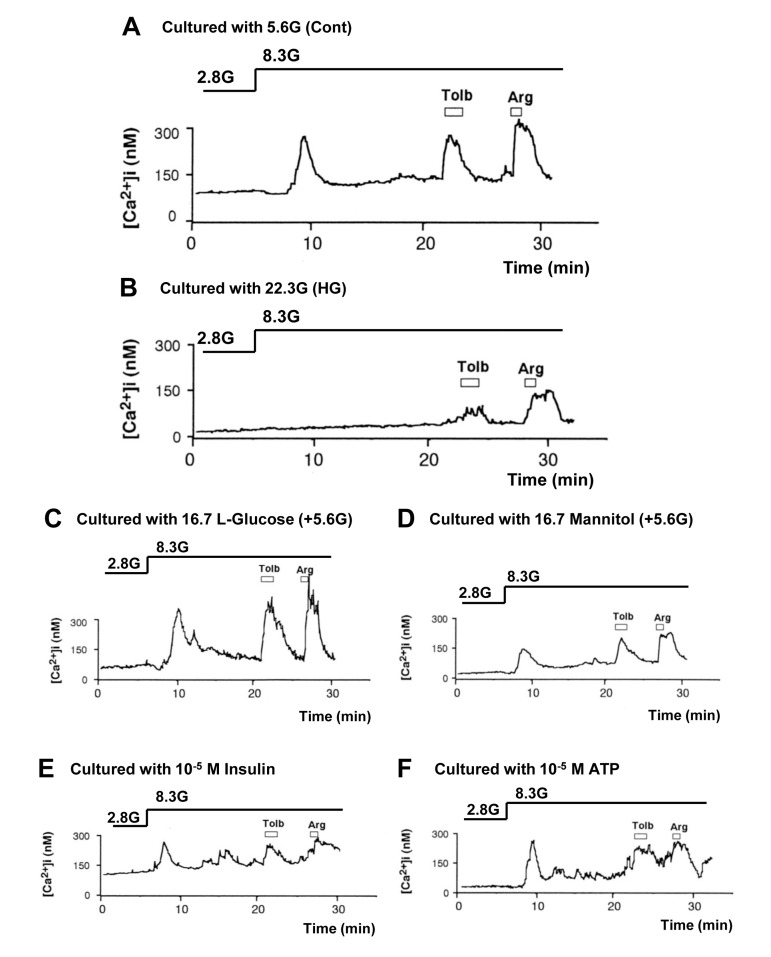
Figure 3. High (22.3 mM) glucose in culture impaired subsequent [Ca2+]i responses to physiologic glucose challenge in pancreatic β-cells, while L-glucose and increases in osmolarity, insulin and ATP had no or weaker effects. A, [Ca2+]i responses to 8.3 mM glucose (8.3G), 300 μM tolbutamide (Tolb), and 10 mM arginine (Arg) in single β-cells following control culture with 5.6 mM glucose. A representative of 41 cells (N=41). B, [Ca2+]i responses to 8.3G, Tolb and Arg in β-cells following culture with 22.3 mM glucose. N=17. C-F, [Ca2+]i responses to 8.3G, Tolb and Arg in β-cells following culture with 16.7 mM L-glucose (C; N=40), 16.7 mM mannitol (D; N=14), 10−5 M insulin (E; N=21), and 10−5 M ATP (F; N= 39) in the presence of 5.6 mM D-glucose.
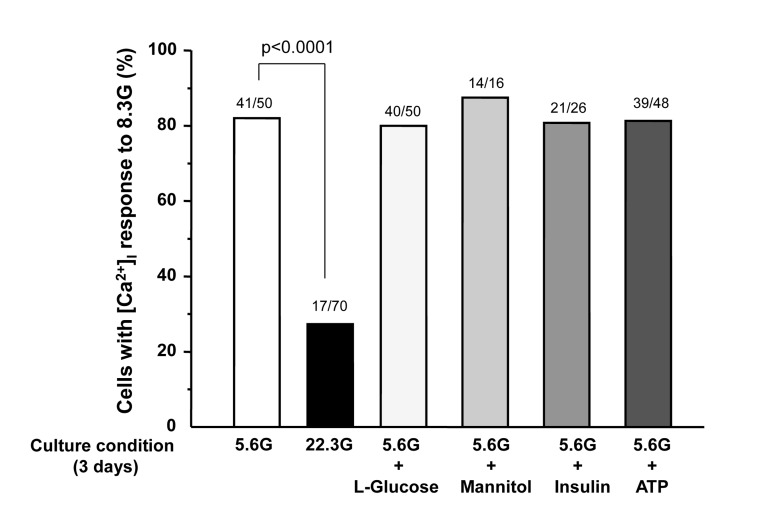
Figure 4. Percentage of β-cells that respond to 8.3 mM glucose after culture for 3 days in described conditions. Numbers on top of the bar indicate the number of cells that responded with [Ca2+]i increases over that examined.
In β-cells after culture with 16.7 mM mannitol, 10−5 M insulin or 10−5 M ATP, the amplitude of the [Ca2+]i increase in response to 8.3 mM glucose was suppressed (Fig. 3D-F), while the incidence of the [Ca2+]i increase was unaltered (Fig. 4). The amplitude of the [Ca2+]i response to tolbutamide and that to arginine were also suppressed. These results indicate that increases in extracellular osmolarity, insulin and ATP do not mediate the action of HG to eliminate [Ca2+]i responses to 8.3 mM glucose. The result that the exposure to high L-glucose failed to impair β-cells suggests that the elevated metabolism of glucose is involved in the glucotoxicity in β-cells.
The β-cell function related to insulin secretion was also assessed by the decrease in fluorescence of quinacrine loaded in the secretory granules of β-cells. In a single β-cell after culture with control 5.6 mM glucose for 3 days, the quinacrine fluorescence from the cell decreased substantially in response to a rise in the superfusate glucose concentration from 2.8 to 8.3 mM (Fig. 5A). In a single β-cell after culture with HG for 3 days, in contrast, the quinacrine fluorescence from the cell decreased only slightly (Fig. 5B) and the rate of decrease was significantly less than that in β-cells after control culture (Fig. 5C). These results of [Ca2+]i and quinacrine fluorecence measurements suggest that the treatment with HG for 3 days results in impairment of the β-cell functional responses to physiological glucose stimulation.
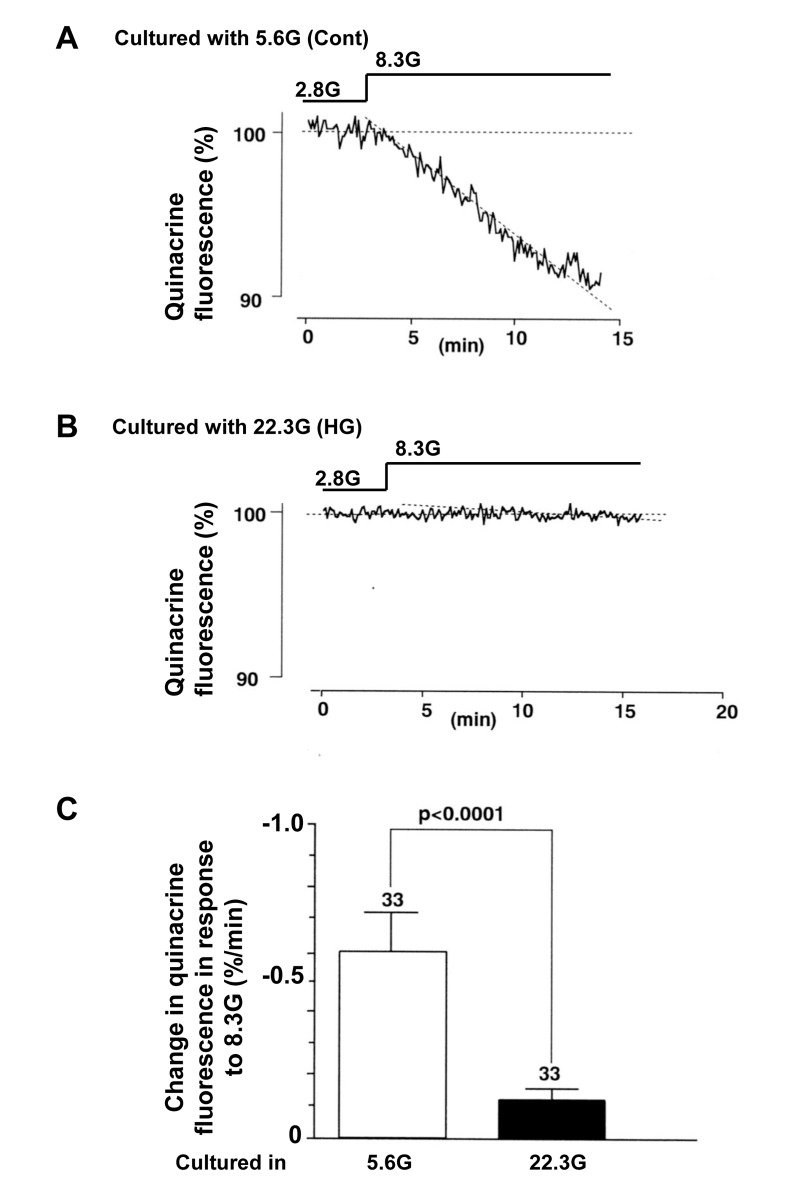
Figure 5. Insulin secretory response to physiologic glucose challenge assessed by decrease of quinacrine fluorescence in β-cells following culture in high (22.3 mM) glucose (A) and control culture in 5.6 mM glucose (B). C, Rate of quiniacrine fluorescence decrease. Numbers above the bar indicate the number of recordings.
To examine the contribution of hexosamine pathway, azaserine (10 μM) and glucosamine (2 mM) were added to culture. The administration of azaserine, a glutamine analog that inhibits hexosamine pathway, restored [Ca2+]i response to 8.3 mM glucose: the response occurred in 36 of 53 (68%) β-cells cultured in HG condition (22.3 mM) for 3 days (Fig. 6A,C). Conversely, administration in culture of glucosamine, which enhances the flow through the hexosamine pathway by bypassing GFAT (Fig. 1), either abolished or suppressed [Ca2+]i responses to 8.3 mM glucose (Fig. 6B,C), while the responsiveness to tolbutamide and arginine was preserved or only partially suppressed (Fig. 6B). Thus, glucosamine mimicked HG in impairing the β-cell ability to respond to physiological glucose with [Ca2+]i increases.
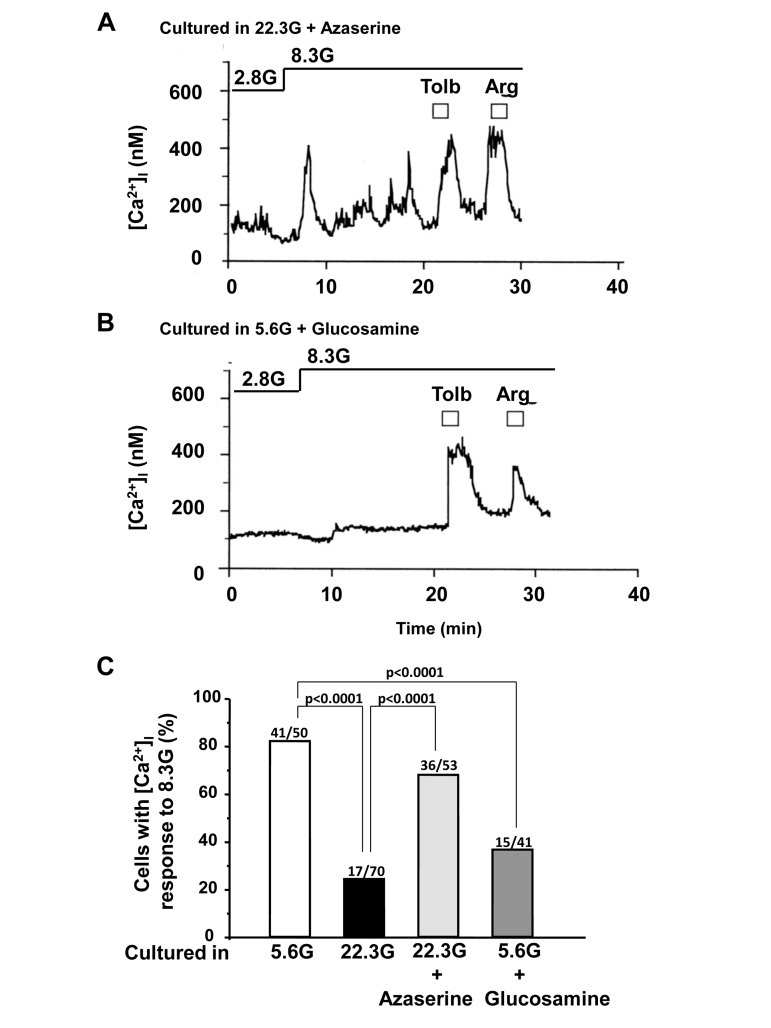
Figure 6. Effects of administration of azaserine and glucosamine in culture on subsequent [Ca2+]i responses to physiologic glucose in β-cells. A, Azaserine added in culture prevented the high (22.3 mM) glucose-induced impairment of [Ca2+]i responses to physiological glucose challenge. A representative of 36 cells. B, Glucosamine added in control culture with 5.6 mM glucose resulted in impairment of [Ca2+]i responses to physiological glucose challenge. N=15. C, Incidence of [Ca2+]i responses to 8.3 mM glucose in β-cells after culture for 3 days in described conditions. Numbers on top of bar indicate the number of cells that responded with [Ca2+]i increases over that examined.
Discussion
We found that exposure of single pancreatic β-cells for 3 days to 22.3 mM glucose, the HG condition in this study, impaired their ability to respond to physiological (8.3 mM) glucose challenge, confirming previous report [14]. The novel finding of the present study is that this effect of HG is due primarily to its direct action on β-cells. The [Ca2+]i response to a physiological glucose challenge was reduced by culture with HG. Following culture with elevated osmolarity, insulin or ATP, the incidence of [Ca2+]i responses to 8.3 mM glucose was not altered, while their amplitude was attenuated. These conditions also attenuated the amplitude of [Ca2+]i responses to tolbutamide and arginine. Thus, the elevated extracellular osmolarity, insulin and ATP suppressed β-cell responses to the three insulin secretagogues, a property not fitting to the glucotoxicity that refers to the reduced responsiveness preferentially to glucose [15]. Taken together, the present results indicate that the HG-induced glucotoxicity in β-cells is produced mainly via the action of glucose but not increased osmolarity, insulin and ATP, although minor contribution of the latter factors cannot be excluded.
In this study, application of azaserine, which inhibits the hexosamine pathway, prevented the action of HG in culture to impair the [Ca2+]i response to physiological glucose challange. Conversely, administration in culture of glucosamine, which enters the hexosamine pathway by bypassing GFAT, impaired [Ca2+]i responses to physiological glucose challange in β-cells cultured with normal 5.6 mM glucose. Although hexosamine pathway is a relatively minor branch of glycolytic pathway (about 3% of total glucose utilization) [16,17], several studies have reported that the flux through hexosamine pathway may play a major role in the development of IR and other complications accompanying diabetes [16-22]. Moreover, it has been reported that the hexosa-mine pathway serves to impair GSIS in β-cells [8,9]. These results by us and others suggest that the hexosamine pathway substantially mediates the HG action to attenuate the response to physiological glucose stimulation in β-cells. It was reported that the reduction of GSIS due to an increased flux through hexosamine pathway was due to reduced expression of key proteins or enzymes that promote insulin secretion in β-cells [9,10,22]. However, further studies are required to elucidate the precise mechanisms underlying the HG-induced impairment of the [Ca2+]i responses to physiologic glucose challange in β-cells.
Diabetes has become one of the most pernicious and widespread health problems in the world. It is important to apply an effective treatment in the early stage of diabetes before it progresses to serious stage with various complications. Glocotoxicity in pancreatic β-cells is one of the key processes that take place from the early stage of impaired glucose tolerance and thereby initiates and accelerates type 2 diabetes. The present finding that the hexosamine pathway substantially mediates the glocotoxicity in pancreatic β-cells provides a new and effective target for the treatment of diabetes in its early stage.
Materials and Methods
Preparation of single islet β-cells
Islets and isolated β-cells were prepared as previously reported [23,24]. Briefly, islets were isolated from Wister rats aged 10-16 weeks by collagenase digestion. Animals were anesthesized with intraperitoneal injection of pentobarbitone at 80 mg/kg. Islets were isolated and washed with HKRB buffer (in mmol/l: 5 CaCl2, 2.8 glucose, 129 NaCl, 4.7 KCl, 1.2 KH2PO4, 5 NaHCO3, 1.2 MgSO4, 10 HEPES, pH 7.4). Single β-cells were prepared from islets by treatment with Ca2+-free HKRB made with 0.1 mmol/l EGTA (Sigma Chemicals Co., St. Louis MO). β-cells were cultured in Eagle's MEM supplemented with 10% (v/v) fatal bovine serum, 100 mg/ml streptomycin and 100 U/ml penicillin and cultured at 37°C in a 95% air plus 5% CO2 atmosphere.
Application of glucose, L-glucose, mannitol, insulin, ATP, glucosamine and azaserine
Glucose (5.6 mM, 22.3 mM), L-glucose (16.7 mM), mannitol (16.7 mM), insulin (10−5 M), ATP (10−5 M), glucosamine (2 mM) and azaserine (10 μM) (Sigma Chemicals Co., St. Louis MO) were added in culture medium for three days prior to [Ca2+]i measurements.
[Ca2+]i measurements
Following culture for 3 days under control and test conditions, the cells were first incubated in HKRB containing 2.8 mM glucose for 30 min for stabilization and then subjected to the measurement of cytoplasmic Ca2+ concentration ([Ca2+]i) (Fig 2). [Ca2+]i in β-cells isolated from islets were measured as previously described [13]. In brief, single β-cells were incubated with HKRB containing 3 μmol/l fura-2/AM (Dojin chemical, Kumamoto, Japan) and 2.8 mmol/l glucose for 30 min at 37°C. Following incubation, they were transferred to an open chamber mounted on the stage of fluorescence microscope. The cells were superfused with HKRB at a rate of 1 ml/min at 37°C. Fura-2 was exited alternately at 340 and 380 nm every 5 sec, and the emission fluorescence at 510 nm was detected by a cooled charge-coupled device camera, and the ratio (F340/F380) of corresponding fluorescence was calculated. Images were produced by an Argus 50 system (Hamamatsu Photonics, Hamamatsu, Japan). Ratio values were converted to [Ca2+]i according to calibration curves. Peak values of [Ca2+]i were used for statistical analysis. The identity of β-cells was confirmed by cell diameter and [Ca2+]i responses to sulfonylurea tolbutamide (0.3 mM) as reported previously [13]. When changes in ratio (F340/F380) took place within 5 min after administration of reagents and their amplitudes were more than 0.4 ratio unit, they were considered to be responses.
Assessment of exocytosis
Insulin secretion was evaluated by the loss of quinacrine fluorescence from prelabelled single β-cells upon stimulation with physiological glucose concentration. The β-cells on coverslips were incubated with 200 nM quinacrine (Sigma Chemicals Co., St. Louis MO) for 3 h at 25°C. Quinacrine microfluorometry was performed under conditions identical to those used for [Ca2+]i measurements. The cells were excited at 340 nm every 5 sec and emission signals at 510 nm were detected with an intensified charge-coupled device (ICCD) camera. Exocytosis was assessed by the loss of the quinacrine fluorescence and expressed as a change in fluorescence intensity per minute.
Statistical analysis
All values were expressed as mean ± SEM (n=number of observation). The statistical analysis was carried out using Tukey type multiple comparison test for rank values of variables, and χ2 test and Exact test by Monte Carlo.
Acknowledgments
This work was partly supported by Grant-in-Aid for Scientific Research (C) (24591341) from Japan Society for the Promotion of Science (JSPS) and Memorial Foundation for Female Natural Scientists and Kowa Life Science Foundation to YM, and by Grant-in-Aid for Scientific Research (B) (23390044) and Challenging Exploratory Research (24659101) from JSPS, Strategic Research Program for Brain Sciences (10036069) by the Ministry of Education, Culture, Sports, Science and Technology of Japan (MEXT), MEXT-Supported Program for the Strategic Research Foundation at Private Universities 2011-2015 (Cooperative Basic and Clinical Research on Circadian Medicine), and Grants from Japan Diabetes Foundation, Uehara Memorial Foundation, and Japan Diabetes Foundation to TY. This study was subsidized by JKA through its promotion funds from KEIRIN RACE to TY. We thank Dr. Juris Galvanovskis (Oxford Univ, UK) for the critical reading of the paper.
Conflicts of Interest
The authors declare no conflict of interest.
References
- 1. Singleton JR and Smith AG. Therapy insight: neurological complications of prediabetes. Nat Clin Pract Neurol. 2006; 2: 276 -282. [PubMed] .
- 2. Meigs JB, D'Agostino RBS, Nathan DM, Rifai N, Wilson PW. Longitudinal association of glycemia and microalbuminuria: the Framingham Offspring Study. Diabetes Care. 2002; 25: 977 -983. [PubMed] .
- 3. Singleton JR, Smith AG, Russell JW, Feldman EL. Microvascular complications of impaired glucose tolerance. Diabetes. 2003; 52: 2867 -2873. [PubMed] .
- 4. Blagosklonny MV. TOR-centric view on insulin resistance and diabetic complications: perspective for endocrinologists and gerontologists. Cell Death Dis. 2013; 4: e964 doi: 10.1038/cddis.2013.506 [PubMed] .
- 5. Rosetti L, Giaccari A, DeFronzo RA. Glucose toxicity. Diabetes Care. 1990; 13: 610 -630. [PubMed] .
- 6. Robertson RP. Type II diabetes, glucose “non-sence” and islet desensitization. Diabetes. 1989; 38: 1501 -1505. [PubMed] .
- 7. Hammes HP, Du X, Edelstein D, Taguchi T, Matsumura T, Ju Q, Lin J, Bierhaus A, Nawroth P, Hannak D, Neumaier M, Bergfeld R, Giardino I, Brownlee M. Benfotamine blocks three major pathways of hyperglycaemic damage and prevents experimental diabetic retinopathy. Nature Med. 2003; 9: 294 -299. [PubMed] .
- 8. Bensellam M, Laybutt DR, Jonas JC. The molecular mechanisms of pancreatic b-cell glucotoxicity: recent findings and futu research directions. Mol Cell Endocrinol. 2012; 364: 1 -27. [PubMed] .
- 9. Yoshikawa H, Tajiri Y, Sako Y, Hashimoto T, Umeda F, Nawata H. Glucosamine-induced β-cell dysfunction: possible invol-vement of glucokinase or glucose-transporter type 2. Pancreas. 2002; 24: 228 -234. [PubMed] .
- 10. D'Alessandris, Andreozzi F, Federici M, Cardellini M, Brunetti A, Ranalli M, Del Guerra S, Lauro D, Del Prato S, Marchetti P, Lauro R, Sesti G. Increased O-glycosylation of insulin signalling proteins results in their impaired activation and enhanced susceptibility to apoptosis in pancreatic b-cells. FASEB J. 2004; 18: 959 -961. [PubMed] .
- 11. Rorsman P. The pancreatic β-cell as a fuel sensor: an electrophysiologist's viewpoint. Diabetologia. 1997; 40: 487 -495. [PubMed] .
- 12. Ashcroft FM and Gribble FM. ATP-sensitive K+ channels and insulin secretion: their role in the health and disease. Diabetologia. 1999; 42: 903 -919. [PubMed] .
- 13. Yada T, Sakurada M, Ishida K, Nakata M, Murata F, Arimura A, Kikuchi M. Pituitary adenylate cyclise activating polypeptide is an extraordinarily potent intra-pancreatic regulator of insulin secretion from islet beta-cells. J Biol Chem. 1994; 269: 1290 -1293. [PubMed] .
- 14. Okamoto Y, Ishida H, Taminato T, Tsuji K, Kurose T, Tsuura Y, Kato S, Imura H, Seino Y. Role of cytosolic Ca2+ in impaired sensitivity to glucose of rat pancreatic islets exposed to high glucose in vitro. Diabetes. 1992; 41: 1555 -1561. [PubMed] .
- 15. Sako Y and Grill VE. Coupling of beta-cell desensitization by hyperglycemia to excessive stimulation and circulating insulin in glucose-infused rats. Diabetes. 1990; 39: 1580 -1583. [PubMed] .
- 16. Marshall S, Bacote V, Traxinger RR. Discovery of metabolic pathway mediating glucose-induced desensitization of the glucose transport system. Role of hexasomine biosynthesis in the induction of insulin resistance. J Biol Chem. 1991; 266: 4706 -4712. [PubMed] .
- 17. McClain DA. Hexosamines as mediators of nutrient sensing and regulation in diabetes. J Diabetes Complications. 2002; 16: 72 -80. [PubMed] .
- 18. Buse MG. Hexosamines insulin resistance and the complications of diabetes: current status. Am J Physiol Endocrinol Metab. 2006; 290: E1 -E8. [PubMed] .
- 19. Lombardi A, Ulianich L, Treglia AS, Nigro C, Parrillo L, Lofrumento DD, Nicolardi G, Garbi C, Beguinot F, Miele C, Di Jeso B. Increased hexosamine biosynthetic pathway flux dedifferentiates INS-1E cells and murine islets by an extracellular signal-regulated kinase (ERK)1/2-mediated signal transmission pathway. Diabetologia. 2012; 55: 141 -153. [PubMed] .
- 20. Isaad T and Kuo M. O-GlcNAc modification of transcription factors, glucose sensing and glucotoxicity. Trends in Endocrinol Metab. 2008; 19: 380 -389. [PubMed] .
- 21. Virkamaki A, Daniels MC, Hamalainen S, Utriainen T, Mcclain D, Yki-Jarvinen H. Activation of hexosamine pathway by glucosamine in vivo induces insulin resistance in multiple insulin sensitive tissues. Endocrinology. 1997; 138: 2501 -2507. [PubMed] .
- 22. Zraika S, Dunlop M, Proietto J, Andrikopoulos S. The hexosamine biosynthesis pathway regulates insulin secretion via glycosylation in mouse islets. Arch Biochem Biophys. 2002; 405: 275 -279. [PubMed] .
- 23. Shimomura K, Galvanovskis J, Goldworthy M, Hugill A, Kaizik S, Lee A, Meadows N, Quwailid MM, Rydstrom J, Teboul L, Ashcroft F, Cox RD. Insulin secretion from β-cells is affected by deletion on nicotinamide nucleotide transhydrogenase. Methods Enzymol. 2009; 457: 451 -480. [PubMed] .
- 24. Yada T, Kakei M, Tanaka H. Single pancreatic β-cells from normal rats exhibit an initial decrease and subsequent increase in cytosolic free Ca2+ in response to glucose. Cell Calcium. 1992; 13: 69 -76. [PubMed] .