


Introduction
With the benefit of combination antiretroviral therapy (cART), persons living with human immunodeficiency virus (PLWH) have survived to older ages [1,2] with fewer opportunistic infections and AIDS-defining cancers [3,4]. Despite these gains, the rise in the number of age-related conditions such as coronary artery disease [5], chronic obstructive pulmonary disease [6,7], and non-AIDS-defining cancers [8] has sparked interest in how PLWH age. The precise nature of this heightened aging process, whether in fact accelerated or merely accentuated [9], is still unknown. PLWH appear to have shorter peripheral blood telomere lengths compared with uninfected individuals [10–12], yet whether this represents a gradual attrition over the course of HIV infection or an abrupt shortening during periods of acute illness and profound immunosuppression has not been established. Recently, it has been shown in a cohort of cART-treated, virally suppressed PLWH that while telomere length, a surrogate marker of cellular aging, is shorter in PLWH compared with HIV-uninfected individuals, the slope of telomere length vs. age is no different between the two groups [11]. This might suggest that abrupt shortening does indeed occur early on in the course of disease, possibly at the period of intense immunosuppression related to acute HIV infection and prior to the institution of cART.
Identifying the timing of an aging trigger along the course of HIV infection has important scientific and clinical ramifications. At the very least, this allows further investigation into the biology of HIV aging to be situated in the appropriate time frame. Cellular changes observed within this time period provide important clues into the susceptibility of PLWH to age-related conditions. Shortening or preventing the onset of this time period may be one strategy that can improve outcomes in an aging HIV-infected population. Such investigations, however, require longitudinal sampling from subjects before and after HIV seroconversion. In this study, we examined surrogate peripheral blood aging markers in a cohort of injection drug users (IDU) followed longitudinally before and after acquiring HIV, aiming to 1) identify when age acceleration might occur in HIV and 2) describe potential key biologic pathways perturbed during the HIV seroconversion period. Useful biomarkers of aging, according to criteria adopted by the American Federation of Aging Research, are required to fulfill the following objectives: 1) predict the rate of aging; 2) reflect a biologic process associated with aging; 3) be able to be tested repeatedly in an individual without harm; and 4) translate from animals to humans [13]. Our choices of surrogate aging measures, both of which meet these criteria, focus on two distinct mechanisms, the first relating to replicative senescence by measuring peripheral blood telomere length and the second relating to age-associated methylation changes via a DNA methylation clock [14,15]. Shortened telomere length has been shown in some studies to predict mortality [16], age-related diseases [17], and has been widely used as a biomarker of aging. A recent study also demonstrated that the DNA methylation clock is a useful biomarker for detecting accelerated aging effects due to HIV infection [18], but the behavior over time of this biomarker is not yet known. Here we demonstrate for the first time that changes in surrogate aging biomarkers may be observed shortly after HIV infection.
Results
Study cohort
Demographics for the 31 patients enrolled in the study are provided in Table 1. The cohort had a mean age of 35.8 years and 48% were male. Nearly all patients (90%) had concurrent hepatitis C infection. The samples were collected between 1999 and 2004; by T3, only seven (22%) were on cART. The mean time intervals (± standard deviation [SD]) were 1.9 ± 1 years between T1 and T2 and 2.2 ± 1 years between T2 and T3.
Table 1. Demographics of the study cohort.
| Characteristic | Result (n=31) | ||||||||||||||||||||||||||||||||||||||||||||||||||||||||||||||||||||||||||||||||||||||||||||||||||
| Age (years ± SD) | 35.8 ±10.1 | ||||||||||||||||||||||||||||||||||||||||||||||||||||||||||||||||||||||||||||||||||||||||||||||||||
| Male Sex (%) | 15 (48.4%) | ||||||||||||||||||||||||||||||||||||||||||||||||||||||||||||||||||||||||||||||||||||||||||||||||||
| Ever Smoker (%) | 28 (90.3%) | ||||||||||||||||||||||||||||||||||||||||||||||||||||||||||||||||||||||||||||||||||||||||||||||||||
| CD4 Count at T2 (cells/mm3 ± SD) | 386 ± 213 | ||||||||||||||||||||||||||||||||||||||||||||||||||||||||||||||||||||||||||||||||||||||||||||||||||
| CD4 Count at T3 (cells/mm3 ± SD) | 273 ± 150 | ||||||||||||||||||||||||||||||||||||||||||||||||||||||||||||||||||||||||||||||||||||||||||||||||||
| Viral Load at T2 (copies/mL ± SD) | 96,432 ± 164,340 | ||||||||||||||||||||||||||||||||||||||||||||||||||||||||||||||||||||||||||||||||||||||||||||||||||
| Viral Load at T3 (copies/mL ± SD) | 58,461 ± 55,575 | ||||||||||||||||||||||||||||||||||||||||||||||||||||||||||||||||||||||||||||||||||||||||||||||||||
| On cART at T3 (%) | 7 (22.6%) | ||||||||||||||||||||||||||||||||||||||||||||||||||||||||||||||||||||||||||||||||||||||||||||||||||
| Hepatitis C | 28 (90%) | ||||||||||||||||||||||||||||||||||||||||||||||||||||||||||||||||||||||||||||||||||||||||||||||||||
| Current Homelessness | 15 (48.4%) | ||||||||||||||||||||||||||||||||||||||||||||||||||||||||||||||||||||||||||||||||||||||||||||||||||
| Injection Drug Use Within Last 6 Months | 25 (81%) | ||||||||||||||||||||||||||||||||||||||||||||||||||||||||||||||||||||||||||||||||||||||||||||||||||
| Previous Incarceration | 25 (88.2%) | ||||||||||||||||||||||||||||||||||||||||||||||||||||||||||||||||||||||||||||||||||||||||||||||||||
| History of Physical Abuse | 27 (87.0%) | ||||||||||||||||||||||||||||||||||||||||||||||||||||||||||||||||||||||||||||||||||||||||||||||||||
| History of Sexual Abuse | 15 (48.4%) | ||||||||||||||||||||||||||||||||||||||||||||||||||||||||||||||||||||||||||||||||||||||||||||||||||
| Heavy Alcohol Use Within Last 6 Months (>4 drinks/day) | 5 (16.1%) | ||||||||||||||||||||||||||||||||||||||||||||||||||||||||||||||||||||||||||||||||||||||||||||||||||
| Abbreviations: SD – standard deviation; cART – combination antiretroviral therapy | |||||||||||||||||||||||||||||||||||||||||||||||||||||||||||||||||||||||||||||||||||||||||||||||||||
Absolute telomere length measurements
29 paired samples from T1 and T2 and 17 paired samples from T2 and T3 were included in the final analysis after samples from two individuals between T1 and T2 and two individuals between T2 and T3 failed qPCR runs. The correlation between telomere length and age is shown in Figure 1A (p=0.017, Pearson’s rho=-0.268). The mean telomere length (± SD) was 227 ± 46 kbp/genome at T1, 201 ± 48 kbp/genome at T2, and 186 ± 27 kbp/genome at T3 (Figure 1B). Paired t-test analysis showed that the telomere length at T2 was significantly shorter than T1 (p=0.045), but that the telomere length at T3 was not significantly different from T2 (p=0.244). There were no significant differences at the T3 time point between the telomere lengths of subjects on cART and those not being treated with cART, nor were there any differences between those with detectable or undetectable viral loads or between those with CD4 counts <200 cells/mm3 or ≥200 cells/mm3.
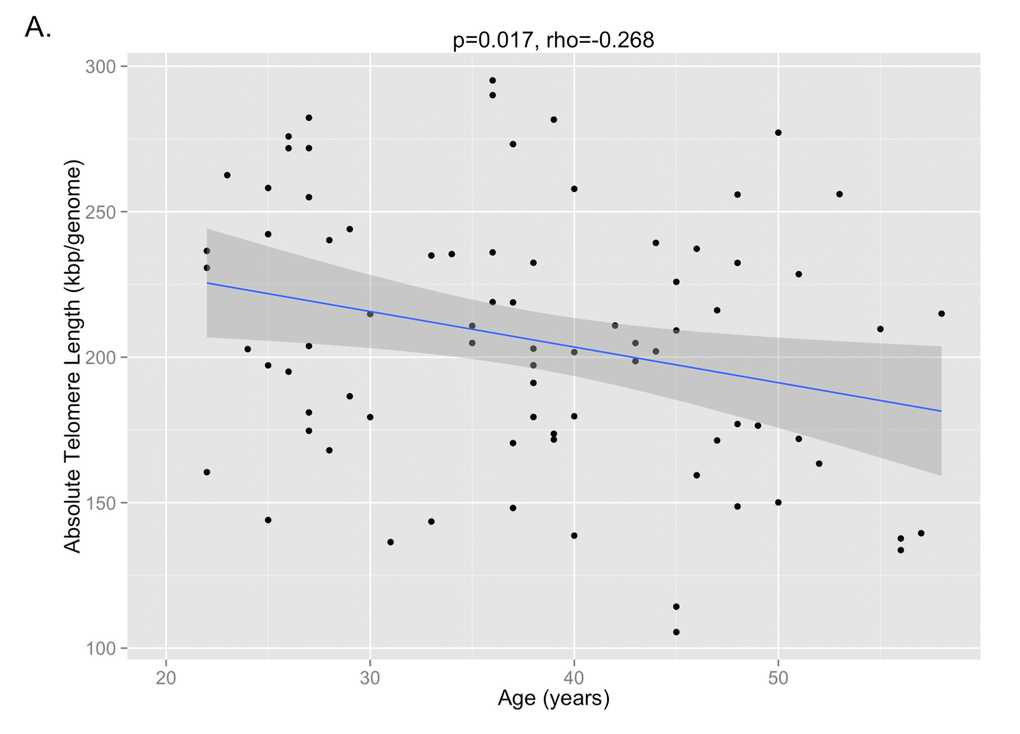
Figure 1A. The correlation between absolute telomere length and age is shown, demonstrating that shorter telomere lengths are observed with older age (p=0.017, Pearson’s rho=-0.268).
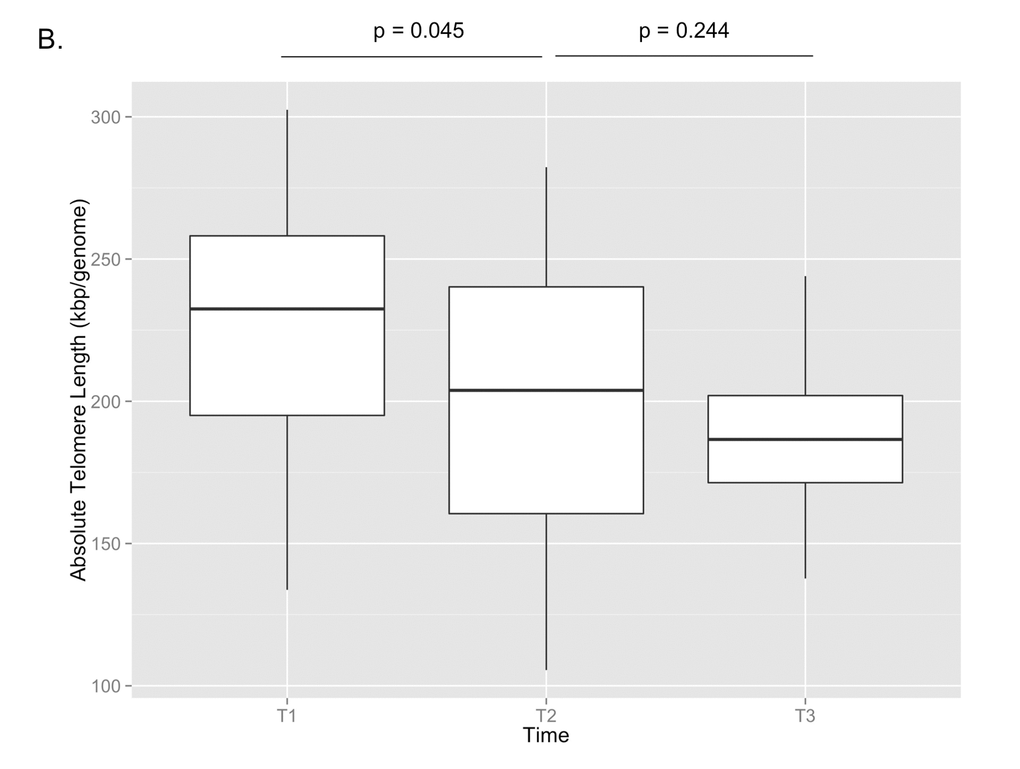
Figure 1B. Absolute telomere length measurements are shown for T1, T2, and T3. By paired t-test, there was a significant decrease in telomere length between T1 and T2 (p=0.045), but no significant change between T2 and T3 (p=0.244).
DNA methylation age
The DNA methylation age was calculated for each subject at the various time points. The correlation between DNA methylation age and chronologic age is shown in Figure 2A. To determine the magnitude of age acceleration over the duration of HIV infection, the correlation between the age acceleration residual and time point in days along the course of the study is shown in Figure 2B. Epigenetic age acceleration was positive correlated with days since HIV infection (p=0.035, Pearson’s r=0.236) which shows that HIV infection accelerates the biological aging rate of blood.
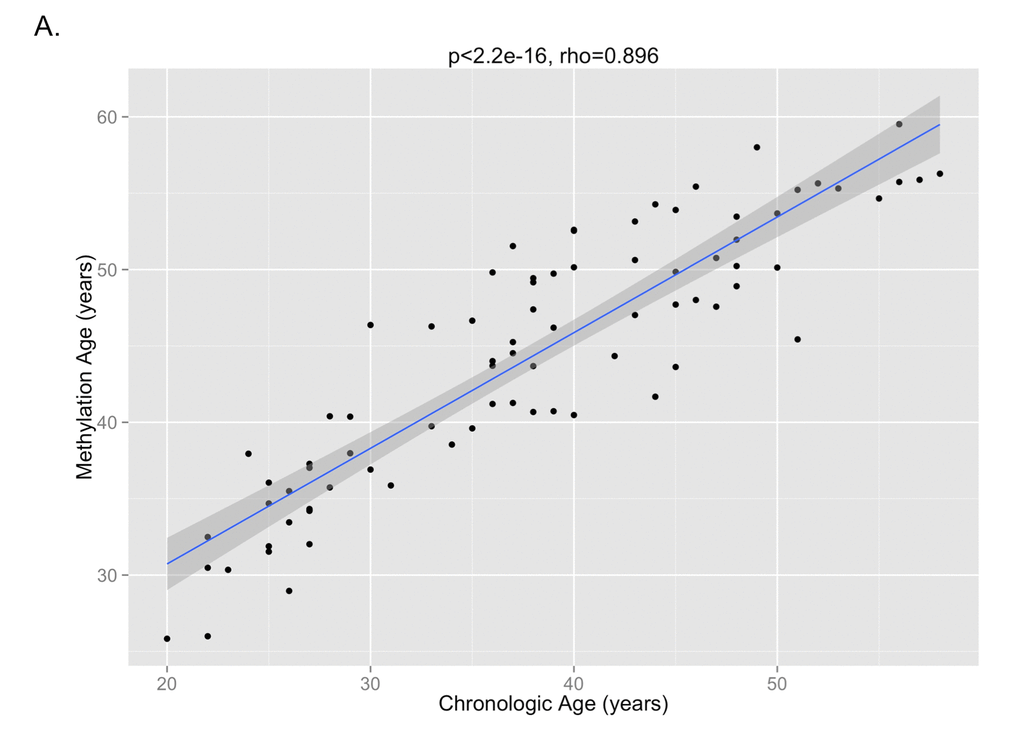
Figure 2A. The correlation between DNA methylation age and chronologic age from all subjects inclusive of all time points is shown, demonstrating a high correlation between the two measures (p<2.2e-16, Pearson’s rho=0.896).
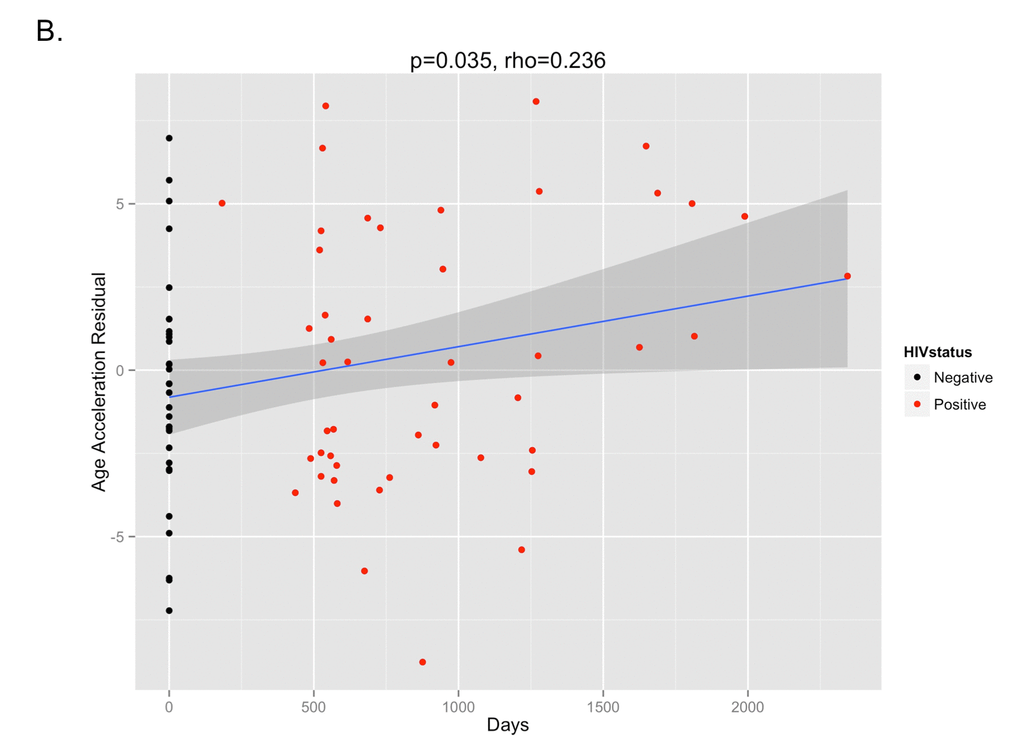
Figure 2B. The age acceleration residual (greater positivity on this scale represents more advanced methylation age in relation to chronologic age) increases over the time course of HIV infection (p=0.035, Pearson’s rho=0.236). Black dots represent HIV-negative time points (T1) while red dots represent HIV-positive time points (T2 and T3).
DNA methylation profiling
CD4 and CD8 T cell type proportion percentages at T1, T2, and T3 are provided in Supplementary Figure 1A and 1B. CD4 cell percentages decreased significantly between T1 and T2 (p<0.001), whereas CD8 cell percentages increased significantly between T1 and T2 (p<0.001). There were no significant changes in either CD4 or CD8 cell percentages between T2 and T3. Cell percentages of monocytes, NK cells, granulocytes, and B cells were not significantly different between the three time points (Supplementary Figure 1C, 1D, iE, 1F).
The top differentially methylated CpG sites between T1 and T2 are listed in Table 2. After adjustment for cellular composition of blood, there were two CpG sites differentially methylated between T1 and T2 with a q-value <0.05. These were cg07151565, corresponding to PCBP2 (hypomethylated in T2 vs. T1, q-value=0.012), and cg23654821, corresponding to CSRNP1 (hypermethylated in T2 vs. T1, q-value=0.028). There were four additional CpG sites that were differentially methylated with a q-value <0.20. These sites are shown in a volcano plot in Figure 3. One CpG site was found to be differentially methylated between T2 and T3, however only at a q-value of 0.065. This was cg07926733 (corresponding gene currently unknown). The mean beta-value difference (T3 vs. T2) was 0.064.
Table 2. Differentially methylated CpG sites (T2 vs. T1)
| CpG Site | Gene | Beta-Value Difference | q-value |
| cg07151565 | PCBP2 | -0.043 | 0.012 |
| cg23654821 | CSRNP1 | 0.085 | 0.028 |
| cg10252135 | PDE7a | 0.023 | 0.180 |
| cg21149466 | Unknown | -0.057 | 0.180 |
| cg02854554 | FAM46C | 0.056 | 0.180 |
| cg25353281 | PNKD;TMBIM1 | 0.083 | 0.180 |
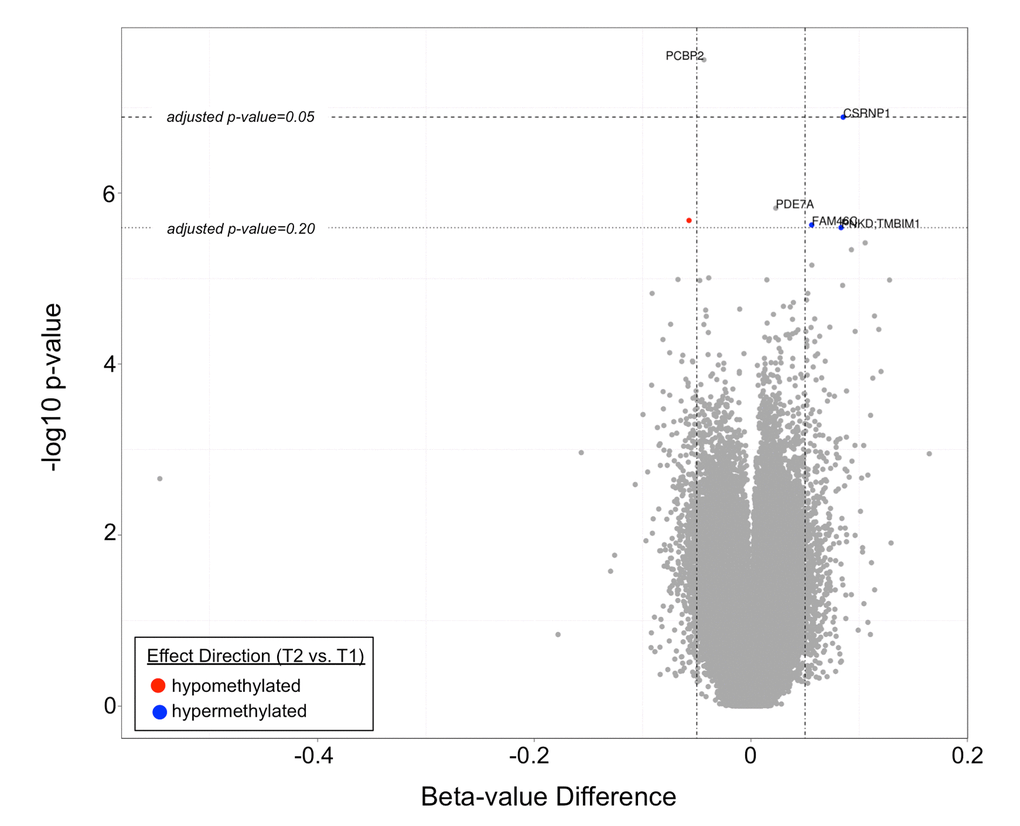
Figure 3. A volcano plot demonstrating differentially methylated CpG sites in T2 vs. T1. Two CpG sites (corresponding to PCBP2 and CSRNP1) had q-values <0.05, while four additional CpG sites (corresponding to PDE7a, FAM46C, PNKD:TMBIM1, and an unknown gene) had q-values <0.20.
Pyrosequencing validation
Pyrosequencing validation was carried out for five of the six differentially methylated CpG sites between T1 and T2 (cg10252135 was not validated due to the small beta-value difference of 0.023 which was within the range of pyrosequencing error) and for the one differentially methylated CpG site between T2 and T3. Spearman correlation plots for the six CpG sites are shown in Supplementary Figure 2. Four CpG sites had Spearman correlation rho values near or above 0.8, indicating agreement between the two methods (cg02854554, cg23654821, cg25353281, and cg07926733).
Discussion
In this study investigating longitudinal blood samples of IDUs who subsequently contracted HIV, we found an acute telomere shortening signal in the immediate post-seroconversion period. Telomere length subsequently stabilized in the post-seroconversion period with no significant changes observed between the T2 and T3 time points. The magnitude of telomere length shortening between T1 and T2, almost 30 kbp/genome in an average time span of two years or less (equivalent to a loss of ~650 base pairs/year), was a striking finding reflecting the severity of replicative senescence in HIV. A previous study that used the same method of telomere length measurement across a large general population sample showed that an equivalent drop in telomere length would have taken roughly 40 years [11]. On average, leukocyte telomere length is expected to decline only by approximately 25 base pairs per year in the general population [19]. No doubt, the VIDUS population, all IDUs, represent a specific high-risk group of individuals, but the additional stress of acute HIV infection may account for the extra telomere length loss. Future prospective studies evaluating the equivalent drop in telomere length for IDUs who did not contract HIV would be key to determining whether these findings are HIV-specific.
Telomere length, however, reflects only one particular aspect of the complex process of aging. Moreover, it is an imperfect reflection, carrying only a correlation of 0.3 with chronologic age [19]. Studies that have evaluated the association between telomere length with mortality have also yielded conflicting results [20]. For these reasons, we chose to measure aging by an additional method. While telomere shortening is a surrogate measure of the limits of cellular replication and of oxidative stress, DNA methylation changes over time represent the loss of methylation fidelity through cell division, a process known as “epigenetic drift” [21]. Overall patterns of methylation changes suggest that methylation tends to increase in promoter regions and decrease in non-island regions with age [22]. Recently developed methylation clocks, constructed based on these principles, can thus serve as additional evidence of aging in HIV. We observed greater deviations of the DNA methylation age from expected trajectories the further subjects were from their HIV diagnosis date. It is important to note, though, that the DNA methylation aging clock reflects a separate process of senescence from telomere shortening, with at best only a weak correlation between the two different measures [23]. In our data, we do not observe a significant correlation between epigenetic age acceleration and telomere length (p=0.60, rho=-0.06, Supplementary Figure 3) which shows that the epigenetic clock relates to a biological process that is distinct from that of telomere attrition.
By using a genome-wide DNA methylation platform, we performed a preliminary investigation into the unique biology of the HIV peri-seroconversion period. Methylation changes between T1 and T2 were subtle, with an average beta-value difference in CpG sites between the two time points not exceeding 10%, yet still revealed interesting genes that might serve as the target for future mechanistic work. The most significant changes were observed at CpG sites associated with the PCBP2 and CSRNP1 genes, which had q-values <0.05. PCBP2, found to be hypermethylated following seroconversion, encodes for poly(RC) binding protein 2, which has been demonstrated to be a translational coactivator of a number of viruses including polio [24,25], norovirus [26], and hepatitis C [27,28]. Notably, it has also been reported to play a role in HIV-1 gene expression [29]. Depletion of PCBP2 through siRNA results in increased expression of HIV-1 Gag and Env protein, for instance. CSRNP1, hypomethylated following seroconversion, encodes for cysteine-serine-rich nuclear protein 1 which through the Wnt signaling pathway has been shown to have a tumor suppressive function [30]. While there are no reported associations with HIV infection to our knowledge in the literature, the increased risk borne by PLWH for both AIDS-related and non-AIDS-related malignancies suggests this may be a relevant gene for investigating oncologic risk in this population. Genes found to be differentially methylated between T1 and T2 at lesser statistical significance included PDE7a (involved in cAMP degradation) [31], FAM46C (involved in the enhancement of viral replication) [32], PNKD (involved in familial paroxysmal nonkinesigenic dyskinesia) [33], and TMBIM1 (involved in vascular remodeling through matrix metalloproteinase 9) [34]. As far as we are aware, none of these have previously been reported to have associations with HIV infection. Further validation of these targets, particularly with additional HIV-negative samples, is necessary at this point.
This study has several limitations which should be noted. First, without concurrent RNA or protein samples, DNA methylation alone cannot tell us the direction of gene expression or protein transcription. While genes methylated at their promoter CpG islands have traditionally been thought to be transcriptionally silent, this is no longer considered an exact rule [35]. Therefore, despite significant associations between HIV seroconversion and PCBP2 and CSRNP1 we are unable to determine whether these genes are up- or down-regulated, only that it is possible their expression may be altered by their methylation status. Second, the changes we observe in telomere length and DNA methylation with HIV seroconversion are limited here to IDUs, a unique population at a high risk for additional infections and health problems such as bacterial endocarditis and hepatitis C. Whether similar changes occur in non-IDUs contracting HIV are observed is unknown. Such investigations are hampered by the fact that very few cohorts exist that have longitudinally tracked high-risk populations prior to and following HIV infection. It should be noted that in a previous analysis of HIV-infected patients, telomere length was not significantly affected by Hepatitis C status (data not shown). Third, DNA methylation is highly associated with cell type composition. We have used a statistical method to deconvolute the cell composition of our whole blood samples; however, these methods can only partially account for the many cell subtypes that exist in peripheral blood [36]. Currently, statistical deconvolution methods have not included subsets of NK cells or myeloid cells that may also contribute to the overall methylation signature. Finally, the small sample size of our study is a limitation and certainly further work in larger cohorts would be key to strengthening these findings. In particular, expansion of the cohort to include IDUs who remained HIV-negative throughout the study period would be important to determine whether the findings of this study are specific to the HIV or IDU populations. We were also underpowered in this study to determine whether aging is more pronounced in those with more severe HIV, as marked by higher viral loads and lower CD4 cell counts. Subgroup analyses in a larger cohort would be important to pursue to investigate this hypothesis.
The results of this study suggest that the time period shortly after HIV seroconversion may be critical in the aging process of PLWH. Given that this is a time where profound changes occur in the immune system, with rapid destruction of CD4 T cells and proliferation of CD8 T cells, targeting this interval with immediate cART initiation may be one therapeutic intervention that can mitigate downstream aging complications. Such a theory warrants further prospective study and may be imperative in a population whose demographics are quickly aging.
Materials and Methods
Study cohort
Subjects were enrolled from the Vancouver Injection Drug Users Study (VIDUS), a prospective cohort study of >1,000 IDUs in the Vancouver area that began in 1996 [37] (University of British Columbia Research Ethics Board Approval Number H01-50086). Enrollment criteria into the study included: 1) injection of illicit drugs at least once during the previous month, 2) residence in the Greater Vancouver area, and 3) ability to provide written informed consent. VIDUS participants were tested every six months for HIV and hepatitis C. Subjects included in this analysis had to have tested positive for HIV during follow-up with available peripheral blood samples prior to and after HIV seroconversion. Peripheral blood cell pellets were frozen at -70 degrees Celsius prior to use. 31 subjects were enrolled with pre- (T1) and post-seroconversion (T2) samples, with 19 of these subjects further providing an additional third blood sample (T3) approximately two years after the immediate post-seroconversion period.
Absolute telomere length measurement
Genomic DNA from peripheral blood cell pellets was harvested using the Qiagen DNeasy Blood & Tissue Kit (Qiagen, Venlo, the Netherlands). Absolute telomere length was measured by quantitative PCR consistent with methods outlined by O’Callaghan and Fenech [38]. Briefly, standard curves were generated from known quantities of synthesized oligomers of telomere (TEL) DNA [(TTAGGG)14] and single copy reference gene (36B4) DNA [CAGCAAGTGGGAAGGTGTAATCCGTCTCCACAGACAAGGCCAGGACTCGTTTGTACCCGTTGATGATAGAATGGG] (Sigma-Aldrich, St. Louis, MO). Sample telomere DNA length was then assessed based on the ratio of telomere DNA length to 36B4 DNA length as obtained from their respective standard curves. DNA from a short telomere cell line (HEK293) and a long telomere cell line (K562) (ATCC, Manassas, VA) were used as inter-experimental plate controls [39]. The telomere lengths measured using this method reflect an average length across the population of cells included in the sample. Samples were run in triplicate using the ABI ViiA 7 Real Time PCR System (Applied Biosystems, Foster City, CA). All samples were concurrently run to avoid significant batch effects. Paired t-tests were performed to compare telomere lengths at T1, T2, and T3 with p-values <0.05 (two-tailed tests) considered significant.
DNA methylation profiling
DNA extracted from the peripheral blood cell pellets was bisulfite-converted using the EZ DNA Methylation™ Kit (Zymo, Irvine, CA). This step converts unmethylated cytosine residues to uracil while leaving methylated cytosine residues intact. DNA methylation profiles were then obtained using the Illumina Infinium Methylation 450K assay, which interrogates 485,512 cytosine-guanine (CpG) sites spanning 99% of RefSeq genes, with an average of 17 CpG sites per gene [40]. In total, 96% of all CpG islands in the genome are assessed. Beta-values (the ratio of the methylated probe intensity to the overall intensity, ranging from 0 indicating all unmethylated to 1 indicating all methylated) are calculated for each CpG site and converted to M-values (the log2 ratio of the intensity of the methylated probe versus unmethylated probe) for statistical analyses [41]. These data were normalized using functional normalization which corrects for technical variation and is recommended for data sets where global methylation changes are expected [42]. CpG sites were filtered for detection quality and probe binding specificity [43].
DNA methylation age
We used the DNA methylation age-based biomarker of aging from Horvath because a) its accurate measurement of age across tissues is unprecedented [14]; b) it has been found to be useful for studying aging effects in HIV infection [18]; c) it is prognostic for all-cause mortality [15,44]; d) it correlates with measures of cognitive and physical fitness in the elderly [45]; e) it has been used in many applications including Down syndrome [46], obesity [23], lifetime stress [47], and Parkinson’s disease [48]; and f) it is applicable to populations of all ages, not just the elderly [49,50].
Here, we calculated the DNA methylation age for each sample according to the Horvath algorithm (https://horvath.genetics.ucla.edu/html/dnamage/) [14]. This method uses the weighted regression of 353 CpG sites on the Illumina 450K platform to calculate a methylation age. The age estimate (referred to as DNAm age or epigenetic age) is calibrated so that it is in units of years. The measure of epigenetic age acceleration was defined as the residual from regressing DNAm age on chronological age. By definition, this measure of age acceleration is not correlated with chronological age. Greater positivity in the age acceleration residual is indicative of faster age acceleration. The correlation between the age acceleration residual and duration of time along the study was calculated using a Pearson’s correlation test. P-values <0.05 were considered significant.
Differentially methylated CpG sites
Because methylation profiles can be affected by cell type proportions [51], we used a deconvolution method for calculating the percentage of CD4 T cells, CD8 T cells, natural killer cells, monocytes, B-cells, and granulocytes in whole blood samples based on the methylation signature [52]. Differences in normalized methylation M-values between T1 and T2, T2 and T3, and T1 and T3 were modeled using a linear regression framework, adjusting for the differences in the cellular composition of peripheral blood between time points:
Methylation difference ~ intercept + CD4 T cell-difference + CD8 T cell-difference + natural killer cell-difference + monocyte-difference + B-cell-difference + granulocyte-difference
The coefficient of interest for which a t-statistic p-value is calculated is the intercept, the null hypothesis being that the methylation difference (represented by the intercept) between time points is 0. This inference was implemented using the limma algorithm [53]. CpG sites with false discovery rate (FDR) q-values <0.05 were considered to be differentially methylated with a high degree of confidence; however, given the small sample size, CpG sites with q-values <0.20 (considered differentially methylated with a medium degree of confidence) were also identified and retained for pyrosequencing validation.
Pyrosequencing validation
CpG sites considered to be differentially methylated between time points at a q-value <0.20 were validated using bisulfite pyrosequencing methods. Further details on pyrosequencing methods and primer design are provided in the Supplementary Material. Reproducibility was assessed between pyrosequencing and the Illumina 450K normalized beta-values using Spearman’s rank correlation.
Statistical program
All statistical analyses were performed using R version 3.2.1.
Supplementary Materials
Conflicts of Interest
The authors declare no conflicts of interest.
Funding
This work was supported by the Canadian Institutes of Health Research (Grant Number: 342422). The VIDUS study was supported by the US National Institutes of Health (U01DA038886). KH is supported by the Canadian Institutes of Health Research New Investigator Award (MSH-141971).
References
- 1. Hogg RS, Heath KV, Yip B, Craib KJ, O’Shaughnessy MV, Schechter MT, Montaner JS. Improved survival among HIV-infected individuals following initiation of antiretroviral therapy. JAMA. 1998; 279:450–54. https://doi.org/10.1001/jama.279.6.450 [PubMed]
- 2. Samji H, Cescon A, Hogg RS, Modur SP, Althoff KN, Buchacz K, Burchell AN, Cohen M, Gebo KA, Gill MJ, Justice A, Kirk G, Klein MB, et al, and North American AIDS Cohort Collaboration on Research and Design (NA-ACCORD) of IeDEA. Closing the gap: increases in life expectancy among treated HIV-positive individuals in the United States and Canada. PLoS One. 2013; 8:e81355. https://doi.org/10.1371/journal.pone.0081355 [PubMed]
- 3. Palella FJ
Jr , Baker RK, Moorman AC, Chmiel JS, Wood KC, Brooks JT, Holmberg SD, and HIV Outpatient Study Investigators. Mortality in the highly active antiretroviral therapy era: changing causes of death and disease in the HIV outpatient study. J Acquir Immune Defic Syndr. 2006; 43:27–34. https://doi.org/10.1097/01.qai.0000233310.90484.16 [PubMed] - 4. Gebo KA, Fleishman JA, Moore RD. Hospitalizations for metabolic conditions, opportunistic infections, and injection drug use among HIV patients: trends between 1996 and 2000 in 12 states. J Acquir Immune Defic Syndr. 2005; 40:609–16. https://doi.org/10.1097/01.qai.0000171727.55553.78 [PubMed]
- 5. Hsue PY, Lo JC, Franklin A, Bolger AF, Martin JN, Deeks SG, Waters DD. Progression of atherosclerosis as assessed by carotid intima-media thickness in patients with HIV infection. Circulation. 2004; 109:1603–08. https://doi.org/10.1161/01.CIR.0000124480.32233.8A [PubMed]
- 6. Crothers KA, Butt AA, Gilbert CL, Rodriguez-Barradas MC, Crystal S, Justice AC. Veterans Aging Cohort 5 Project Team. Increased COPD among HIV-positive compared to HIV-negative veterans. Chest. 2006; 130:1326–33. https://doi.org/10.1378/chest.130.5.1326 [PubMed]
- 7. Crothers K, Huang L, Goulet JL, Goetz MB, Brown ST, Rodriguez-Barradas MC, Oursler KK, Rimland D, Gibert CL, Butt AA, Justice AC. HIV infection and risk for incident pulmonary diseases in the combination antiretroviral therapy era. Am J Respir Crit Care Med. 2011; 183:388–95. https://doi.org/10.1164/rccm.201006-0836OC [PubMed]
- 8. Simard EP, Pfeiffer RM, Engels EA. Cumulative incidence of cancer among individuals with acquired immunodeficiency syndrome in the United States. Cancer. 2011; 117:1089–96. https://doi.org/10.1002/cncr.25547 [PubMed]
- 9. Pathai S, Bajillan H, Landay AL, High KP. Is HIV a model of accelerated or accentuated aging? J Gerontol A Biol Sci Med Sci. 2014; 69:833–42. https://doi.org/10.1093/gerona/glt168 [PubMed]
- 10. Pathai S, Lawn SD, Gilbert CE, McGuinness D, McGlynn L, Weiss HA, Port J, Christ T, Barclay K, Wood R, Bekker LG, Shiels PG. Accelerated biological ageing in HIV-infected individuals in South Africa: a case-control study. AIDS. 2013; 27:2375–84. https://doi.org/10.1097/QAD.0b013e328363bf7f [PubMed]
- 11. Liu JC, Leung JM, Ngan DA, Nashta NF, Guillemi S, Harris M, Lima VD, Um SJ, Li Y, Tam S, Shaipanich T, Raju R, Hague C, et al. Absolute leukocyte telomere length in HIV-infected and uninfected individuals: evidence of accelerated cell senescence in HIV-associated chronic obstructive pulmonary disease. PLoS One. 2015; 10:e0124426. https://doi.org/10.1371/journal.pone.0124426 [PubMed]
- 12. Côté HC, Soudeyns H, Thorne A, Alimenti A, Lamarre V, Maan EJ, Sattha B, Singer J, Lapointe N, Money DM, Forbes J, Wong J, Bitnun A, et al, and CIHR Emerging Team in HIV therapy, aging (CARMA). Leukocyte telomere length in HIV-infected and HIV-exposed uninfected children: shorter telomeres with uncontrolled HIV viremia. PLoS One. 2012; 7:e39266. https://doi.org/10.1371/journal.pone.0039266 [PubMed]
- 13. Research AFfA. (2011). Biomarkers of Aging. American Federation for Aging Research).
- 14. Horvath S. DNA methylation age of human tissues and cell types. Genome Biol. 2013; 14:R115. https://doi.org/10.1186/gb-2013-14-10-r115 [PubMed]
- 15. Marioni RE, Shah S, McRae AF, Chen BH, Colicino E, Harris SE, Gibson J, Henders AK, Redmond P, Cox SR, Pattie A, Corley J, Murphy L, et al. DNA methylation age of blood predicts all-cause mortality in later life. Genome Biol. 2015; 16:25. https://doi.org/10.1186/s13059-015-0584-6 [PubMed]
- 16. Rode L, Nordestgaard BG, Bojesen SE. Peripheral blood leukocyte telomere length and mortality among 64,637 individuals from the general population. J Natl Cancer Inst. 2015; 107:djv074. https://doi.org/10.1093/jnci/djv074 [PubMed]
- 17. Armanios M. Telomeres and age-related disease: how telomere biology informs clinical paradigms. J Clin Invest. 2013; 123:996–1002. https://doi.org/10.1172/JCI66370 [PubMed]
- 18. Horvath S, Levine AJ. HIV-1 infection accelerates age according to the epigenetic clock. J Infect Dis. 2015; 212:1563–73. https://doi.org/10.1093/infdis/jiv277 [PubMed]
- 19. Müezzinler A, Zaineddin AK, Brenner H. A systematic review of leukocyte telomere length and age in adults. Ageing Res Rev. 2013; 12:509–19. https://doi.org/10.1016/j.arr.2013.01.003 [PubMed]
- 20. Sanders JL, Newman AB. Telomere length in epidemiology: a biomarker of aging, age-related disease, both, or neither? Epidemiol Rev. 2013; 35:112–31. https://doi.org/10.1093/epirev/mxs008 [PubMed]
- 21. Egger G, Liang G, Aparicio A, Jones PA. Epigenetics in human disease and prospects for epigenetic therapy. Nature. 2004; 429:457–63. https://doi.org/10.1038/nature02625 [PubMed]
- 22. Jones MJ, Goodman SJ, Kobor MS. DNA methylation and healthy human aging. Aging Cell. 2015; 14:924–32. https://doi.org/10.1111/acel.12349 [PubMed]
- 23. Horvath S, Erhart W, Brosch M, Ammerpohl O, von Schönfels W, Ahrens M, Heits N, Bell JT, Tsai PC, Spector TD, Deloukas P, Siebert R, Sipos B, et al. Obesity accelerates epigenetic aging of human liver. Proc Natl Acad Sci USA. 2014; 111:15538–43. https://doi.org/10.1073/pnas.1412759111 [PubMed]
- 24. Spear A, Sharma N, Flanegan JB. Protein-RNA tethering: the role of poly(C) binding protein 2 in poliovirus RNA replication. Virology. 2008; 374:280–91. https://doi.org/10.1016/j.virol.2007.12.039 [PubMed]
- 25. Chase AJ, Daijogo S, Semler BL. Inhibition of poliovirus-induced cleavage of cellular protein PCBP2 reduces the levels of viral RNA replication. J Virol. 2014; 88:3192–201. https://doi.org/10.1128/JVI.02503-13 [PubMed]
- 26. Murray CJ, Lopez AD. Alternative projections of mortality and disability by cause 1990-2020: Global Burden of Disease Study. Lancet. 1997; 349:1498–504. https://doi.org/10.1016/S0140-6736(96)07492-2 [PubMed]
- 27. Xin Z, Han W, Zhao Z, Xia Q, Yin B, Yuan J, Peng X. PCBP2 enhances the antiviral activity of IFN-α against HCV by stabilizing the mRNA of STAT1 and STAT2. PLoS One. 2011; 6:e25419. https://doi.org/10.1371/journal.pone.0025419 [PubMed]
- 28. Wang L, Jeng KS, Lai MM. Poly(C)-binding protein 2 interacts with sequences required for viral replication in the hepatitis C virus (HCV) 5′ untranslated region and directs HCV RNA replication through circularizing the viral genome. J Virol. 2011; 85:7954–64. https://doi.org/10.1128/JVI.00339-11 [PubMed]
- 29. Woolaway K, Asai K, Emili A, Cochrane A. hnRNP E1 and E2 have distinct roles in modulating HIV-1 gene expression. Retrovirology. 2007; 4:28. https://doi.org/10.1186/1742-4690-4-28 [PubMed]
- 30. Ishiguro H, Tsunoda T, Tanaka T, Fujii Y, Nakamura Y, Furukawa Y. Identification of AXUD1, a novel human gene induced by AXIN1 and its reduced expression in human carcinomas of the lung, liver, colon and kidney. Oncogene. 2001; 20:5062–66. https://doi.org/10.1038/sj.onc.1204603 [PubMed]
- 31. Han P, Zhu X, Michaeli T. Alternative splicing of the high affinity cAMP-specific phosphodiesterase (PDE7A) mRNA in human skeletal muscle and heart. J Biol Chem. 1997; 272:16152–57. https://doi.org/10.1074/jbc.272.26.16152 [PubMed]
- 32. Schoggins JW, Wilson SJ, Panis M, Murphy MY, Jones CT, Bieniasz P, Rice CM. A diverse range of gene products are effectors of the type I interferon antiviral response. Nature. 2011; 472:481–85. https://doi.org/10.1038/nature09907 [PubMed]
- 33. Lee HY, Xu Y, Huang Y, Ahn AH, Auburger GW, Pandolfo M, Kwiecinski H, Grimes DA, Lang AE, Nielsen JE, Averyanov Y, Servidei S, Friedman A, et al. The gene for paroxysmal non-kinesigenic dyskinesia encodes an enzyme in a stress response pathway. Hum Mol Genet. 2004; 13:3161–70. https://doi.org/10.1093/hmg/ddh330 [PubMed]
- 34. Zhao H, Ito A, Sakai N, Matsuzawa Y, Yamashita S, Nojima H. RECS1 is a negative regulator of matrix metalloproteinase-9 production and aged RECS1 knockout mice are prone to aortic dilation. Circ J. 2006; 70:615–24. https://doi.org/10.1253/circj.70.615 [PubMed]
- 35. van Eijk KR, de Jong S, Boks MP, Langeveld T, Colas F, Veldink JH, de Kovel CG, Janson E, Strengman E, Langfelder P, Kahn RS, van den Berg LH, Horvath S, Ophoff RA. Genetic analysis of DNA methylation and gene expression levels in whole blood of healthy human subjects. BMC Genomics. 2012; 13:636. https://doi.org/10.1186/1471-2164-13-636 [PubMed]
- 36. Houseman EA, Kim S, Kelsey KT, Wiencke JK. DNA Methylation in Whole Blood: uses and Challenges. Curr Environ Health Rep. 2015; 2:145–54. https://doi.org/10.1007/s40572-015-0050-3 [PubMed]
- 37. Strathdee SA, Patrick DM, Currie SL, Cornelisse PG, Rekart ML, Montaner JS, Schechter MT, O’Shaughnessy MV. Needle exchange is not enough: lessons from the Vancouver injecting drug use study. AIDS. 1997; 11:F59–65. https://doi.org/10.1097/00002030-199708000-00001 [PubMed]
- 38. O’Callaghan NJ, Fenech M. A quantitative PCR method for measuring absolute telomere length. Biol Proced Online. 2011; 13:3. https://doi.org/10.1186/1480-9222-13-3 [PubMed]
- 39. Fehrer C, Voglauer R, Wieser M, Pfister G, Brunauer R, Cioca D, Grubeck-Loebenstein B, Lepperdinger G. Techniques in gerontology: cell lines as standards for telomere length and telomerase activity assessment. Exp Gerontol. 2006; 41:648–51. https://doi.org/10.1016/j.exger.2006.03.016 [PubMed]
- 40. Morris TJ, Beck S. Analysis pipelines and packages for Infinium HumanMethylation450 BeadChip (450k) data. Methods. 2015; 72:3–8. https://doi.org/10.1016/j.ymeth.2014.08.011 [PubMed]
- 41. Du P, Zhang X, Huang CC, Jafari N, Kibbe WA, Hou L, Lin SM. Comparison of Beta-value and M-value methods for quantifying methylation levels by microarray analysis. BMC Bioinformatics. 2010; 11:587. https://doi.org/10.1186/1471-2105-11-587 [PubMed]
- 42. Fortin JP, Labbe A, Lemire M, Zanke BW, Hudson TJ, Fertig EJ, Greenwood CM, Hansen KD. Functional normalization of 450k methylation array data improves replication in large cancer studies. Genome Biol. 2014; 15:503. https://doi.org/10.1186/s13059-014-0503-2 [PubMed]
- 43. Chen YA, Lemire M, Choufani S, Butcher DT, Grafodatskaya D, Zanke BW, Gallinger S, Hudson TJ, Weksberg R. Discovery of cross-reactive probes and polymorphic CpGs in the Illumina Infinium HumanMethylation450 microarray. Epigenetics. 2013; 8:203–09. https://doi.org/10.4161/epi.23470 [PubMed]
- 44. Christiansen L, Lenart A, Tan Q, Vaupel JW, Aviv A, McGue M, Christensen K. DNA methylation age is associated with mortality in a longitudinal Danish twin study. Aging Cell. 2016; 15:149–54. https://doi.org/10.1111/acel.12421 [PubMed]
- 45. Marioni RE, Shah S, McRae AF, Ritchie SJ, Muniz-Terrera G, Harris SE, Gibson J, Redmond P, Cox SR, Pattie A, Corley J, Taylor A, Murphy L, et al. The epigenetic clock is correlated with physical and cognitive fitness in the Lothian Birth Cohort 1936. Int J Epidemiol. 2015; 44:1388–96. https://doi.org/10.1093/ije/dyu277 [PubMed]
- 46. Horvath S, Garagnani P, Bacalini MG, Pirazzini C, Salvioli S, Gentilini D, Di Blasio AM, Giuliani C, Tung S, Vinters HV, Franceschi C. Accelerated epigenetic aging in Down syndrome. Aging Cell. 2015; 14:491–95. https://doi.org/10.1111/acel.12325 [PubMed]
- 47. Zannas AS, Arloth J, Carrillo-Roa T, Iurato S, Röh S, Ressler KJ, Nemeroff CB, Smith AK, Bradley B, Heim C, Menke A, Lange JF, Brückl T, et al. Lifetime stress accelerates epigenetic aging in an urban, African American cohort: relevance of glucocorticoid signaling. Genome Biol. 2015; 16:266. https://doi.org/10.1186/s13059-015-0828-5 [PubMed]
- 48. Horvath S, Ritz BR. Increased epigenetic age and granulocyte counts in the blood of Parkinson’s disease patients. Aging (Albany NY). 2015; 7:1130–42. https://doi.org/10.18632/aging.100859 [PubMed]
- 49. Walker RF, Liu JS, Peters BA, Ritz BR, Wu T, Ophoff RA, Horvath S. Epigenetic age analysis of children who seem to evade aging. Aging (Albany NY). 2015; 7:334–39. https://doi.org/10.18632/aging.100744 [PubMed]
- 50. Simpkin AJ, Hemani G, Suderman M, Gaunt TR, Lyttleton O, Mcardle WL, Ring SM, Sharp GC, Tilling K, Horvath S, Kunze S, Peters A, Waldenberger M, et al. Prenatal and early life influences on epigenetic age in children: a study of mother-offspring pairs from two cohort studies. Hum Mol Genet. 2016; 25:191–201. https://doi.org/10.1093/hmg/ddv456 [PubMed]
- 51. Reinius LE, Acevedo N, Joerink M, Pershagen G, Dahlén SE, Greco D, Söderhäll C, Scheynius A, Kere J. Differential DNA methylation in purified human blood cells: implications for cell lineage and studies on disease susceptibility. PLoS One. 2012; 7:e41361. https://doi.org/10.1371/journal.pone.0041361 [PubMed]
- 52. Houseman EA, Accomando WP, Koestler DC, Christensen BC, Marsit CJ, Nelson HH, Wiencke JK, Kelsey KT. DNA methylation arrays as surrogate measures of cell mixture distribution. BMC Bioinformatics. 2012; 13:86. https://doi.org/10.1186/1471-2105-13-86 [PubMed]
- 53. Smyth GK. Linear models and empirical bayes methods for assessing differential expression in microarray experiments. Stat Appl Genet Mol Biol. 2004; 3:e3. https://doi.org/10.2202/1544-6115.1027 [PubMed]