An epigenetic aging clock for dogs and wolves
Abstract
Several articles describe highly accurate age estimation methods based on human DNA-methylation data. It is not yet known whether similar epigenetic aging clocks can be developed based on blood methylation data from canids. Using Reduced Representation Bisulfite Sequencing, we assessed blood DNA-methylation data from 46 domesticated dogs (Canis familiaris) and 62 wild gray wolves (C. lupus). By regressing chronological dog age on the resulting CpGs, we defined highly accurate multivariate age estimators for dogs (based on 41 CpGs), wolves (67 CpGs), and both combined (115 CpGs). Age related DNA methylation changes in canids implicate similar gene ontology categories as those observed in humans suggesting an evolutionarily conserved mechanism underlying age-related DNA methylation in mammals.
Introduction
Technological breakthroughs surrounding genomic platforms have led to major insights about age related DNA methylation changes in humans [1–9]. In mammals, DNA methylation represents a form of genome modification that regulates gene expression by serving as a maintainable mark whose absence marks promoters and enhancers. During development, germline DNA methylation is erased but is established anew at the time of implantation [10]. Abnormal methylation changes that occur because of aging contribute to the functional decline of adult stem cells [11–13]. Even small changes of the epigenetic landscape can lead to robustly altered expression patterns, either directly by loss of regulatory control or indirectly, via additive effects, ultimately leading to transcriptional changes of the stem cells [14].
Several studies describe highly accurate age estimation methods based on combining the DNA methylation levels of multiple CpG dinucleotide markers [15–18]. We recently developed a multi-tissue epigenetic age estimation method (known as the epigenetic clock) that combines the DNA methylation levels of 353 epigenetic markers known as CpGs [17]. The weighted average of these 353 epigenetic markers gives rise to an estimate of tissue age (in units of years), which is referred to as "DNA methylation age" or as "epigenetic age". DNA methylation age is highly correlated (r=0.96) with chronological age across the entire lifespan [8,19,20]. We and others have shown that the human epigenetic clock relates to biological age (as opposed to simply being a correlate of chronological age), e.g. the DNA methylation age of blood is predictive of all-cause mortality even after adjusting for a variety of known risk factors [21–25]. Epigenetic age acceleration (i.e. the difference between epigenetic and chronological age) is associated with lung cancer [26], cognitive and physical functioning [27], Alzheimer's disease [28], centenarian status [25,29], Down syndrome [30], HIV infection [31], Huntington's disease [32], obesity [33], menopause [34], osteoarthritis [35], and Parkinson's disease [36]. Moreover, we have demonstrated the human epigenetic clock applies without change to chimpanzees [17] but it no longer applies to other animals due to lack of sequence conservation.
Many research questions and preclinical studies of anti-aging interventions will benefit from analogous epigenetic clocks in animals. To this end we sought to develop an accurate epigenetic clock for dogs and wolves. Dogs are increasingly recognized as a valuable model for aging studies [37,38]. Dogs are an attractive model in aging research because their lifespan (around 12 years) is intermediate between that of mice (2 years) and humans (80 years), thus serving as a more realistic model for human aging than most rodents. Dogs have already been adopted to model multiple human diseases in gene mapping studies (e.g. squamous cell carcinoma [39], bladder cancer [40]) and cancers are often the cause of age-related mortality in domestic dogs [41].
The maximum lifespan of dogs is known to correlate with the size of their breed [42–44]. Based on previous studies in human [17], we expect that the age acceleration (difference between epigenetic age and chronological age) correlates with longevity. We hypothesize that dogs whose epigenetic age is larger than their chronological age are aging more quickly, while those with negative value are aging more slowly. Thus, we would expect to see a correlation between age acceleration and dog breed size.
We also sought to build an epigenetic clock for gray wolves because alternative age estimation methods have limitations. Gray wolf age estimates have traditionally been conducted through tooth wear patterns, cranial suture fusions, closure of the pulp cavity, and cementum annuli [45,46]. Based on tooth wear patterns, the age structure of a wolf pack is typically skewed towards younger animals (<1-4 years old), with few individuals >5 years of age [46] [47]. Sexually maturity is reached between 10 months and 2 years of age [48,49]. In a wild social carnivore, group living often results in high mortality rates. Gray wolves live on average 6-8 years in natural populations, but can live up to 13+ years in captivity with increased reproductive success [45,46].
Results
Data set
We used Reduced Representation Bisulfite Sequencing to generate DNA methylation data of 46 domestic dogs (26 females, 20 males) and 62 gray wolves from Yellowstone National Park (26 females, 36 males). The age distribution of wolves is skewed towards younger animals (Dogs: mean=5 years, median=4, range=0.5-14; Wolves: mean=2.7, median=2, range=0.5-8) due to younger mortality rates in natural populations compared to domestic species, and that estimating the age in wild specimens lacks precision. Additionally, we included 729 humans (388 females, 341 males) with a large age range (mean=47.4, range=14-94).
Based on calculations and criteria described in the Methods section, we constructed a matrix of high confidence methylation levels across 108 canid blood samples. Previous work has shown that there are locus-specific significant methylation differences between dogs and wolves [50]. Here, however, we sought to identify a clock that correlated with age across both canid species; thus, we removed the methylation sites that showed species-specific divergence. This yielded a set of 252,240 CpG sites for our modeling efforts. Of these, 105,521 could be mapped to syntenic CpGs in the human genome (hg19) for functional annotation purposes. Further, a subset of 9,017 sites are measured by the human Illumina 405K array, which allowed us to test for conservation of age correlations between these evolutionarily divergent species (humans, dogs, and wolves).
From these input sets of 10s to 100s of thousands of CpGs, regression models were obtained using an algorithm (see Methods) that selects a much smaller number of CpGs by allowing regression coefficients to go to zero. As the space of possible models is combinatorially vast, there is no guarantee of global optimality of the resulting models, and there are likely a large number of models that would yield comparable results. Thus, we make no assertions of biological significance for the exact identity or number of CpGs in a given model used here.
Conservation of age-correlated methylation between dogs and wolves
To initially gauge whether it might be possible to create a DNAm age clock for a multi-species group (i.e. canids), we looked at the conservation of age-correlated methylation in the two canid species. The global correlation between the age effects across the two species is small in magnitude (r=0.07, Fig. 1A) which could be due to the following reasons: i) it could reflect poor accuracy of the chronological age estimate in wolves, ii) it could reflect the relatively small sample size, iii) it could reflect that wolves tended to be younger than dogs in our study, i.e. the chronological age distributions differed.
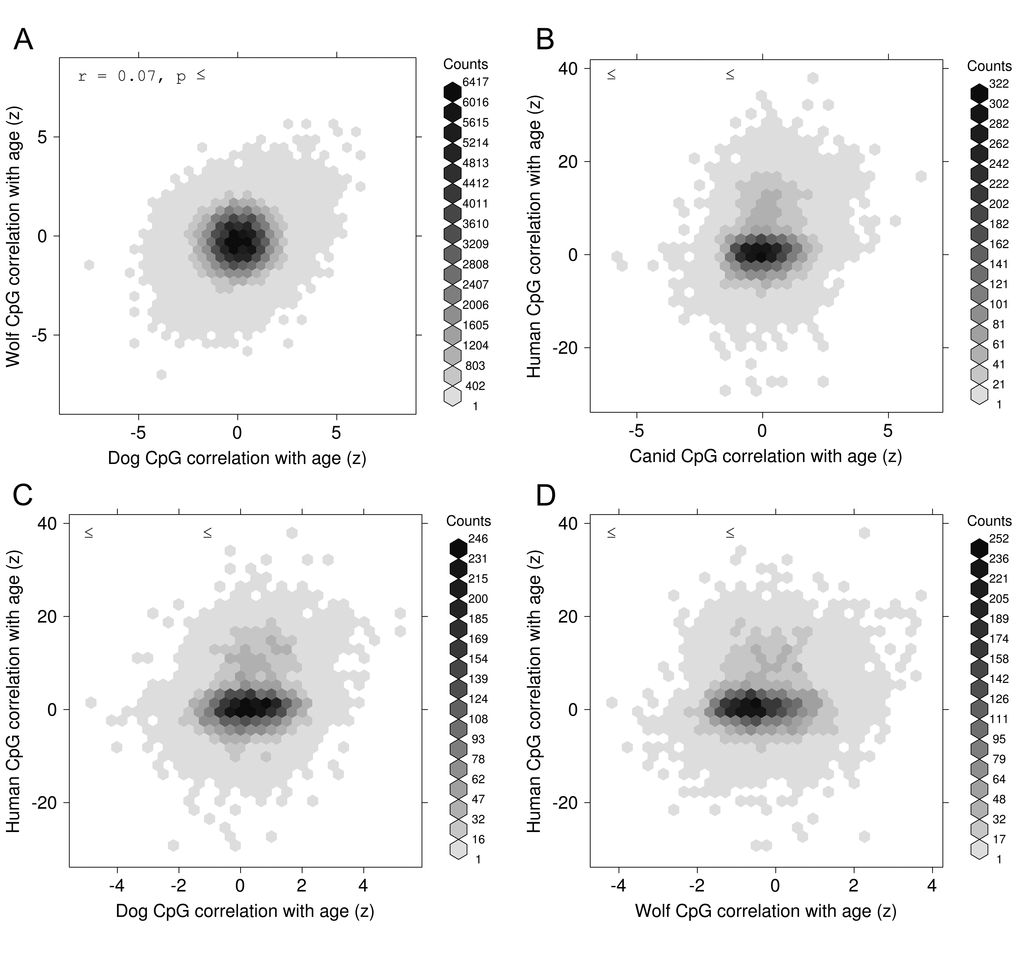
Figure 1. Conservation of epigenetic aging. Normalized correlation (z) between age and DNA methylation for CpG sites in one species versus the same correlation computed at syntenic CpG sites in another species. The species comparisons are shown, as follows: (A) Wolves versus Dogs, (B) Human versus Canid (pooled dogs and wolves), (C) Human versus Dogs, and (D) Human versus Wolves.
Conservation of age-correlated methylation between canid species and human
To test for more distant evolutionary conservation of age effects on DNA methylation between canids and humans, we computed age correlations over a set of 729 human blood methylation array samples [6] and examined syntenic locations between the canine (canFam3) and human (hg19) genomes as described in Methods. While the subset of measured DNA-methylation sites common to all 3 species is relatively small (~9000 CpGs), we see that the conservation of age-correlation between “canids” (pooled samples of dogs and wolves) and human is statistically significant, though small in magnitude (r=0.20, p=1×10-81, Fig. 1B). This conservation holds for dogs alone (r=0.20, p=6×10-85) but is weaker for wolves alone (r=0.11, p=1×10-25, Fig. 1C, 1D).
The high correlation between dogs and humans is remarkable because the two data sets were generated on different platforms (RRBS versus the Illumina 450K array).
Leave one out estimate of the accuracy of the canid epigenetic clock
DNAm age (also referred to as epigenetic age) was calculated for each sample by regressing an elastic net on the methylation profiles of all other samples and predicting the age of the sample of interest. In the course of our work, we found that pre-selecting subsets of CpGs was helpful and computationally expedient. This was done by computing correlations between methylation and age and taking only those with absolute correlation above 0.3. These pre-selection steps were also performed in a leave-one-out manner for all cross-validated results presented here. These predictions (in years) were obtained by taking the exponential of the output of the epigenetic aging model where ages were log-transformed prior to regression. We see a strong linear relationship between DNAm age and true age for our 108 canid samples (Fig. 2A). The correlation between predicted and actual ages using leave-one-out cross-validation was 0.8 and the median absolute error was 0.8 (years). The average number of CpGs in the 108 individual regression models was 122.3.
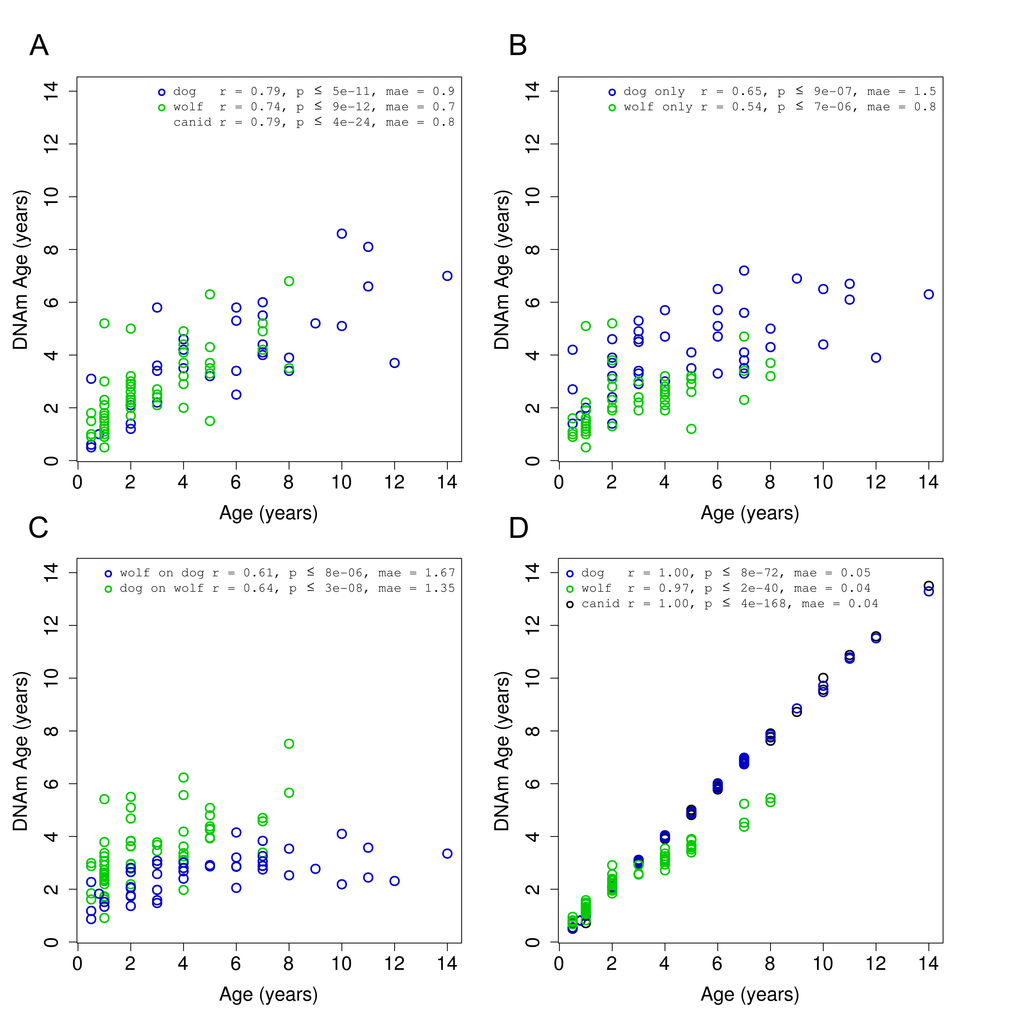
Figure 2. Accuracy of canid age clock. DNA methylation age (y-axis) versus chronological age (x-axis) for all canid samples (green = dog, blue = wolf). (A) Results obtained using a leave-one-out cross validation over all 108 samples. (B) Results obtained in each species separately using a leave-one-out cross validation. (C) Results obtained by regressing on all samples in one species and predicting age on samples from the other species. (D) Final models for each grouping of samples.
To examine the effects of pooling two species of canids, we performed the same prediction (DNAm age calculation) procedure on dogs and wolves, separately. We find that the performance of these models is lower than the canid model, with dogs showing a correlation of r=0.65 and wolves r=0.54 (Fig. 2B). The average number of CpGs in the dog-only and wolf-only models were 58.5 and 62.9, respectively. These models, on average, contain fewer CpGs than the combined canid models as the smaller number of samples in each subset provides less statistical support for the regression algorithm.
As another means of assessing the robustness of a multi-species clock, we built one clock for each species using all samples in that species and then applied it to all samples in the other species. These clocks have similar correlation to the dog only or wolf only clocks, close to 0.6, utilizing a single regression model with 67 and 41 CpGs for the dog and wolf model, respectively (Fig. 2C).
Final epigenetic aging clocks based on all animals
To determine the accuracy of our final models, we regressed the penalized elastic net over the set of dogs (41 CpGs), wolves (67 CpGs), and then both combined (115 CpGs) (Fig. 2D). The penalized regression routine (“elastic net”) utilizes an internal cross-validation to select the optimal penalty parameter. While the entire set of canids, and the subset of domesticated dogs could be fit exactly (r=1.0), the wolf data alone was slightly less amenable.
Age acceleration as a function of dog size
With the largest variation in size among terrestrial vertebrates, the domestic dog not only spends most of its life in an environment and lifestyle like its human companions, but also displays a high similarity of analogues to human disease [51,52]. Though dog breeds are diverse in nearly every aspect, smaller breeds are known to live longer than larger breeds [42–44]. Recent genomic surveys have identified nine loci linked to canine size determination, with seven of these loci supporting growth, cellular proliferation, and metabolism [53]. Of these, the growth hormone IGF1 has not only been of historic interest as a causative locus controlling body size in mice [54–56], but also has the most significant association with body size [57,58].
We found a correlation of 0.25 between age acceleration and breed weight (Fig. 3). Given the limited sample size for dogs (n = 46) we did not reach a significance below the standard threshold of 0.05. However, we expect that a study with a larger cohort might have sufficient power to show that these trends are in fact significant.
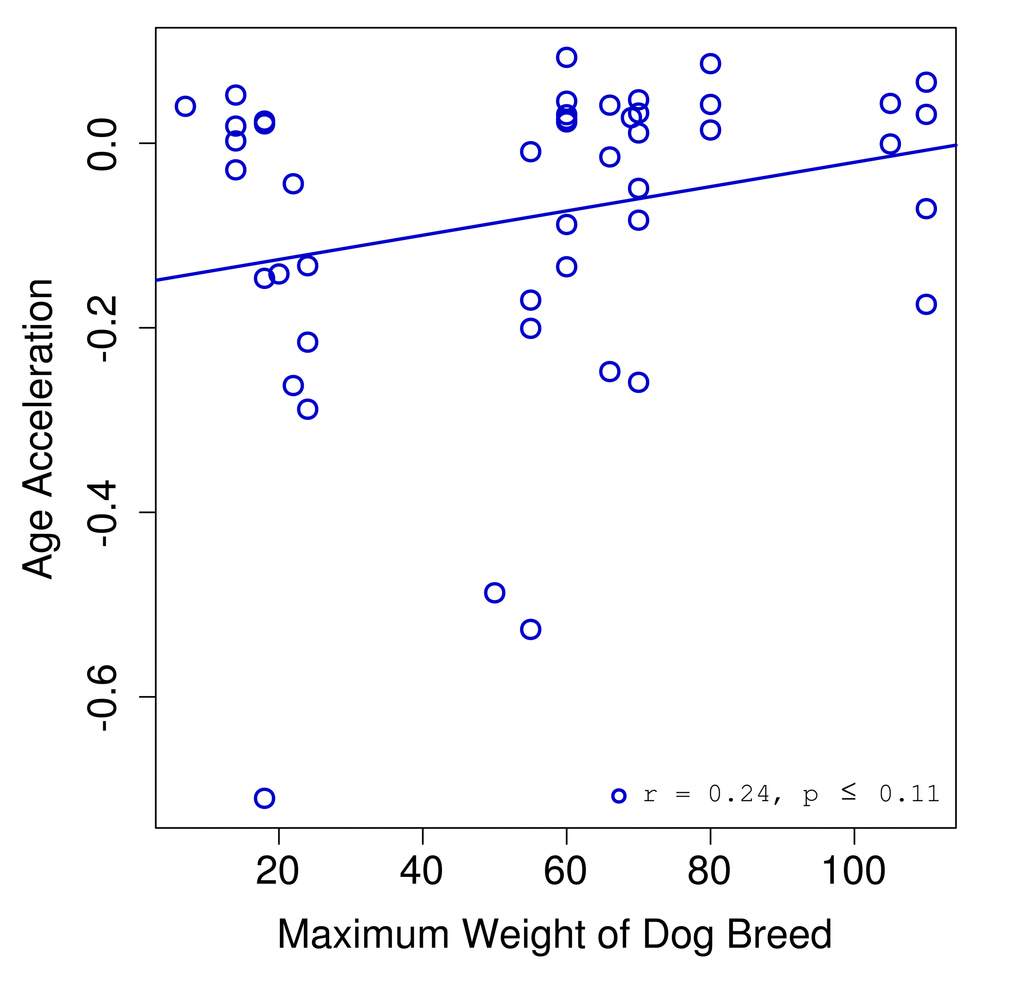
Figure 3. Age acceleration and dog breed. Age acceleration (difference between predicted epigenetic age and actual chronological age) is plotted against the maximum weight for the breed of each dog sample.
Functional significance of DNAm age sites
As described in Methods, mapping of canid CpGs to the human genome yielded 105,521 sites. We utilized this entire set as “background” and selected subsets of CpGs based on the statistical significance of their correlation with age as “foreground”. These subsets are not meant to correspond exactly to any of the particular regression models, but to capture the general association of age-related CpGs (from which the regression models are drawn) and biological function inferred via proximity of the CpGs to known genes.
We also partitioned the CpGs into groups with positive (gain of methylation) or negative (loss of methylation) with age, as these two groups have been noted to correspond to separate classes of biomolecular function in previous work [17,59]. As negatively correlated sites generally partition to distal parts of gene bodies or inter-genic regions, they tend to have limited annotation. Conversely, positively correlated sites localize to promoter regions of genes for which there is generally more detailed annotation. To ensure the selection of statistically significant age-related CpGs, we performed a multiple-testing correction [60] on the p-values and selected only those with adjusted values <= 0.05. The annotation tool (GREAT) accesses a large and diverse number of databases and function ontologies. Here, we report those results edited down to non-redundant highlights. We found that a subset of 91 negatively-correlated CpGs (0.1% of total) localized to 125 genes that function in cellular organization and the Notch pathway, an evolutionarily conserved cell-to-cell signaling pathway important for cell proliferation and differentiation (Table 1A). The subset of 90 positively-correlated CpGs (0.1% of total) localized to 71 genes with vital roles in embryonic organismal development and chromatin states (Table 1B). In summary, the canid genes whose DNA-methylation changes are most strongly correlated to age (both negatively and positively) are critical developmental genes; those that determine cell fate and organ development in the embryonic stage of life, as has been noted in previous work with DNA-methylation in humans [17,59].
Table 1. Functional enrichment studies of age related CpGs in canids.
| Functional Annotation | Hypergeometric FDR Q-Value |
| A. Functional roles of CpGs that lose methylation with age | |
| compartment pattern specification | 2.8x10⁻⁴ |
| proximal tubule development | 4.3x10⁻⁴ |
| carbohydrate derivative transport | 8.8x10⁻⁴ |
| Notch signaling pathway | 1.3x10⁻³ |
| B. Functional roles of CpGs that gain methylation with age | |
| regulation of transcription, DNA-dependent | 1.6x10⁻¹¹ |
| regulation of RNA biosynthetic process | 8.8x10⁻¹² |
| organ development | 1.0x10⁻¹¹ |
| embryonic organ morphogenesis | 1.8x10⁻¹⁰ |
| anatomical structure development | 8.3x10⁻¹⁰ |
| Set 'Suz12 targets': genes identified by ChIP on chip as targets of the Polycomb protein SUZ12 in human embryonic stem cells. | 2.6x10⁻¹⁰ |
| Genes with high-CpG-density promoters (HCP) bearing the H3K27 tri-methylation (H3K27me3) mark in brain. | 6.9x10⁻⁹ |
| Genes with high-CpG-density promoters (HCP) bearing histone H3 trimethylation mark at K27 (H3K27me3) in neural progenitor cells (NPC). | 1.5x10⁻⁸ |
Discussion
More broadly, our study demonstrates that DNA-methylation correlates with age in dogs and wolves as it does in human and related species. This age-dependence of DNA-methylation is conserved at syntenic sites in the respective genomes of these canid species as well for more distantly related mammalian genomes such as human. Strikingly, the age associations of syntenic CpGs is well conserved (r=0.20) even though the data were generated on different platforms (RRBS vs Illumina methylation array). Overall, our study demonstrates that dogs age in a similar fashion to humans when it comes to DNA methylation changes.
Race/ethnicity and sex have a significant effect on the epigenetic age of blood in humans [61]. Further, genetic loci have been found that affect epigenetic aging rates in humans [62]. It will be interesting to determine whether sex effects can also be observed in dogs and whether genetic background relates to the ticking rate of the canid clock. Based on our preliminary blood samples of 108 canid specimens, including both dogs and wolves, we accurately measured the methylation status of several hundred thousand CpGs. We demonstrate that these data can produce highly accurate age estimation methods (epigenetic clocks) for dogs and wolves separately. By first removing sites that were variable between dogs and wolves, we could also establish a highly accurate epigenetic clock for all canids (i.e. dogs and wolves combined). This clock allows us to estimate the age of half the canids to within a year.
Our study has several limitations including the following. First, the sample size was relatively low (n=108). There is no doubt that more accurate clocks could be build based on larger sample sizes. Second, we only focused on blood tissue. Future studies could explore other sources of DNA such as buccal swabs. Third, the chronological ages of the wolves are probably not very accurate since they were estimated by the investigators.
In human studies, we have found that lifestyle factors (e.g. diet) have at best a weak effect on cell-intrinsic epigenetic aging rates measured by the 353 CpG based clock [63]. By contrast, extrinsic measures of epigenetic age acceleration, which also capture age related changes in blood cell composition, relate to lifestyle factors that are known to be protective in humans (e.g. consumption of fish, vegetables, moderate alcohol, and to higher levels of education). Biomarkers of metabolic syndrome were associated with increased DNAm age but we could not detect a protective effect of metformin in this observational study [63]. The presented canid aging clocks open up the possibility of assessing dietary and pharmacological intervention on canid aging. The genome coordinates for the CpGs and corresponding regression coefficients of our final canid age estimator and of our dog age estimator can be found in Table 2 and Table 3, respectively.
Table 2. Multivariate model of canid age.
| Canine coordinate (canFam3) | Coef | Mean meth | Corr(age,meth) | Human coordinate (hg19) | Proximal genes |
| Intercept term | 4.382 | | | | |
| chr1: 815007 | -0.405 | 0.95 | -0.27 | chr18: 77637184 | KCNG2 (+13517), PQLC1 (+74479) |
| chr1: 48720985 | 0.5191 | 0.95 | 0.31 | | |
| chr1: 49472858 | 0.2594 | 0.64 | 0.28 | | |
| chr1: 90590933 | -0.0041 | 0.94 | -0.32 | chr9: 1872401 | Intergenic |
| chr1: 98573761 | -0.0837 | 0.6 | -0.42 | | |
| chr1: 98573781 | -0.1991 | 0.2 | -0.37 | | |
| chr1: 101051499 | -0.2786 | 0.79 | -0.4 | chr19: 57398441 | ZIM2 (-46345) |
| chr1: 108136920 | 0.933 | 0.98 | 0.22 | chr19: 48626542 | PLA2G4C (-12469), LIG1 (+47317) |
| chr1: 117122008 | -0.2091 | 0.82 | -0.33 | chr19: 36035408 | TMEM147 (-1088) |
| chr1: 117495962 | -0.1664 | 0.86 | -0.41 | chr19: 35540744 | FXYD3 (-66421), HPN (+9335) |
| chr1: 121791246 | -0.3188 | 0.67 | -0.38 | chr19: 30153492 | PLEKHF1 (-2470) |
| chr1: 121796139 | 0.3134 | 0.96 | 0.28 | | |
| chr1: 121864927 | 0.3367 | 0.83 | 0.3 | chr19: 30042558 | POP4 (-52365), VSTM2B (+25153) |
| chr2: 10101121 | -0.0266 | 0.65 | -0.29 | | |
| chr2: 30853505 | -0.0048 | 0.93 | -0.28 | chr10: 4714389 | Intergenic |
| chr2: 36347652 | 0.0248 | 0.37 | 0.36 | chr5: 140749805 | PCDHGA6 (-3845), PCDHGB3 (-25) |
| chr2: 71080824 | 0.0288 | 0.86 | 0.33 | chr1: 30051475 | Intergenic |
| chr2: 82210243 | -0.387 | 0.94 | -0.22 | chr1: 15602565 | Intergenic |
| chr2: 84377388 | -0.4829 | 0.97 | -0.36 | chr1: 11951757 | NPPB (-32770), KIAA2013 (+34722) |
| chr2: 84445018 | 0.0924 | 0.26 | 0.33 | chr1: 11864680 | CLCN6 (-1587), MTHFR (-1379) |
| chr3: 1128258 | -0.0993 | 0.94 | -0.37 | | |
| chr3: 51442070 | -0.0641 | 0.8 | -0.3 | chr15: 88733456 | NTRK3d (+66204) |
| chr3: 60468935 | -0.2449 | 0.82 | -0.43 | chr4: 8834358 | HMX1 (+39184) |
| chr3: 62880832 | 0.4931 | 0.88 | 0.25 | chr4: 17638199 | MED28 (+21946) |
| chr3: 84450199 | -0.0696 | 0.89 | -0.49 | chr4: 25978965 | SMIM20 (+63140) |
| chr4: 28034141 | -0.6356 | 0.14 | -0.33 | chr10: 79971431 | Intergenic |
| chr4: 28162022 | -0.1129 | 0.89 | -0.32 | chr10: 80116134 | Intergenic |
| chr4: 28489863 | 0.0289 | 0.7 | 0.24 | chr10: 80479452 | Intergenic |
| chr4: 79153238 | 0.1058 | 0.09 | 0.42 | chr5: 27038840 | CDH9 (-148) |
| chr5: 4750111 | -0.089 | 0.35 | -0.5 | chr11: 129969307 | ST14 (-60149), APLP2 (+29507) |
| chr5: 13918996 | -0.3157 | 0.27 | -0.34 | chr11: 119933419 | TRIM29 (+75741) |
| chr5: 19204758 | -0.4101 | 0.33 | -0.57 | chr11: 114000061 | ZBTB16a,b,c,d (+69747) |
| chr5: 19204778 | -0.0691 | 0.25 | -0.37 | chr11: 114000041 | ZBTB16a,b,c,d (+69727) |
| chr5: 32474202 | -0.0084 | 0.09 | -0.31 | chr17: 7453106 | TNFSF12 (+636), TNFSF12-TNFSF13 (+691) |
| chr5: 32946701 | 0.0874 | 0.62 | 0.61 | chr17: 8027247 | ALOXE3b,d (-4883), HES7a,b,c,d (+154) |
| chr5: 32947926 | 0.172 | 0.71 | 0.6 | chr17: 8028384 | HES7a,b,c,d (-983) |
| chr5: 48883359 | 0.3308 | 0.5 | 0.53 | chr1: 61517619 | NFIAb,d (-29914) |
| chr5: 57976813 | -0.1742 | 0.8 | -0.35 | chr1: 3310290 | ARHGEF16 (-60699) |
| chr6: 24353251 | -0.3036 | 0.94 | -0.31 | | |
| chr7: 752676 | -0.5779 | 0.9 | -0.4 | chr1: 202263534 | UBE2T (+47573) |
| chr7: 3691174 | -0.0377 | 0.87 | -0.39 | chr1: 199252083 | Intergenic |
| chr7: 16651501 | -0.2448 | 0.9 | -0.46 | chr1: 183251643 | LAMC2 (+96221) |
| chr7: 43318848 | -0.3665 | 0.46 | -0.27 | chr1: 153754738 | SLC27A3 (+6971) |
| chr7: 79793670 | -0.0914 | 0.72 | -0.31 | chr18: 46369695 | Intergenic |
| chr8: 49880796 | -0.0078 | 0.62 | -0.25 | chr14: 77512098 | IRF2BPL (-17065), ZDHHC22 (+96035) |
| chr8: 62064006 | -0.1501 | 0.37 | -0.49 | chr14: 91654259 | GPR68 (+66009), C14orf159 (+73546) |
| chr8: 68929216 | -0.0404 | 0.91 | -0.36 | chr14: 101158024 | DLK1a,b (-35139) |
| chr9: 2907494 | -0.2042 | 0.89 | -0.41 | | |
| chr9: 20510949 | -0.2444 | 0.2 | -0.46 | chr17: 40575423 | PTRF (+111) |
| chr9: 24869027 | 0.0726 | 0.68 | 0.53 | chr17: 46683610 | HOXB6a,b,c,d (-1257) |
| chr9: 46993125 | 0.8863 | 0.95 | 0.38 | | |
| chr9: 58841193 | 0.0605 | 0.33 | 0.43 | chr9: 126779234 | LHX2a,b,c,d (+5346) |
| chr10: 1318284 | -0.5572 | 0.88 | -0.31 | chr12: 57582542 | NXPH4a,b (-28035), LRP1 (+60261) |
| chr10: 47398772 | 0.1821 | 0.25 | 0.3 | chr2: 45231989 | SIX2a,b,c,d (+4579), SIX3a,b,c,d (+63088) |
| chr10: 55453590 | -0.3219 | 0.95 | -0.52 | chr2: 54776879 | SPTBN1 (+93458) |
| chr10: 69070602 | -0.0518 | 0.91 | -0.41 | chr2: 70910505 | ADD2 (+84803) |
| chr11: 54591790 | -0.1652 | 0.78 | -0.35 | chr9: 38412041 | IGFBPL1 (+12402), ALDH1B1 (+19381) |
| chr11: 56812470 | 0.2722 | 0.84 | 0.49 | chr9: 102590004 | NR4A3a,b,c,d (+996) |
| chr12: 6649423 | -0.0003 | 0.87 | -0.36 | chr6: 37591955 | MDGA1a (+73810) |
| chr13: 30162882 | -0.1239 | 0.92 | -0.33 | chr8: 134871127 | Intergenic |
| chr13: 44072687 | -0.095 | 0.81 | -0.31 | chr4: 48239824 | TEC (+32056) |
| chr14: 13905355 | 0.1845 | 0.45 | 0.38 | | |
| chr14: 41413362 | -0.2829 | 0.57 | -0.33 | chr7: 28355716 | CREB5 (-96427) |
| chr14: 59995975 | -0.0142 | 0.73 | -0.34 | chr7: 121776852 | AASS (-2977) |
| chr15: 17780647 | 1.3988 | 0.97 | 0.29 | chr14: 20915434 | TEP1 (-33855), OSGEP (+7829) |
| chr15: 17785631 | -0.3897 | 0.94 | -0.43 | chr14: 20921454 | APEX1 (-1899), OSGEP (+1809) |
| chr16: 131577 | -0.0629 | 0.73 | -0.31 | | |
| chr16: 247019 | 0.8011 | 0.83 | 0.34 | | |
| chr17: 18033866 | 0.2802 | 0.82 | 0.32 | chr2: 23704553 | Intergenic |
| chr18: 1791242 | -0.0118 | 0.94 | -0.35 | chr7: 50515762 | FIGNL1 (+1659) |
| chr18: 25850449 | -0.2607 | 0.92 | -0.34 | | |
| chr18: 33813035 | -0.1549 | 0.78 | -0.41 | chr11: 33962891 | LMO2 (-49056) |
| chr18: 43740411 | -0.1646 | 0.94 | -0.34 | chr11: 45669463 | CHST1 (+17708) |
| chr18: 48905778 | 0.0765 | 0.72 | 0.41 | chr11: 68925723 | Intergenic |
| chr18: 49633631 | -0.0336 | 0.49 | -0.22 | chr11: 67984189 | SUV420H1 (-3308) |
| chr18: 53920336 | -0.0957 | 0.8 | -0.4 | | |
| chr20: 44455198 | 0.3338 | 0.72 | 0.46 | | |
| chr20: 49366316 | -0.0004 | 0.71 | -0.28 | chr19: 12895268 | HOOK2 (-8932), JUNB (-7041) |
| chr21: 23088752 | -0.4109 | 0.88 | -0.28 | chr11: 75219103 | GDPD5 (+17844) |
| chr21: 47917499 | -0.0235 | 0.84 | -0.29 | chr11: 27349807 | Intergenic |
| chr22: 56299850 | -0.2509 | 0.89 | -0.32 | chr13: 108022629 | Intergenic |
| chr23: 24782165 | -0.1049 | 0.89 | -0.33 | chr3: 18277027 | Intergenic |
| chr23: 24782179 | -0.658 | 0.94 | -0.31 | chr3: 18277013 | Intergenic |
| chr24: 42551119 | -0.2892 | 0.93 | -0.35 | chr20: 56148739 | PCK1 (+12604), ZBP1 (+46789) |
| chr24: 45589901 | 0.2135 | 0.97 | 0.27 | chr20: 59877087 | CDH4b (+49606) |
| chr26: 220859 | 0.0037 | 0.98 | 0.27 | | |
| chr26: 5991914 | -0.2154 | 0.93 | -0.37 | chr12: 124138408 | TCTN2 (-17251), GTF2H3 (+20033) |
| chr26: 11457252 | -0.3679 | 0.94 | -0.28 | chr12: 114784708 | TBX5a,b,c,d (+61538) |
| chr26: 37645878 | -0.4125 | 0.93 | -0.3 | | |
| chr27: 1189935 | -0.0497 | 0.78 | -0.39 | chr12: 54471815 | HOXC4a,b,c,d (+24155) |
| chr27: 2886690 | -0.0004 | 0.86 | -0.44 | chr12: 52559286 | KRT80 (+26497), C12orf44 (+95532) |
| chr27: 45394279 | -0.4689 | 0.93 | -0.45 | | |
| chr28: 23823079 | -0.2956 | 0.91 | -0.31 | | |
| chr28: 40564054 | -0.0603 | 0.96 | -0.33 | chr10: 134593678 | NKX6-2a,b,c,d (+5877) |
| chr30: 15275091 | -0.0557 | 0.89 | -0.31 | | |
| chr30: 27934524 | -0.0484 | 0.93 | -0.26 | chr15: 63648005 | CA12 (+26354), APH1B (+78253) |
| chr30: 38620897 | 0.8567 | 0.94 | 0.33 | chr15: 78043186 | Intergenic |
| chr31: 27720671 | 0.0332 | 0.16 | 0.46 | chr21: 34444104 | OLIG1a,d (+1655) |
| chr31: 36955453 | -0.5267 | 0.91 | -0.36 | chr21: 44079991 | PDE9A (+6127) |
| chr31: 37492782 | -0.4942 | 0.49 | -0.56 | | |
| chr32: 1431916 | -0.2835 | 0.07 | -0.3 | chr4: 77752402 | Intergenic |
| chr32: 38110814 | -0.076 | 0.87 | -0.35 | | |
| chr33: 22992599 | -0.0003 | 0.93 | -0.34 | chr3: 119042586 | ARHGAP31 (+29367) |
| chr33: 25783582 | 0.3819 | 0.98 | 0.34 | chr3: 122422615 | PARP14 (+23151), HSPBAP1 (+90055) |
| chr33: 31142995 | -0.8311 | 0.95 | -0.3 | chr3: 194291430 | ATP13A3 (-72338), TMEM44 (+62719) |
| chr34: 40858941 | -0.1582 | 0.93 | -0.38 | chr3: 177096996 | Intergenic |
| chr35: 2307155 | -0.1171 | 0.94 | -0.32 | chr6: 1886203 | Intergenic |
| chr36: 2545193 | 0.2403 | 0.84 | 0.47 | chr2: 157179898 | NR4A2 (+9329) |
| chr36: 19969591 | 0.0515 | 0.27 | 0.38 | chr2: 177025691 | HOXD1a,b,c,d (-27615), HOXD4a,b,c,d (+9742) |
| chr37: 6301 | -0.1058 | 0.69 | -0.43 | | |
| chr37: 25454687 | 0.4555 | 0.32 | 0.33 | chr2: 219736500 | WNT10Aa,b,c,d (-8584), WNT6a,b,c,d (+11957) |
| chr38: 16230281 | 0.1055 | 0.92 | 0.23 | chr1: 221912099 | DUSP10 (+3418) |
| chr38: 22365525 | -0.1451 | 0.89 | -0.36 | chr1: 159724037 | CRP (-39659), DUSP23 (-26755) |
| chr38: 22792877 | 0.7599 | 0.72 | 0.43 | chr1: 159145579 | DARC (-29621), CADM3d (+4181) |
| chrX: 80013740 | -0.133 | 0.85 | -0.29 | | |
| Genome coordinates and coefficient values for predicting a log (base e) transformed version of chronological age. These coefficients were found by regressing a log-transformed version of age on the RRBS DNA-methylation measured from 108 canid blood samples. Since chronological age was log-transformed prior to regression, it is important to exponentiate the age estimate from this model to arrive at age estimates in units of years. We provide the mean methylation and Pearson correlation with age for each individual CpG. Where possible, we identify, via synteny to the human genome, genes that are proximal to the CpGs in our models. Numbers in parentheses are the distance in bases to the Transcription Start Site of the gene. Additionally, we note those genes with experimentally inferred relevance to cellular identity (pluripotency). |
| Genes experimentally identified as targets of pluripotency factors and the Polycomb repressor complex [69,70] |
| a genes identified by ChIP on chip as targets of the Polycomb protein EED in human embryonic stem cells. |
| b genes possessing the trimethylated H3K27 (H3K27me3) mark in their promoters in human embryonic stem cells, as identified by ChIP on chip |
| c Polycomb Repression Complex 2 (PRC) targets; identified by ChIP on chip on human embryonic stem cells as genes that: possess the trimethylated H3K27 mark in their promoters and are bound by SUZ12 and EED Polycomb proteins |
| d genes identified by ChIP on chip as targets of the Polycomb protein SUZ12 in human embryonic stem cells |
Table 3. Multivariate model of domesticated dog age.
| Canine coordinate (canFam3) | Coef | Mean Meth | Corr(age,meth) | Human coordinate (hg19) | proximal genes |
| (Intercept) | -6.9009 | | | | |
| chr1: 23851533 | -0.1843 | 0.95 | -0.47 | chr7: 158164956 | Intergenic |
| chr1: 98804509 | -0.1771 | 0.92 | -0.56 | chr9: 95371248 | ECM2 (-72912), IPPK (+61298) |
| chr2: 34467253 | -0.1762 | 0.96 | -0.52 | chr10: 323319 | Intergenic |
| chr2: 50165769 | 1.8403 | 0.97 | 0.56 | chr5: 63460330 | RNF180 (-1378) |
| chr3: 54128482 | 0.1444 | 0.77 | 0.51 | chr15: 85429683 | PDE8Aa,b (-93987), SLC28A1 (+1771) |
| chr4: 28320267 | -0.4038 | 0.94 | -0.43 | chr10: 80292869 | Intergenic |
| chr5: 19204758 | -0.5393 | 0.31 | -0.62 | chr11: 114000061 | ZBTB16a,b,c,d (+69747) |
| chr5: 32946701 | 0.1414 | 0.63 | 0.67 | chr17: 8027247 | ALOXE3b,d (-4883), HES7a,b,c,d (+154) |
| chr5: 57889544 | 0.1104 | 0.88 | 0.45 | chr1: 3202081 | Intergenic |
| chr6: 31347568 | -0.0245 | 0.64 | -0.5 | chr16: 11536754 | ENSG00000188897 (+80689), RMI2 (+97467) |
| chr6: 77030251 | 0.5807 | 0.82 | 0.6 | chr1: 68732333 | WLSa,d (-34106) |
| chr7: 54060517 | 0.3047 | 0.06 | 0.48 | chr18: 33708261 | ELP2 (-1599), SLC39A6 (+1019) |
| chr8: 50434546 | 0.0351 | 0.91 | 0.42 | chr14: 78126349 | SPTLC2 (-43234), ALKBH1 (+48013) |
| chr9: 58841067 | 0.318 | 0.15 | 0.61 | chr9: 126779366 | LHX2a,b,c,d (+5478) |
| chr10: 21355951 | 0.3876 | 0.86 | 0.52 | | |
| chr10: 55453590 | -0.4182 | 0.95 | -0.75 | chr2: 54776879 | SPTBN1 (+93458) |
| chr10: 56694481 | 0.4854 | 0.09 | 0.46 | chr2: 56151248 | EFEMP1 (+25) |
| chr10: 62832468 | 0.2077 | 0.77 | 0.6 | chr2: 63279783 | OTX1a,b,c,d (+1847) |
| chr10: 62832512 | 0.2347 | 0.58 | 0.67 | chr2: 63279827 | OTX1a,b,c,d (+1891) |
| chr11: 4422863 | 0.7296 | 0.91 | 0.44 | chr5: 113831979 | Intergenic |
| chr11: 56812470 | 0.0579 | 0.87 | 0.47 | chr9: 102590004 | NR4A3a,b,c,d (+996) |
| chr11: 68812130 | 1.204 | 0.95 | 0.5 | chr9: 117441733 | C9orf91 (+68248) |
| chr12: 67228192 | 1.4284 | 0.98 | 0.39 | chr6: 110931985 | Intergenic |
| chr12: 67482078 | -0.2241 | 0.19 | -0.53 | chr6: 111267687 | GTF3C6 (-12075), AMD1 (+71715) |
| chr12: 67482081 | -0.0314 | 0.26 | -0.48 | chr6: 111267690 | GTF3C6 (-12072), AMD1 (+71718) |
| chr12: 71716109 | 0.0065 | 0.82 | 0.34 | | |
| chr14: 8324605 | 0.3087 | 0.65 | 0.59 | chr7: 127670876 | LRRC4 (+246) |
| chr14: 34373167 | 0.2091 | 0.76 | 0.64 | chr7: 20371740 | ITGB8 (+995) |
| chr18: 36757482 | -0.403 | 0.83 | -0.63 | chr11: 30565405 | MPPED2 (+36637) |
| chr19: 22964392 | -0.0157 | 0.89 | -0.54 | chr2: 128408298 | GPR17 (+4860), LIMS2 (+13821) |
| chr20: 43010636 | 0.4045 | 0.97 | 0.5 | | |
| chr20: 44455198 | 0.0664 | 0.72 | 0.47 | | |
| chr20: 56821233 | 1.2199 | 0.98 | 0.42 | chr19: 2210771 | SF3A2a (-25748), DOT1L (+46624) |
| chr22: 49950553 | 0.1423 | 0.54 | 0.63 | chr13: 100636088 | ZIC2a (+2063) |
| chr24: 37978456 | -0.0979 | 0.77 | -0.59 | | |
| chr28: 39644410 | 0.0856 | 0.84 | 0.37 | | |
| chr30: 38620897 | 1.4441 | 0.94 | 0.51 | chr15: 78043186 | Intergenic |
| chr31: 37492782 | -0.0028 | 0.47 | -0.51 | | |
| chr33: 23073877 | -0.0296 | 0.96 | -0.52 | chr3: 119134135 | TMEM39A (+48393) |
| chr34: 40999085 | -0.1395 | 0.97 | -0.46 | chr3: 177284378 | Intergenic |
| chr36: 2545142 | 0.432 | 0.5 | 0.62 | chr2: 157179848 | NR4A2 (+9379) |
| Genome coordinates and coefficient values for predicting a log (base e) transformed version of chronological age. These coefficients were found by regressing a log-transformed version of age on the RRBS DNA-methylation measured from 46 domesticated dog blood samples. Since chronological age was log-transformed prior to regression, it is important to exponentiate the age estimate from this model to arrive at age estimates in units of years. We provide the mean methylation and Pearson correlation with age for each individual CpG. Where possible we identify, via synteny to the human genome, genes that are proximal to the CpGs in our models. Numbers in parentheses are the distance in bases to the Transcription Start Site of the gene. Additionally, we note those genes with experimentally inferred relevance to cellular identity (pluripotency). |
| Genes experimentally identified as targets of pluripotency factors and the Polycomb repressor complex [69,70] |
| a genes identified by ChIP on chip as targets of the Polycomb protein EED in human embryonic stem cells. |
| b genes possessing the trimethylated H3K27 (H3K27me3) mark in their promoters in human embryonic stem cells, as identified by ChIP on chip |
| c Polycomb Repression Complex 2 (PRC) targets; identified by ChIP on chip on human embryonic stem cells as genes that: possess the trimethylated H3K27 mark in their promoters and are bound by SUZ12 and EED Polycomb proteins |
| d genes identified by ChIP on chip as targets of the Polycomb protein SUZ12 in human embryonic stem cells |
Methods
Reduced representation bisulfite sequencing (RRBS)
We obtained previously published canine RRBS methylation data as CGmap files (see Janowitz, Koch, et al. 2016) [50]. Both wolf and dog data were aligned to the canine genome (canFam3).
Data processing
For each CpG site in each sample we estimated the methylation frequency as the number of methylated mapped read counts over the total mapped read counts and computed a corresponding 95% confidence interval from the binomial distribution [64]. For inclusion in our analysis, we required that each CpG site had confident methylation frequencies in at least 95% of samples. Confidence was defined as having a confidence interval smaller than 0.63 (roughly equivalent to requiring a minimum of 15 mapped reads at that site). For the remaining elements in the data matrix, we used the frequencies calculated regardless of confidence or imputed missing values using R package “softImpute” with type option “ALS” [65].
Culling species-specific differential methylation
To exclude species-specific differential methylation as a confounder, we first constructed a methylation matrix with no dog samples with ages greater than the maximum observed wolf age (8 years). For each CpG we then computed a t-test of the dog methylation values versus the wolf methylation values and excluded those with t >= 2 from use in regression modelling.
Computing age correlations for DNA methylation
When comparing age-correlations computed in datasets of different sizes, we use a z-score instead of the Pearson correlation coefficient. A Student t-test statistic for testing whether a Pearson correlation ( ) is different from zero is given by

where ms denotes the number of observations (i.e. samples) in the s-th data set.
Regression
Penalized regression models were built using glmnet [66]. Given that we would like to see a reduction in the number of predictors from potentially hundreds of thousands of CpGs as input, we utilized the “elastic net” version of glmnet corresponding to an alpha parameter of 0.5. For all results reported here, the internally cross-validated (cv.glmnet) was utilized to automatically select the optimal penalty parameter.
Functional Annotation and multi-species synteny
Canid methylation sites (using coordinates from the CanFam3 draft genome) were first mapped to the human genome (hg19) where possible so that functional analysis tools with access to the most complete and detailed annotations could be utilized. This mapping was made using the "liftOver" tool and associated human to canine chain files available at the UCSC Genome Browser [67]. The human genome coordinates were then used as input to the Genomic Regions Enrichment of Annotations Tool (GREAT) [68].
Conflicts of Interest
The Regents of the University of California is the owner of a provisional patent application directed at this invention for which the authors are named inventors.
Funding
SH, MP, and MT were supported by 1R21AG049400 – 01A1. SH was funded by NIH/NIA U34AG051425-01. MJT acknowledges support from a QCB Collaboratory Postdoctoral Fellowship, and the QCB Collaboratory community directed by Matteo Pellegrini. BvH acknowledges support from National Science Foundation (Grant Numbers: DEB-0613730, DEB-1245373, DMS-1264153), Yellowstone National Park, the Yellowstone Park Foundation, the Intramural Program of the National Human Genome Research Institute, AKC OAK (Grant Number: 1822), and the NIH (Grant Numbers: T32 HG002536, GM053275).
References
-
1.
Rakyan VK, Down TA, Maslau S, Andrew T, Yang TP, Beyan H, Whittaker P, McCann OT, Finer S, Valdes AM, Leslie RD, Deloukas P, Spector TD. Human aging-associated DNA hypermethylation occurs preferentially at bivalent chromatin domains. Genome Res. 2010; 20:434–39. https://doi.org/10.1101/gr.103101.109 [PubMed]
-
2.
Teschendorff AE, Menon U, Gentry-Maharaj A, Ramus SJ, Weisenberger DJ, Shen H, Campan M, Noushmehr H, Bell CG, Maxwell AP, Savage DA, Mueller-Holzner E, Marth C, et al. Age-dependent DNA methylation of genes that are suppressed in stem cells is a hallmark of cancer. Genome Res. 2010; 20:440–46. https://doi.org/10.1101/gr.103606.109 [PubMed]
-
3.
Horvath S, Zhang Y, Langfelder P, Kahn RS, Boks MP, van Eijk K, van den Berg LH, Ophoff RA. Aging effects on DNA methylation modules in human brain and blood tissue. Genome Biol. 2012; 13:R97. https://doi.org/10.1186/gb-2012-13-10-r97 [PubMed]
-
4.
Numata S, Ye T, Hyde TM, Guitart-Navarro X, Tao R, Wininger M, Colantuoni C, Weinberger DR, Kleinman JE, Lipska BK. DNA methylation signatures in development and aging of the human prefrontal cortex. Am J Hum Genet. 2012; 90:260–72. https://doi.org/10.1016/j.ajhg.2011.12.020 [PubMed]
-
5.
Alisch RS, Barwick BG, Chopra P, Myrick LK, Satten GA, Conneely KN, Warren ST. Age-associated DNA methylation in pediatric populations. Genome Res. 2012; 22:623–32. https://doi.org/10.1101/gr.125187.111 [PubMed]
-
6.
Johansson A, Enroth S, Gyllensten U. Continuous Aging of the Human DNA Methylome Throughout the Human Lifespan. PLoS One. 2013; 8:e67378. https://doi.org/10.1371/journal.pone.0067378 [PubMed]
-
7.
Teschendorff AE, West J, Beck S. Age-associated epigenetic drift: implications, and a case of epigenetic thrift? Hum Mol Genet. 2013; 22:R7–15. https://doi.org/10.1093/hmg/ddt375 [PubMed]
-
8.
Jung M, Pfeifer GP. Aging and DNA methylation. BMC Biol. 2015; 13:7. https://doi.org/10.1186/s12915-015-0118-4 [PubMed]
-
9.
Zheng SC, Widschwendter M, Teschendorff AE. Epigenetic drift, epigenetic clocks and cancer risk. Epigenomics. 2016; 8:705–19. https://doi.org/10.2217/epi-2015-0017 [PubMed]
-
10.
Cedar H, Bergman Y. Programming of DNA methylation patterns. Annu Rev Biochem. 2012; 81:97–117. https://doi.org/10.1146/annurev-biochem-052610-091920 [PubMed]
-
11.
Przybilla J, Galle J, Rohlf T. Is adult stem cell aging driven by conflicting modes of chromatin remodeling? BioEssays. 2012; 34:841–48. https://doi.org/10.1002/bies.201100190 [PubMed]
-
12.
Przybilla J, Rohlf T, Loeffler M, Galle J. Understanding epigenetic changes in aging stem cells--a computational model approach. Aging Cell. 2014; 13:320–28. https://doi.org/10.1111/acel.12177 [PubMed]
-
13.
Beerman I, Bock C, Garrison BS, Smith ZD, Gu H, Meissner A, Rossi DJ. Proliferation-dependent alterations of the DNA methylation landscape underlie hematopoietic stem cell aging. Cell Stem Cell. 2013; 12:413–25. https://doi.org/10.1016/j.stem.2013.01.017 [PubMed]
-
14.
Beerman I, Rossi DJ. Epigenetic regulation of hematopoietic stem cell aging. Exp Cell Res. 2014; 329:192–99. https://doi.org/10.1016/j.yexcr.2014.09.013 [PubMed]
-
15.
Bocklandt S, Lin W, Sehl ME, Sánchez FJ, Sinsheimer JS, Horvath S, Vilain E. Epigenetic predictor of age. PLoS One. 2011; 6:e14821. https://doi.org/10.1371/journal.pone.0014821 [PubMed]
-
16.
Hannum G, Guinney J, Zhao L, Zhang L, Hughes G, Sadda S, Klotzle B, Bibikova M, Fan JB, Gao Y, Deconde R, Chen M, Rajapakse I, et al. Genome-wide methylation profiles reveal quantitative views of human aging rates. Mol Cell. 2013; 49:359–67. https://doi.org/10.1016/j.molcel.2012.10.016 [PubMed]
-
17.
Horvath S. DNA methylation age of human tissues and cell types. Genome Biol. 2013; 14:R115. https://doi.org/10.1186/gb-2013-14-10-r115 [PubMed]
-
18.
Lin Q, Weidner CI, Costa IG, Marioni RE, Ferreira MR, Deary IJ, Wagner W. DNA methylation levels at individual age-associated CpG sites can be indicative for life expectancy. Aging (Albany NY). 2016; 8:394–401. https://doi.org/10.18632/aging.100908 [PubMed]
-
19.
Gibbs WW. Biomarkers and ageing: the clock-watcher. Nature. 2014; 508:168–70. https://doi.org/10.1038/508168a [PubMed]
-
20.
Benayoun BA, Pollina EA, Brunet A. Epigenetic regulation of ageing: linking environmental inputs to genomic stability. Nat Rev Mol Cell Biol. 2015; 16:593–610. https://doi.org/10.1038/nrm4048 [PubMed]
-
21.
Marioni RE, Shah S, McRae AF, Chen BH, Colicino E, Harris SE, Gibson J, Henders AK, Redmond P, Cox SR, Pattie A, Corley J, Murphy L, et al. DNA methylation age of blood predicts all-cause mortality in later life. Genome Biol. 2015; 16:25. https://doi.org/10.1186/s13059-015-0584-6 [PubMed]
-
22.
Christiansen L, Lenart A, Tan Q, Vaupel JW, Aviv A, McGue M, Christensen K. DNA methylation age is associated with mortality in a longitudinal Danish twin study. Aging Cell. 2015. [PubMed]
-
23.
Perna L, Zhang Y, Mons U, Holleczek B, Saum KU, Brenner H. Epigenetic age acceleration predicts cancer, cardiovascular, and all-cause mortality in a German case cohort. Clin Epigenetics. 2016; 8:64. https://doi.org/10.1186/s13148-016-0228-z [PubMed]
-
24.
Chen BH, Marioni RE, Colicino E, Peters MJ, Ward-Caviness CK, Tsai PC, Roetker NS, Just AC, Demerath EW, Guan W, Bressler J, Fornage M, Studenski S, et al. DNA methylation-based measures of biological age: meta-analysis predicting time to death. Aging (Albany NY). 2016; 8:1844–65. https://doi.org/10.18632/aging.101020 [PubMed]
-
25.
Horvath S, Pirazzini C, Bacalini MG, Gentilini D, Di Blasio AM, Delledonne M, Mari D, Arosio B, Monti D, Passarino G, De Rango F, D’Aquila P, Giuliani C, et al. Decreased epigenetic age of PBMCs from Italian semi-supercentenarians and their offspring. Aging (Albany NY). 2015; 7:1159–70. https://doi.org/10.18632/aging.100861 [PubMed]
-
26.
Levine ME, Hosgood HD, Chen B, Absher D, Assimes T, Horvath S. DNA methylation age of blood predicts future onset of lung cancer in the women’s health initiative. Aging (Albany NY). 2015; 7:690–700. https://doi.org/10.18632/aging.100809 [PubMed]
-
27.
Marioni RE, Shah S, McRae AF, Ritchie SJ, Muniz-Terrera G, Harris SE, Gibson J, Redmond P, Cox SR, Pattie A, Corley J, Taylor A, Murphy L, et al. The epigenetic clock is correlated with physical and cognitive fitness in the Lothian Birth Cohort 1936. Int J Epidemiol. 2015; 44:1388–96. https://doi.org/10.1093/ije/dyu277 [PubMed]
-
28.
Levine ME, Lu AT, Bennett DA, Horvath S. Epigenetic age of the pre-frontal cortex is associated with neuritic plaques, amyloid load, and Alzheimer’s disease related cognitive functioning. Aging (Albany NY). 2015; 7:1198–211. https://doi.org/10.18632/aging.100864 [PubMed]
-
29.
Horvath S, Mah V, Lu AT, Woo JS, Choi OW, Jasinska AJ, Riancho JA, Tung S, Coles NS, Braun J, Vinters HV, Coles LS. The cerebellum ages slowly according to the epigenetic clock. Aging (Albany NY). 2015; 7:294–306. https://doi.org/10.18632/aging.100742 [PubMed]
-
30.
Horvath S, Garagnani P, Bacalini MG, Pirazzini C, Salvioli S, Gentilini D, Di Blasio AM, Giuliani C, Tung S, Vinters HV, Franceschi C. Accelerated epigenetic aging in Down syndrome. Aging Cell. 2015; 14:491–95. https://doi.org/10.1111/acel.12325 [PubMed]
-
31.
Horvath S, Levine AJ. HIV-1 infection accelerates age according to the epigenetic clock. J Infect Dis. 2015; 212:1563–73. https://doi.org/10.1093/infdis/jiv277 [PubMed]
-
32.
Horvath S, Langfelder P, Kwak S, Aaronson J, Rosinski J, Vogt TF, Eszes M, Faull RL, Curtis MA, Waldvogel HJ, Choi OW, Tung S, Vinters HV, et al. Huntington’s disease accelerates epigenetic aging of human brain and disrupts DNA methylation levels. Aging (Albany NY). 2016; 8:1485–512. https://doi.org/10.18632/aging.101005 [PubMed]
-
33.
Horvath S, Erhart W, Brosch M, Ammerpohl O, von Schönfels W, Ahrens M, Heits N, Bell JT, Tsai PC, Spector TD, Deloukas P, Siebert R, Sipos B, et al. Obesity accelerates epigenetic aging of human liver. Proc Natl Acad Sci USA. 2014; 111:15538–43. https://doi.org/10.1073/pnas.1412759111 [PubMed]
-
34.
Levine ME, Lu AT, Chen BH, Hernandez DG, Singleton AB, Ferrucci L, Bandinelli S, Salfati E, Manson JE, Quach A, Kusters CD, Kuh D, Wong A, et al. Menopause accelerates biological aging. Proc Natl Acad Sci USA. 2016; 113:9327–32. https://doi.org/10.1073/pnas.1604558113 [PubMed]
-
35.
Vidal L, Lopez-Golan Y, Rego-Perez I, Horvath S, Blanco FJ, Riancho JA, Gomez-Reino JJ, Gonzalez A. Specific increase of methylation age in osteoarthritis cartilage. Osteoarthritis Cartilage. 2016; 24:S63. https://doi.org/10.1016/j.joca.2016.01.140
-
36.
Horvath S, Ritz BR. Increased epigenetic age and granulocyte counts in the blood of Parkinson’s disease patients. Aging (Albany NY). 2015; 7:1130–42. https://doi.org/10.18632/aging.100859 [PubMed]
-
37.
Boyko AR. The domestic dog: man’s best friend in the genomic era. Genome Biol. 2011; 12:216. https://doi.org/10.1186/gb-2011-12-2-216 [PubMed]
-
38.
Kaeberlein M, Creevy KE, Promislow DE. The dog aging project: translational geroscience in companion animals. Mamm Genome. 2016; 27:279–88. https://doi.org/10.1007/s00335-016-9638-7 [PubMed]
-
39.
Karyadi DM, Karlins E, Decker B, vonHoldt BM, Carpintero-Ramirez G, Parker HG, Wayne RK, Ostrander EA. A copy number variant at the KITLG locus likely confers risk for canine squamous cell carcinoma of the digit. PLoS Genet. 2013; 9:e1003409. https://doi.org/10.1371/journal.pgen.1003409 [PubMed]
-
40.
Decker B, Parker HG, Dhawan D, Kwon EM, Karlins E, Davis BW, Ramos-Vara JA, Bonney PL, McNiel EA, Knapp DW, Ostrander EA. Homologous Mutation to Human BRAF V600E Is Common in Naturally Occurring Canine Bladder Cancer--Evidence for a Relevant Model System and Urine-Based Diagnostic Test. Mol Cancer Res. 2015; 13:993–1002. https://doi.org/10.1158/1541-7786.MCR-14-0689 [PubMed]
-
41.
Bronson RT. Variation in age at death of dogs of different sexes and breeds. Am J Vet Res. 1982; 43:2057–59. [PubMed]
-
42.
O’Neill DG, Church DB, McGreevy PD, Thomson PC, Brodbelt DC. Longevity and mortality of owned dogs in England. Vet J. 2013; 198:638–43. https://doi.org/10.1016/j.tvjl.2013.09.020 [PubMed]
-
43.
Speakman JR. Body size, energy metabolism and lifespan. J Exp Biol. 2005; 208:1717–30. https://doi.org/10.1242/jeb.01556 [PubMed]
-
44.
Li Y, Deeb B, Pendergrass W, Wolf N. Cellular proliferative capacity and life span in small and large dogs. J Gerontol A Biol Sci Med Sci. 1996; 51:B403–08. https://doi.org/10.1093/gerona/51A.6.B403 [PubMed]
-
45.
Landon DB, Peterson RO, Mech LD. Evaluation of age determination techniques for gray wolves. J Wildl Manage. 1998; 62:674–82. https://doi.org/10.2307/3802343
-
46.
Gipson PH, Nowak RM, Mech LD. Accuracy and precision of estimating age of gray wolves by tooth wear. J Wildl Manage. 2002; 64:752–58. https://doi.org/10.2307/3802745
-
47.
LD M. (2006). Estimated age structure of wolves in northeastern Minnesota. (USGS Northern Prairie Wildlife Research Center.
-
48.
Medjo DC, Mech LD. Reproductive activity in nine- and ten-month-old wolves. J Mammal. 1976; 57:406–08. https://doi.org/10.2307/1379708 [PubMed]
-
49.
Gese EM, Mech LD. Dispersal of wolves (Canis lupus) in northeastern Minnesota. Can J Zool. 1991; 69:2946–55. https://doi.org/10.1139/z91-415
-
50.
Janowitz Koch IC, Thompson MJ, Deere-Machemer KA, Wang J, Duarte L, Gnanadesikan GE, McCoy EL, Rubbi L, Stahler DR. pellegrini M, Ostrander EA, Wayne RK, Sinsheimer JS, vonHoldt BM. The concerted impact of domestication and transposon insertions on methylation patterns between dogs and grew wolves. Mol Ecol. 2016; 25:1838–55. https://doi.org/10.1111/mec.13480 [PubMed]
-
51.
Ostrander EA, Wayne RK. The canine genome. Genome Res. 2005; 15:1706–16. https://doi.org/10.1101/gr.3736605 [PubMed]
-
52.
Parker HG, Shearin AL, Ostrander EA. Man’s best friend becomes biology’s best in show: genome analyses in the domestic dog. Annu Rev Genet. 2010; 44:309–36. https://doi.org/10.1146/annurev-genet-102808-115200 [PubMed]
-
53.
Schoenebeck JJ, Ostrander EA. Insights into morphology and disease from the dog genome project. Annu Rev Cell Dev Biol. 2014; 30:535–60. https://doi.org/10.1146/annurev-cellbio-100913-012927 [PubMed]
-
54.
Mathews LS, Hammer RE, Brinster RL, Palmiter RD. Expression of insulin-like growth factor I in transgenic mice with elevated levels of growth hormone is correlated with growth. Endocrinology. 1988; 123:433–37. https://doi.org/10.1210/endo-123-1-433 [PubMed]
-
55.
Bartke A. Minireview: role of the growth hormone/insulin-like growth factor system in mammalian aging. Endocrinology. 2005; 146:3718–23. https://doi.org/10.1210/en.2005-0411 [PubMed]
-
56.
Powell-Braxton L, Hollingshead P, Warburton C, Dowd M, Pitts-Meek S, Dalton D, Gillett N, Stewart TA. IGF-I is required for normal embryonic growth in mice. Genes Dev. 1993; 7:2609–17. https://doi.org/10.1101/gad.7.12b.2609 [PubMed]
-
57.
Boyko AR, Quignon P, Li L, Schoenebeck JJ, Degenhardt JD, Lohmueller KE, Zhao K, Brisbin A, Parker HG, vonHoldt BM, Cargill M, Auton A, Reynolds A, et al. A simple genetic architecture underlies morphological variation in dogs. PLoS Biol. 2010; 8:e1000451. https://doi.org/10.1371/journal.pbio.1000451 [PubMed]
-
58.
Sutter NB, Bustamante CD, Chase K, Gray MM, Zhao K, Zhu L, Padhukasahasram B, Karlins E, Davis S, Jones PG, Quignon P, Johnson GS, Parker HG, et al. A single IGF1 allele is a major determinant of small size in dogs. Science. 2007; 316:112–15. https://doi.org/10.1126/science.1137045 [PubMed]
-
59.
Thompson MJ, Rubbi L, Dawson DW, Donahue TR, Pellegrini M. Pancreatic cancer patient survival correlates with DNA methylation of pancreas development genes. PLoS One. 2015; 10:e0128814. https://doi.org/10.1371/journal.pone.0128814 [PubMed]
-
60.
Benjamini Y, and Hochberg, Y. Controlling the false discovery rate: a practical and powerful approach to multiple testing.J R Stat Soc Ser B Methodological. 1995; 57:289-300.
-
61.
Horvath S, Gurven M, Levine ME, Trumble BC, Kaplan H, Allayee H, Ritz BR, Chen B, Lu AT, Rickabaugh TM, Jamieson BD, Sun D, Li S, et al. An epigenetic clock analysis of race/ethnicity, sex, and coronary heart disease. Genome Biol. 2016; 17:171. https://doi.org/10.1186/s13059-016-1030-0 [PubMed]
-
62.
Lu AT, Hannon E, Levine ME, Hao K, Crimmins EM, Lunnon K, Kozlenkov A, Mill J, Dracheva S, Horvath S. Genetic variants near MLST8 and DHX57 affect the epigenetic age of the cerebellum. Nat Commun. 2016; 7:10561. https://doi.org/10.1038/ncomms10561 [PubMed]
-
63.
Quach A, Levine ME, Tanaka T, Lu AT, Chen BH, Ferrucci L, Ritz B, Bandinelli S, Neuhouser ML, Beasley JM, Snetselaar L, Wallace RB, Tsao PS, et al. Epigenetic clock analysis of diet, exercise, education, and lifestyle factors. Aging (Albany NY). 2017. 14;9(2):419-446.
-
64.
Clopper CP, Pearson ES. E.S. The use of confidence or fiducial limits illustrated in the case of the binomial. Biometrika. 1934; 26:404–13. https://doi.org/10.1093/biomet/26.4.404
-
65.
Mazumder R, Hastie T, Tibshirani R. Spectral Regularization Algorithms for Learning Large Incomplete Matrices. J Mach Learn Res. 2010; 11:2287–322. [PubMed]
-
66.
Friedman J, Hastie T, Tibshirani R. Regularization Paths for Generalized Linear Models via Coordinate Descent. J Stat Softw. 2010; 33:1–22. https://doi.org/10.18637/jss.v033.i01 [PubMed]
-
67.
Kent WJ, Sugnet CW, Furey TS, Roskin KM, Pringle TH, Zahler AM, Haussler D. The human genome browser at UCSC. Genome Res. 2002; 12:996–1006. https://doi.org/10.1101/gr.229102 [PubMed]
-
68.
McLean CY, Bristor D, Hiller M, Clarke SL, Schaar BT, Lowe CB, Wenger AM, Bejerano G. GREAT improves functional interpretation of cis-regulatory regions. Nat Biotechnol. 2010; 28:495–501. https://doi.org/10.1038/nbt.1630 [PubMed]
-
69.
Subramanian A, Tamayo P, Mootha VK, Mukherjee S, Ebert BL, Gillette MA, Paulovich A, Pomeroy SL, Golub TR, Lander ES, Mesirov JP. Gene set enrichment analysis: a knowledge-based approach for interpreting genome-wide expression profiles. Proc Natl Acad Sci USA. 2005; 102:15545–50. https://doi.org/10.1073/pnas.0506580102 [PubMed]
-
70.
Ben-Porath I, Thomson MW, Carey VJ, Ge R, Bell GW, Regev A, Weinberg RA. An embryonic stem cell-like gene expression signature in poorly differentiated aggressive human tumors. Nat Genet. 2008; 40:499–507. https://doi.org/10.1038/ng.127 [PubMed]