


Introduction
Werner syndrome (WS, OMIM: 277700) is an autosomal recessive progeroid syndrome characterized by the appearance of multiple features of aging beginning in early adulthood. Approximately 90% of individuals presenting with WS have mutations in the WRN gene, which encodes a 1432 amino acid protein with a central domain characteristic of members of the Rec Q family of helicases. The clinical phenotype of WS includes scleroderma-like skin changes, bilateral ocular cataracts, type 2 diabetes mellitus, osteoporosis, hypogonadism, and atherosclerosis. The most common causes of death are cancer and myocardial infarction and the average age at death is 54 years [1,2].
Little is known about the association of epigenetic alterations with WS. Several recent studies have proposed to measure the physiological age of tissue samples by combining the DNA methylation levels of multiple dinucleotide markers, known as Cytosine phosphate Guanines or CpGs [3–7]. In particular, the “Epigenetic Clock” was developed to measure the age of sorted human cell types (CD4+ T cells or neurons), all tissues, and organs including blood, brain, breast, kidney, liver, and lung [6]. The epigenetic clock is defined as a weighted average across 353 CpG sites. The resulting age estimate (in units of years) is referred to as "DNA methylation age" (DNAm age) or "epigenetic age". Recent studies support the idea that epigenetic age estimates are at least passive biomarkers of biological age. For instance, the epigenetic age of blood has been found to be predictive of all-cause mortality [8–12], frailty [13], lung cancer [14], and cognitive and physical functioning [15]. Further, the utility of the epigenetic clock method using various tissues and organs has been demonstrated in studies of Alzheimer's disease [16], centenarian status [10,17], Down syndrome [18], HIV infection [19], Huntington's disease [20], obesity [21], lifetime stress [22], menopause [23], osteoarthritis [24], and Parkinson's disease [25]. Despite many diverse applications of the epigenetic clock, we are not aware of any studies that have analyzed epigenetic aging rates in WS.
Here we show for the first time that measures of epigenetic age acceleration are indeed associated with WS status. Different from typical epigenome-wide association studies (EWAS) that interrogate individual CpGs, the current study posits a single hypothesis: WS is associated with epigenetic age acceleration in blood cells. In a secondary analysis, we also relate WS status to abundance measures of blood cell types that were estimated using DNA methylation data.
Results
Subjects and tissue
We analyzed DNA methylation levels by the Illumina Infinium MethylationEPIC BeadChip in whole blood of 18 patients with confirmed mutations in the WRN gene (16 male, 2 female) and 18 controls, which were matched for age and for gender (with one exception: 15 male, 3 female) (Table 1).
Table 1. Sample characteristics of matched WS cases and controls.
| Sample ID | Disease status | Registry # | gender | age |
| PWM18 | WS | CHAR1010 | male | 18 |
| CM18 | control | male | 18 | |
| PWM22 | WS | KERA1010 | male | 22 |
| CM22 | control | male | 22 | |
| PWF31 | WS | PA1010 | female | 31 |
| CF31 | control | female | 31 | |
| PWM32 | WS | BOERN1010 | male | 32 |
| CM32 | control | male | 32 | |
| PWF36 | WS | TIT1010 | female | 36 |
| CF36 | control | female | 36 | |
| PWM37-1 | WS | AFRI1010 | male | 37 |
| CM37-1 | control | male | 37 | |
| PWM37-2 | WS | TORON1010 | male | 37 |
| CM37-2 | control | male | 37 | |
| PWM37-3 | WS | VELO1010 | male | 37 |
| CM37-3 | control | male | 37 | |
| PWM38 | WS | ZE1010 | male | 38 |
| CM38 | control | male | 38 | |
| PWM39 | WS | MASS1010 | male | 39 |
| CM39 | control | male | 39 | |
| PWM40 | WS | MARY1010 | male | 40 |
| CM40 | control | male | 40 | |
| PWM43-1 | WS | HAWI1010 | male | 43 |
| CM43-1 | control | male | 43 | |
| PWM43-2 | WS | NY1010 | male | 43 |
| CM43-2 | control | male | 43 | |
| PWM45-1 | WS | BIA1010 | male | 45 |
| CM45-1 | control | male | 45 | |
| PWM45-2 | WS | USC1010 | male | 45 |
| CM45-2 | control | male | 45 | |
| PWM47 | WS | CHAP1010 | male | 47 |
| CM47 | control | male | 47 | |
| PWM49 | WS | CONST1010 | male | 49 |
| CM49 | control | male | 49 | |
| PWF59 | WS | TY1010 | female | 59 |
| CM59 | control | male | 59 |
Accuracy of the epigenetic clock
DNAm age (also referred to as epigenetic age) was calculated as described in [6]. Mathematical details and software tutorials for the epigenetic clock can be found in the Additional files of [6]. An online age calculator can be found at our webpage (https://dnamage.genetics.ucla.edu). All of the described epigenetic measures of aging and age acceleration are implemented in our freely available software.
As expected, DNAm age has a strong linear relationship with chronological age (r=0.83, Figure 1A).
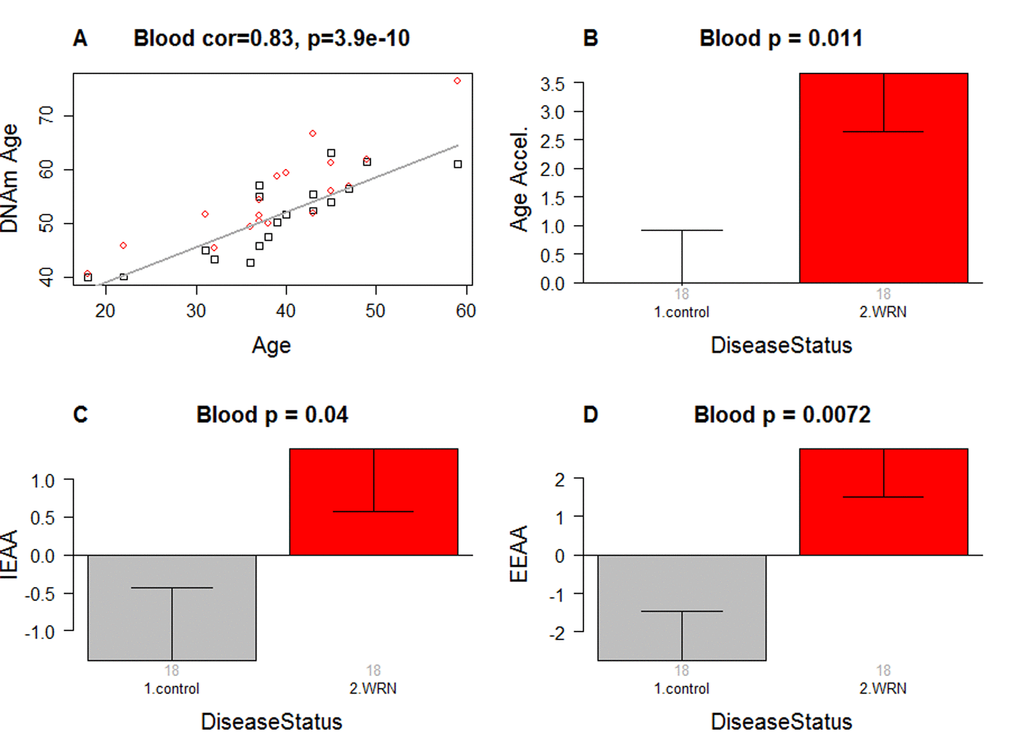
Figure 1. Epigenetic age analysis of Werner syndrome. (A) DNA methylation age (y-axis) versus chronological age (x-axis). Dots correspond to subjects and are colored by WS status (red=case, black=control). We define three measures of epigenetic age acceleration. (B) presents results for the "universal" measure of epigenetic age acceleration, which is defined as residual to a regression line through the control samples, i.e. the vertical distance of a point from the line. By definition, the mean age acceleration in controls is zero. (C) The bar plots relate measures of intrinsic epigenetic age acceleration to WS status. This measure is independent of blood cell counts. (D) shows findings for the measure of extrinsic epigenetic age acceleration, which does relate to changes in cell composition. Each bar plot depicts the mean value (y-axis), 1 standard error, and the group size (underneath the bar). The p-value results from the Kruskal Wallis test, which is a non-parametric group comparison test.
Werner syndrome is associated with intrinsic and extrinsic epigenetic age acceleration
In this article, we consider three measures of epigenetic age acceleration (Methods). The first measure, which will be referred to as a universal measure of age acceleration (denoted AgeAccel) applies to virtually all tissues and cell types (with the exception of sperm). The other two measures (referred to as intrinsic and extrinsic age acceleration, respectively) only apply to peripheral blood cells. The universal measure AgeAccel is defined as the difference between DNAm age value and the value predicted by a linear regression model in controls. The measure of intrinsic epigenetic age acceleration (IEAA) measures "pure" epigenetic aging effects in blood cells that are not confounded by differences in blood cell counts. The measure of extrinsic epigenetic age acceleration (EEAA) aims to measure aging in immune related components and also relates to age-associated changes in blood cell composition such as the decrease of naïve CD8+ T cells and the increase in memory or exhausted CD8+ T cells [26–28]. EEAA is defined on the basis of a weighted average of the epigenetic age measure from [5] and three blood cell types that are known to change with age: naïve (CD45RA+CCR7+) cytotoxic T cells, exhausted (CD28-CD45RA-) cytotoxic T cells, and plasma B cells. By definition, EEAA has a positive correlation with the amount of exhausted CD8+ T cells and plasma blast cells and a negative correlation with the amount of naïve CD8+ T cells. Blood cell counts were estimated based on DNA methylation data as described in Methods. By construction, our three measures of epigenetic age acceleration are uncorrelated (r=0) with chronological age at the time of blood draw.
WS is significantly associated with epigenetic age acceleration according to all three measures of epigenetic age acceleration (Figure 1B,C,D). The strongest association can be observed for EEAA (p=0.0072).
To estimate the actual amount of age acceleration, we regressed DNAm age on disease status, age, gender, and blood cell count estimates. According to this multivariate regression model, the blood of WS cases is 6.4 years older than that of age matched controls (Table 2).
Table 2. Multivariate model analysis.
| Covariate | Coef | Std. Error | T-statistic | P-value | |||||||||||||||||||||||||||||||||||||||||||||||||||||||||||||||||||||||||||||||||||||||||||||||
| Age | 0.66293 | 0.103509 | 6.4046 | 6.2x10⁻⁷ | |||||||||||||||||||||||||||||||||||||||||||||||||||||||||||||||||||||||||||||||||||||||||||||||
| Werner Syndrome | 4.250449 | 1.560597 | 2.7236 | 0.011 | |||||||||||||||||||||||||||||||||||||||||||||||||||||||||||||||||||||||||||||||||||||||||||||||
| Gender(female) | -1.97987 | 2.141069 | -0.9247 | 0.36 | |||||||||||||||||||||||||||||||||||||||||||||||||||||||||||||||||||||||||||||||||||||||||||||||
| CD4+T cell | 35.42897 | 27.09406 | 1.3076 | 0.20 | |||||||||||||||||||||||||||||||||||||||||||||||||||||||||||||||||||||||||||||||||||||||||||||||
| Granulocyte | 34.03732 | 19.64958 | 1.7322 | 0.094 | |||||||||||||||||||||||||||||||||||||||||||||||||||||||||||||||||||||||||||||||||||||||||||||||
| Natural Killer cell | 17.97726 | 24.01823 | 0.7484 | 0.46 | |||||||||||||||||||||||||||||||||||||||||||||||||||||||||||||||||||||||||||||||||||||||||||||||
| Naïve CD8+ T cell | -0.00363 | 0.021163 | -0.1716 | 0.86 | |||||||||||||||||||||||||||||||||||||||||||||||||||||||||||||||||||||||||||||||||||||||||||||||
| DNA methylation age (outcome) is regressed on chronological age, disease status, gender, and blood cell counts. Note that WS is associated with an increased age of 4.250449/0.662930=6.4 years. | |||||||||||||||||||||||||||||||||||||||||||||||||||||||||||||||||||||||||||||||||||||||||||||||||||
Conditional logistic regression analysis
Our previous multivariate linear model analysis ignored the fact that cases and controls were grouped into matched pairs. To adjust for this matched pair design, we used a conditional logistic regression analysis that automatically adjusted for chronological age and gender. According to univariate conditional logistic regression models, WS status (dependent variable) is significantly associated with AgeAccel (p=0.047, regression coefficient=0.258, standard error=0.130), IEAA (p=0.045, coef=0.271, SE=0.135) and to a lesser extent with EEAA (p=0.071, coef=0.164, SE=0.0907).
Suggestive evidence for a decreased abundance of naïve CD8+ T cells in Werner syndrome
In a secondary analysis, we related disease status to blood cell count estimates based on DNA methylation data (Figure 2). Comparison of age adjusted blood cell counts between WS patients and controls revealed a significant decrease of naïve CD8+ T cells (CD8+CD45RA + CCR7+) in WS cases (p=0.025, Figure 2C). However, the p-value (p=0.025) is not significant after adjusting for multiple comparisons. Further, WS was not associated with naïve CD8+ T counts in a conditional logistic regression model analysis (p=0.16) that adjusted for the matched pair design. None of the blood cell counts were related to WS status according to our conditional logistic regression model analysis.
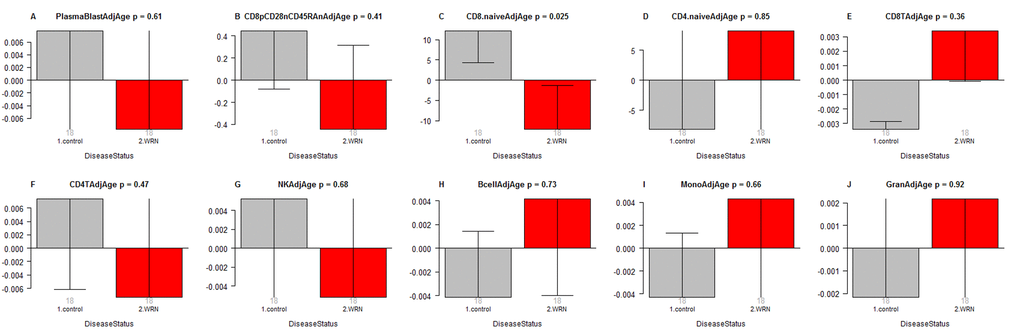
Figure 2. Age adjusted blood cell counts versus Werner syndrome status. WS status (x-axis) versus the age adjusted estimate of (A) plasma blasts, (B) exhausted CD8+ T cells (defined as CD8+CD28-CD45RA-), (C) naïve CD8+ T cell count, (D) naïve CD4+ T cell count, (E) CD8+ T cells, (F) CD4+ T cells, (G) natural killer cells, (H) B cells, (I) monocytes, (J) granulocytes. The abundance measures of blood cell counts were estimated based on DNA methylation levels using the epigenetic clock software. Each bar plot depicts the mean value (y-axis), one standard error, and the group size (underneath the bar). The p-value results from a non-parametric group comparison test (Kruskal Wallis).
Discussion
Using a novel DNA methylation data set, we demonstrate accelerated epigenetic aging effects in WS. WS has a significant relationship with all three measures of epigenetic age acceleration. The observed accelerated epigenetic aging effects do not reflect confounding due to changes in blood cell composition because a) they can be observed for cell-intrinsic measures of age acceleration (IEAA) and b) they remain significant in multivariate models that adjust for blood cell counts.
Since all of our WS cases had confirmed mutations in the WRN gene, the epigenetic aging effects must be a consequence of loss of function mutations in the WRN gene. In the following, we discuss several theories that might explain the observed epigenetic age acceleration in blood.
The helicase theory of accelerated epigenetic aging
The WRN gene encodes a 1432 amino acid protein with a central domain characteristic of members of the Rec Q family of helicases. Since the WRN probably plays an important role in a DNA helicase it stands to reason that the observed accelerated epigenetic aging effect in WS results from a process in which DNA helicases play an important role. More generally it might result from a process that involves both DNA and RNA helicases. Helicases are enzymes that bind and may even remodel nucleic acid or nucleic acid protein complexes. There are both RNA helicases and DNA helicases (such as WRN). DNA helicases function in cellular processes where double-stranded DNA must be separated, including DNA replication, DNA repair, and transcription. By contrast, RNA helicases are involved in shaping the form of RNA molecules, during all processes involving RNA, such as transcription, splicing, and translation. Interestingly, two recent papers suggest that RNA helicases affect epigenetic aging rates in the cerebellum: a genome-wide association study of epigenetic aging rates in the cerebellum implicated DHX57 (DEAH-Box Helicase 57) which is an RNA helicase [29]. Further, an epigenetic clock analysis of tissues from centenarians found that "helicase activity" might explain the finding that the cerebellum ages more slowly than other brain regions [17]. Overall, these results suggest that both RNA and DNA helicases affect epigenetic aging rates. The helicase theory of epigenetic aging has the following shortcomings. First, the relationship between RNA helicase activity and epigenetic age acceleration could only be observed in the cerebellum (and not yet in peripheral blood cells). Second, DNA helicases (such as WRN) may have little in common with RNA helicases. Third, helicase genes are not a smoking gun for any particular molecular process because they are ubiquitous and essential proteins for many processes.
The epigenomic instability theory of accelerated epigenetic aging
The WRN protein has exonuclease and helicase activities and is involved in DNA repair, DNA replication, recombination, transcription, and telomere maintenance [30,31]. Thus, the discovery that loss of function of WRN is the cause of WS supports a major role for genomic instability as a fundamental mechanism of aging [32]. A recent study provides evidence of an important role of WRN in the maintenance of chromatin stability of mesenchymal stem cells [40]. We hypothesized that the epigenetic clock might relate to the actions of an epigenomic maintenance system [6]. Under this hypothesis, our results suggest that loss of function of WRN affects the epigenomic maintenance system resulting in increased epigenetic age. The main problem with the epigenomic instability theory of accelerated aging is the paucity of mechanistic details.
The telomere theory of accelerated epigenetic aging
This theory posits that epigenetic age acceleration in WS could result from telomere shortening. It was suggested that genomic instability is caused by telomere loss during DNA replication and that loss of WRN helicase activity promotes telomere loss [33]. Fibroblasts from WS patients grow poorly in culture and display a reduced lifespan. However, ectopic expression of telomerase in WS fibroblast cell lines partially rescues them from accelerated replicative senescence and increases genomic integrity [34,35]. The average telomere erosion rate in bulk-cultured WS cells was shown to vary from that of normal fibroblasts to four times that of normal. At the single cell level, WS fibroblasts display telomere dynamics not significantly different from those in control fibroblasts, suggesting that the accelerated replicative senescence observed in WS fibroblasts is not caused by accelerated telomere shortening [36]. In contrast, an in vivo study showed that TRF (Telomere Restriction Fragment) lengths in skin samples of WS patients in their thirties were comparable with that of healthy samples, but were shorter in older WS patients compared to controls. Regression analysis is showed that the TRF length in skin and muscle of individuals with WS was significantly shorter than those in controls [37]. A major problem with this telomere theory of epigenetic age acceleration is that intrinsic epigenetic age acceleration is not correlated with telomere length in peripheral blood cells or adipose tissue [13,21,38].
The immunosenescence theory of accelerated epigenetic aging
This theory posits that the observed accelerated epigenetic aging effects in blood result from changes in blood cell composition that mirror those observed in immunosenescence. It is well known that a profound age-associated alteration in the T cell compartment is the reduction of naïve CD8+ T cells, which are involved in protection against infectious diseases and play an important role in immune surveillance against malignancies [27].
The theory is supported a) by our suggestive finding regarding the reduction of naïve CD8+ T cells in WS. However, the immunosenescence theory has several severe shortcomings including the following. First, the observed decrease in naïve CD8+ T cells only led to a p-value of 0.025 that is not significant after adjusting for multiple comparisons. This suggestive result requires replication in a larger study preferably involving flow cytometric measures. Second, the theory is inconsistent with our observed lack of an association between exhausted CD8+T cells and WS. Third, the observed epigenetic age acceleration effects are independent of changes in blood cell composition according to our multivariate model analysis.
Limitations
We acknowledge the following limitations. First, our sample size was relatively small (18 cases and 18 controls). Second, we focused only on peripheral blood cells. Future studies should evaluate whether accelerated epigenetic aging effects can also be found in other tissues. Third, there is an interesting quantitative difference between the degree of accelerated epigenetic aging deduced from these peripheral blood cell studies of WS patients (6.4 years) and the premature ages of death of these patients. The most recently available data from both Japan and the US indicate that the mean age of death for WS patients is 54 years; this contrasts typical longevities in Japan of ~ 80 years and in the US of ~74 years [39,40]. This discrepancy might reflect the fact that the epigenetic age of blood is only an incomplete measure of organismal age. We believe that organismal age will be better estimated by combining the epigenetic age estimates of multiple tissues and organs.
Conclusions
We demonstrate that WS is associated with increased epigenetic age acceleration in blood according to several highly robust epigenetic measures of age acceleration. This finding reflects cell-intrinsic epigenetic aging effects that are independent of changes in cell composition. Epigenetic age acceleration of blood is not specific to WS but can also be observed in other conditions such as Down syndrome [18] and to a lesser extent in Parkinson's disease [25]. The degree to which these observed epigenetic age acceleration effects are causes or effects of the many geriatric disorders seen in WS remains unknown. A recent study providing evidence of an important role of WRN in the maintenance of chromatin stability of mesenchymal stem cells, however, is consistent with an important causal role [41].
Materials and Methods
Methylation analysis
Whole blood DNA samples of WS patients were sent to us from the International Registry of Werner Syndrome (http://www.wernersyndrome.org/; Seattle, WA). Whole blood samples of controls were collected in the Institute of Human Genetics of the University of Wuerzburg. Sodium bisulfite conversion of genomic DNA was performed using the EZ DNA Methylation™ Kit (Zymo Research, Irvine, CA, USA) according to the provided manual. The Infinium MethylationEPIC BeadChip (Illumina, San Diego, CA, USA) was used according to the manufacturer's protocol to analyze genome-wide DNA methylation. Chips were scanned by iScan (Illumina). Genome Studio (Illumina) was used for background subtraction and normalization to internal controls.
Measures of epigenetic age acceleration
The name of our universal measure of age acceleration (AgeAccel) reflects that it applies to virtually all sources of human DNA (with the exception of sperm). Here we defined it as follows. First, we regressed DNAm age on chronological age in controls. Next, we used the resulting model to predict the DNAm age of each subject. Next, the universal measure was defined as the difference between the observed measure of DNAm age and the predicted value. Thus, a high positive value for AgeAccel indicates that the observed DNAm age is higher than that predicted based on controls. AgeAccel has a relatively weak correlation with blood cell counts [19] but it still relates to blood cell counts.
To subtract out the effect of blood cell counts, we find it useful to define a measure of intrinsic epigenetic age acceleration (IEAA) which measures "pure" epigenetic aging effects that are not confounded by differences in blood cell counts. It is defined as the residual resulting from a multivariate regression model of DNAm age on chronological age and various blood immune cell counts (naïve CD8+ T cells, exhausted CD8+ T cells, plasma B cells, CD4 T cells, natural killer cells, monocytes, and granulocytes).
The measure of extrinsic epigenetic age acceleration (EEAA) aims to measure epigenetic aging in immune related components. EEAA is defined using the following three steps. First, we calculated the epigenetic age measure from Hannum et al based on 71 CpGs [5]. The resulting age estimate is correlated with certain blood cell types [9]. Second, we increased the contribution of blood cell types to the age estimate by forming a weighted average of the Hannum estimate with 3 cell types that are known to change with age: naïve (CD45RA+CCR7+) cytotoxic T cells, exhausted (CD28-CD45RA-) cytotoxic T cells, and plasma B cells using the approach of [42]. The resulting measure of blood age is referred to as BioAge4 in our epigenetic clock software. Third, we defined a measure of age acceleration (EEAA) as the residual resulting from a univariate model regressing BioAge4 on chronological age. By definition, our measure of EEAA has a positive correlation with the amount of exhausted CD8+ T cells and plasma blast cells and a negative correlation with the amount of naïve CD8+ T cells. EEAA is known as BioAge4HAStaticAdjAge in our software.
Blood cell counts were estimated based on DNA methylation data as described in the section entitled "Estimating blood cell counts based on DNA methylation levels. By construction, EEAA tracks both age-related changes in blood cell composition and intrinsic epigenetic changes. By definition, none of our three measures of epigenetic age acceleration are correlated with the chronological age. IEAA differs across ethnic groups [43] but has a negligible association with behavioral/lifestyle factors [44].
Estimating blood cell counts based on DNA methylation levels
We estimate blood cell proportions using two different software tools. Houseman's estimation method [45], which is based on DNA methylation signatures from purified leukocyte samples, was used to estimate the proportions of CD8+ T cells, CD4+ T, natural killer, B cells, and granulocytes. Granulocytes are also known as polymorphonuclear leukocytes. The advanced analysis option of the epigenetic clock software [6,19] was used to estimate the percentage of exhausted CD8+ T cells (defined as CD28-CD45RA-) and the number (count) of naïve CD8+ T cells (defined as (-CD45RA+CCR7+). Using another data set, we found that estimated blood cell counts correlate strongly with corresponding flow cytometric measurements r = 0.63 for CD8 + T cells, r = 0.77 for CD4+ T, r = 0.67 B cell, r = 0.68 naïve CD8+ T cell, r = 0.86 for naïve CD4+ T, and r = 0.49 for exhausted CD8+ T cells [43].
Acknowledgements
We want to thank the participants of the International Registry of Werner Syndrome (http://www.wernersyndrome.org/; Seattle, WA).
Conflicts of Interest
The authors declare there are no potential conflicts of interest.
Funding
This work was supported, in part, by the German Cancer Foundation (110805) and NIH grants, U34AG051425 (SH), R24AG042328 (GMM/JO) and R01CA210916 (GMM/JO).
References
- 1. Goto M. Hierarchical deterioration of body systems in Werner’s syndrome: implications for normal ageing. Mech Ageing Dev. 1997; 98:239–54. https://doi.org/10.1016/S0047-6374(97)00111-5 [PubMed]
- 2. Oshima J, Hisama FM. Search and insights into novel genetic alterations leading to classical and atypical Werner syndrome. Gerontology. 2014; 60:239–46. https://doi.org/10.1159/000356030 [PubMed]
- 3. Bocklandt S, Lin W, Sehl ME, Sánchez FJ, Sinsheimer JS, Horvath S, Vilain E. Epigenetic predictor of age. PLoS One. 2011; 6:e14821. https://doi.org/10.1371/journal.pone.0014821 [PubMed]
- 4. Garagnani P, Bacalini MG, Pirazzini C, Gori D, Giuliani C, Mari D, Di Blasio AM, Gentilini D, Vitale G, Collino S, Rezzi S, Castellani G, Capri M, et al. Methylation of ELOVL2 gene as a new epigenetic marker of age. Aging Cell. 2012; 11:1132–34. https://doi.org/10.1111/acel.12005 [PubMed]
- 5. Hannum G, Guinney J, Zhao L, Zhang L, Hughes G, Sadda S, Klotzle B, Bibikova M, Fan JB, Gao Y, Deconde R, Chen M, Rajapakse I, et al. Genome-wide methylation profiles reveal quantitative views of human aging rates. Mol Cell. 2013; 49:359–67. https://doi.org/10.1016/j.molcel.2012.10.016 [PubMed]
- 6. Horvath S. DNA methylation age of human tissues and cell types. Genome Biol. 2013; 14:R115. https://doi.org/10.1186/gb-2013-14-10-r115 [PubMed]
- 7. Lin Q, Weidner CI, Costa IG, Marioni RE, Ferreira MR, Deary IJ, Wagner W. DNA methylation levels at individual age-associated CpG sites can be indicative for life expectancy. Aging (Albany NY). 2016; 8:394–401. https://doi.org/10.18632/aging.100908 [PubMed]
- 8. Christiansen L, Lenart A, Tan Q, Vaupel JW, Aviv A, McGue M, Christensen K. DNA methylation age is associated with mortality in a longitudinal Danish twin study. Aging Cell. 2016; 15:149–54. https://doi.org/10.1111/acel.12421 [PubMed]
- 9. Marioni RE, Shah S, McRae AF, Chen BH, Colicino E, Harris SE, Gibson J, Henders AK, Redmond P, Cox SR, Pattie A, Corley J, Murphy L, et al. DNA methylation age of blood predicts all-cause mortality in later life. Genome Biol. 2015; 16:25. https://doi.org/10.1186/s13059-015-0584-6 [PubMed]
- 10. Horvath S, Pirazzini C, Bacalini MG, Gentilini D, Di Blasio AM, Delledonne M, Mari D, Arosio B, Monti D, Passarino G, De Rango F, D’Aquila P, Giuliani C, et al. Decreased epigenetic age of PBMCs from Italian semi-supercentenarians and their offspring. Aging (Albany NY). 2015; 7:1159–70. https://doi.org/10.18632/aging.100861 [PubMed]
- 11. Perna L, Zhang Y, Mons U, Holleczek B, Saum KU, Brenner H. Epigenetic age acceleration predicts cancer, cardiovascular, and all-cause mortality in a German case cohort. Clin Epigenetics. 2016; 8:64. https://doi.org/10.1186/s13148-016-0228-z [PubMed]
- 12. Chen BH, Marioni RE, Colicino E, Peters MJ, Ward-Caviness CK, Tsai PC, Roetker NS, Just AC, Demerath EW, Guan W, Bressler J, Fornage M, Studenski S, et al. DNA methylation-based measures of biological age: meta-analysis predicting time to death. Aging (Albany NY). 2016; 8:1844–65. https://doi.org/10.18632/aging.101020 [PubMed]
- 13. Breitling LP, Saum KU, Perna L, Schöttker B, Holleczek B, Brenner H. Frailty is associated with the epigenetic clock but not with telomere length in a German cohort. Clin Epigenetics. 2016; 8:21. https://doi.org/10.1186/s13148-016-0186-5 [PubMed]
- 14. Levine ME, Hosgood HD, Chen B, Absher D, Assimes T, Horvath S. DNA methylation age of blood predicts future onset of lung cancer in the women’s health initiative. Aging (Albany NY). 2015; 7:690–700. https://doi.org/10.18632/aging.100809 [PubMed]
- 15. Marioni RE, Shah S, McRae AF, Ritchie SJ, Muniz-Terrera G, Harris SE, Gibson J, Redmond P, Cox SR, Pattie A, Corley J, Taylor A, Murphy L, et al. The epigenetic clock is correlated with physical and cognitive fitness in the Lothian Birth Cohort 1936. Int J Epidemiol. 2015; 44:1388–96. https://doi.org/10.1093/ije/dyu277 [PubMed]
- 16. Levine ME, Lu AT, Bennett DA, Horvath S. Epigenetic age of the pre-frontal cortex is associated with neuritic plaques, amyloid load, and Alzheimer’s disease related cognitive functioning. Aging (Albany NY). 2015; 7:1198–211. https://doi.org/10.18632/aging.100864 [PubMed]
- 17. Horvath S, Mah V, Lu AT, Woo JS, Choi OW, Jasinska AJ, Riancho JA, Tung S, Coles NS, Braun J, Vinters HV, Coles LS. The cerebellum ages slowly according to the epigenetic clock. Aging (Albany NY). 2015; 7:294–306. https://doi.org/10.18632/aging.100742 [PubMed]
- 18. Horvath S, Garagnani P, Bacalini MG, Pirazzini C, Salvioli S, Gentilini D, Di Blasio AM, Giuliani C, Tung S, Vinters HV, Franceschi C. Accelerated epigenetic aging in Down syndrome. Aging Cell. 2015; 14:491–95. https://doi.org/10.1111/acel.12325 [PubMed]
- 19. Horvath S, Levine AJ. HIV-1 infection accelerates age according to the epigenetic clock. J Infect Dis. 2015; 212:1563–73. https://doi.org/10.1093/infdis/jiv277 [PubMed]
- 20. Horvath S, Langfelder P, Kwak S, Aaronson J, Rosinski J, Vogt TF, Eszes M, Faull RL, Curtis MA, Waldvogel HJ, Choi OW, Tung S, Vinters HV, et al. Huntington’s disease accelerates epigenetic aging of human brain and disrupts DNA methylation levels. Aging (Albany NY). 2016; 8:1485–512. https://doi.org/10.18632/aging.101005 [PubMed]
- 21. Horvath S, Erhart W, Brosch M, Ammerpohl O, von Schönfels W, Ahrens M, Heits N, Bell JT, Tsai PC, Spector TD, Deloukas P, Siebert R, Sipos B, et al. Obesity accelerates epigenetic aging of human liver. Proc Natl Acad Sci USA. 2014; 111:15538–43. https://doi.org/10.1073/pnas.1412759111 [PubMed]
- 22. Zannas AS, Arloth J, Carrillo-Roa T, Iurato S, Röh S, Ressler KJ, Nemeroff CB, Smith AK, Bradley B, Heim C, Menke A, Lange JF, Brückl T, et al. Lifetime stress accelerates epigenetic aging in an urban, African American cohort: relevance of glucocorticoid signaling. Genome Biol. 2015; 16:266. https://doi.org/10.1186/s13059-015-0828-5 [PubMed]
- 23. Levine ME, Lu AT, Chen BH, Hernandez DG, Singleton AB, Ferrucci L, Bandinelli S, Salfati E, Manson JE, Quach A, Kusters CD, Kuh D, Wong A, et al. Menopause accelerates biological aging. Proc Natl Acad Sci USA. 2016; 113:9327–32. https://doi.org/10.1073/pnas.1604558113 [PubMed]
- 24. Vidal L, Lopez-Golan Y, Rego-Perez I, Horvath S, Blanco FJ, Riancho JA, Gomez-Reino JJ, Gonzalez A. Specific increase of methylation age in osteoarthritis cartilage. Osteoarthritis Cartilage. 2016; 24:S63. https://doi.org/10.1016/j.joca.2016.01.140
- 25. Horvath S, Ritz BR. Increased epigenetic age and granulocyte counts in the blood of Parkinson’s disease patients. Aging (Albany NY). 2015; 7:1130–42. https://doi.org/10.18632/aging.100859 [PubMed]
- 26. Fagnoni FF, Vescovini R, Mazzola M, Bologna G, Nigro E, Lavagetto G, Franceschi C, Passeri M, Sansoni P. Expansion of cytotoxic CD8+ CD28- T cells in healthy ageing people, including centenarians. Immunology. 1996; 88:501–07. https://doi.org/10.1046/j.1365-2567.1996.d01-689.x [PubMed]
- 27. Fagnoni FF, Vescovini R, Passeri G, Bologna G, Pedrazzoni M, Lavagetto G, Casti A, Franceschi C, Passeri M, Sansoni P. Shortage of circulating naïve CD8(+) T cells provides new insights on immunodeficiency in aging. Blood. 2000; 95:2860–68. [PubMed]
- 28. Gruver AL, Hudson LL, Sempowski GD. Immunosenescence of ageing. J Pathol. 2007; 211:144–56. https://doi.org/10.1002/path.2104 [PubMed]
- 29. Lu AT, Hannon E, Levine ME, Hao K, Crimmins EM, Lunnon K, Kozlenkov A, Mill J, Dracheva S, Horvath S. Genetic variants near MLST8 and DHX57 affect the epigenetic age of the cerebellum. Nat Commun. 2016; 7:10561. https://doi.org/10.1038/ncomms10561 [PubMed]
- 30. Yu CE, Oshima J, Fu YH, Wijsman EM, Hisama F, Alisch R, Matthews S, Nakura J, Miki T, Ouais S, Martin GM, Mulligan J, Schellenberg GD. Positional cloning of the Werner’s syndrome gene. Science. 1996; 272:258–62. https://doi.org/10.1126/science.272.5259.258 [PubMed]
- 31. Rossi ML, Ghosh AK, Bohr VA. Roles of Werner syndrome protein in protection of genome integrity. DNA Repair (Amst). 2010; 9:331–44. https://doi.org/10.1016/j.dnarep.2009.12.011 [PubMed]
- 32. Hisama FM, Oshima J, Martin GM. How Research on Human Progeroid and Antigeroid Syndromes Can Contribute to the Longevity Dividend Initiative. Cold Spring Harb Perspect Med. 2016; 6:a025882. https://doi.org/10.1101/cshperspect.a025882 [PubMed]
- 33. Crabbe L, Verdun RE, Haggblom CI, Karlseder J. Defective telomere lagging strand synthesis in cells lacking WRN helicase activity. Science. 2004; 306:1951–53. https://doi.org/10.1126/science.1103619 [PubMed]
- 34. Wyllie FS, Jones CJ, Skinner JW, Haughton MF, Wallis C, Wynford-Thomas D, Faragher RG, Kipling D. Telomerase prevents the accelerated cell ageing of Werner syndrome fibroblasts. Nat Genet. 2000; 24:16–17. https://doi.org/10.1038/71630 [PubMed]
- 35. Crabbe L, Jauch A, Naeger CM, Holtgreve-Grez H, Karlseder J. Telomere dysfunction as a cause of genomic instability in Werner syndrome. Proc Natl Acad Sci USA. 2007; 104:2205–10. https://doi.org/10.1073/pnas.0609410104 [PubMed]
- 36. Baird DM, Davis T, Rowson J, Jones CJ, Kipling D. Normal telomere erosion rates at the single cell level in Werner syndrome fibroblast cells. Hum Mol Genet. 2004; 13:1515–24. https://doi.org/10.1093/hmg/ddh159 [PubMed]
- 37. Ishikawa N, Nakamura K, Izumiyama-Shimomura N, Aida J, Ishii A, Goto M, Ishikawa Y, Asaka R, Matsuura M, Hatamochi A, Kuroiwa M, Takubo K. Accelerated in vivo epidermal telomere loss in Werner syndrome. Aging (Albany NY). 2011; 3:417–29. https://doi.org/10.18632/aging.100315 [PubMed]
- 38. Marioni RE, Harris SE, Shah S, McRae AF, von Zglinicki T, Martin-Ruiz C, Wray NR, Visscher PM, Deary IJ. The epigenetic clock and telomere length are independently associated with chronological age and mortality. Int J Epidemiol. 2016; 45:424–32. https://doi.org/10.1093/ije/dyw041 [PubMed]
- 39. Goto M, Ishikawa Y, Sugimoto M, Furuichi Y. Werner syndrome: a changing pattern of clinical manifestations in Japan (1917~2008). Biosci Trends. 2013; 7:13–22. [PubMed]
- 40. Huang S, Lee L, Hanson NB, Lenaerts C, Hoehn H, Poot M, Rubin CD, Chen DF, Yang CC, Juch H, Dorn T, Spiegel R, Oral EA, et al. The spectrum of WRN mutations in Werner syndrome patients. Hum Mutat. 2006; 27:558–67. https://doi.org/10.1002/humu.20337 [PubMed]
- 41. Zhang W, Li J, Suzuki K, Qu J, Wang P, Zhou J, Liu X, Ren R, Xu X, Ocampo A, Yuan T, Yang J, Li Y, et al. Aging stem cells. A Werner syndrome stem cell model unveils heterochromatin alterations as a driver of human aging. Science. 2015; 348:1160–63. https://doi.org/10.1126/science.aaa1356 [PubMed]
- 42. Klemera P, Doubal S. A new approach to the concept and computation of biological age. Mech Ageing Dev. 2006; 127:240–48. https://doi.org/10.1016/j.mad.2005.10.004 [PubMed]
- 43. Horvath S, Gurven M, Levine ME, Trumble BC, Kaplan H, Allayee H, Ritz BR, Chen B, Lu AT, Rickabaugh TM, Jamieson BD, Sun D, Li S, et al. An epigenetic clock analysis of race/ethnicity, sex, and coronary heart disease. Genome Biol. 2016; 17:171. https://doi.org/10.1186/s13059-016-1030-0 [PubMed]
- 44. Quach A, Levine ME, Tanaka T, Lu AT, Chen BH, Ferrucci L, Ritz B, Bandinelli S, Neuhouser ML, Beasley JM, Snetselaar L, Wallace RB, Tsao PS, et al. Epigenetic clock analysis of diet, exercise, education, and lifestyle factors. Aging (Albany NY). 2017.
- 45. Houseman EA, Accomando WP, Koestler DC, Christensen BC, Marsit CJ, Nelson HH, Wiencke JK, Kelsey KT. DNA methylation arrays as surrogate measures of cell mixture distribution. BMC Bioinformatics. 2012; 13:86. https://doi.org/10.1186/1471-2105-13-86 [PubMed]