


Introduction
Gliomas, ranging from grade II -IV, are the most common malignant intracranial tumors. Modified therapy, combining radiotherapy with/without temozolomide in glioblastoma only increases the two-year survival rate to 27% [1,2]. According to the 2016 World Health Organization (WHO) Classification based on the mutation status of isocitrate dehydrogenase (IDH) and Chromosome 1p/19q status, the diffuse gliomas are mainly divided into five subtypes, Lower grade gliomas (LGG) with IDH-mutant and 1p/19q-codeleted subtype, LGG with IDH-mutant and 1p/19q-intact subtype, LGG with IDH-wildtype subtype, GBM with IDH-mutant subtype, and GBM with IDH-wildtype subtype [3].
Isocitrate dehydrogenase (IDH) is the key metabolic enzymes, converting isocitrate to α-ketoglutarate (αKG). IDH1/2 mutations specifically change the catalytic activity of enzyme, and directly catalyze α-ketoglutarate (α-KG) to R-2-hydroxyglutarate (R-2-HG). R-2-HG, which competitively inhibits multiple dioxygenase, initiates the occurrence of tumors [4]. IDH mutations have been discovered in plenty of tumors, covering adult acute myeloid leukemia (AML), intrahepatic cholangiocarcinoma, pheochromocytoma, etc [5–7]. Meanwhile, IDH mutations are present in nearly 80% of grade II~ III gliomas and secondary glioblastomas [8]. IDH mutations are stable markers to classify gliomas in progression and prognosis, and patients possessing IDH mutations have a significantly longer overall survival (OS) and progression free survival (PFS) in LGG and GBM [4]. However, as far as we know, patients with IDH-mutant glioma exhibited the heterogeneous clinical outcomes. Over the last two decades, genetic and molecular studies have identified several diagnostic and prognostic markers to stratify patients with IDH-mutant glioma. For example, IDH-mutant patients with 1p/19q co-deletion lived longer significantly [9] and ATRX mutation combined with IDH mutation was used to re-classify patients with astrocytic tumors [10–12]. In the present study, we developed a robust prognostic model to predict the overall survival of patients with IDH-mutant glioma. We obtained whole genome mRNA expression profiling data from Chinese Glioma Genome Atlas (CGGA) as training set and The Cancer Genome Atlas (TCGA) as validation set. By applying Time-Dependent receiver operating characteristic (timeROC) curve and GSVA method, we ascertained a seven-gene signature as an independent prognostic factor, which could accurately predict the 3 years and 5 years overall survival for patients with IDH-mutant glioma. This robust prognostic model provided a more comprehensive view for patients with IDH-mutant glioma and highlighted its potential role in the clinical management of gliomas.
Results
Prognostic signature identified in IDH-mutant gliomas
In order to identify robust prognostic significance genes, we used time-dependent AUC to evaluate the gene’s prognostic accuracy of overall survival (3 years and 5 years) in CGGA and TCGA dataset, respectively. The genes with AUC in predicting overall survival (both 3 years and 5 years) more than 0.7 were considered as high prognostic factors. Finally, a total of 535 genes in CGGA dataset and 34 genes in TCGA dataset were selected (Table S1). Seven genes, shared by two datasets, were used to establish the signature in following analysis, including WEE1, HOXD10, HOXD3, HOXD4, PRR11, HIST1H2BJ and IRX5 (Table 1).
Table 1. 7 genes with high prognostic value.
| CGGA (AUC≥0.8) | TCGA (AUC≥0.7) | |||
| Time-dependent AUC | 3 years | 5 years | 3 years | 5 years |
| WEE1 | 0.869139 | 0.815010 | 0.868309 | 0.721559 |
| HOXD10 | 0.817848 | 0.817430 | 0.756850 | 0.743001 |
| HOXD3 | 0.887273 | 0.852331 | 0.713209 | 0.712660 |
| HOXD4 | 0.881592 | 0.845084 | 0.764262 | 0.753305 |
| PRR11 | 0.873778 | 0.920307 | 0.761877 | 0.725740 |
| HIST1H2BJ | 0.874227 | 0.802131 | 0.703374 | 0.703216 |
| IRX5 | 0.819197 | 0.800984 | 0.753487 | 0.736913 |
We then applied the seven genes to develop the enrichment score (ES) using the GSVA method. To assess the prognostic performance of ES, we calculated the ES for every patient in CGGA dataset and divided them into high-ES group and low-ES group based on the cutoff value (median enrichment score). We observed that the patients in high-ES group had a significant shorter overall survival than the low-ES group (p < 0.0001, Figure 1A).
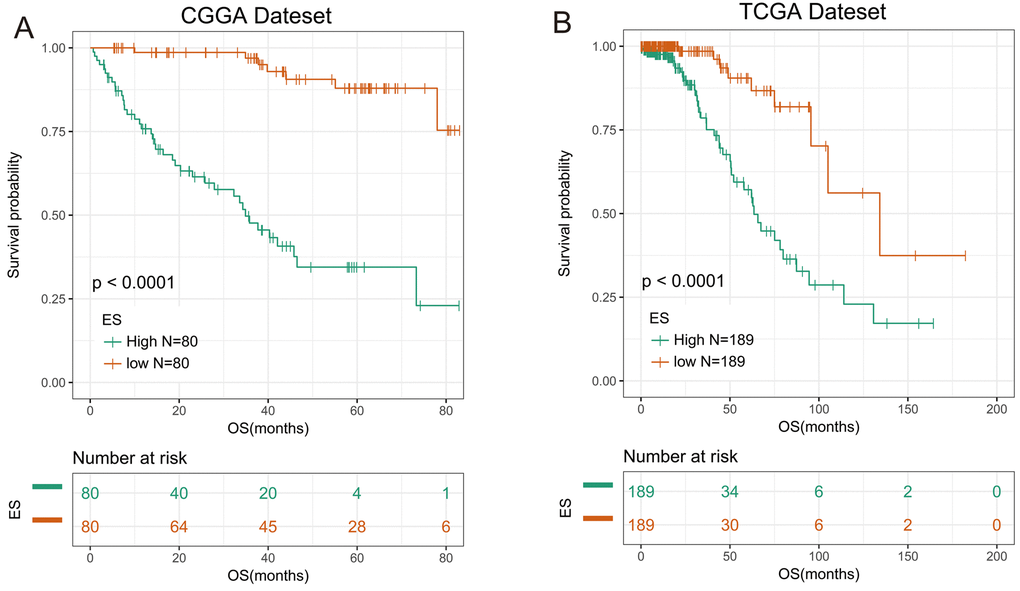
Figure 1. 7-gene signature had good prognostic value in training and validation data set. (A) Kaplan–Meier survival analysis revealed high-ES group was worse in survival in CGGA data set. (B) Kaplan-Meier survival analysis proved high-ES was worse in survival in TCGA data set.
Validation of the prognostic value of the signature in TCGA dataset
For the remaining 378 IDH-mutant glioma patients in TCGA dataset, we used the same method to calculate the enrichment score to validate the prognostic value of the seven-gene enrichment score. We divided patients into high-ES group and low-ES group according to the enrichment score (cutoff: median enrichment score). Ultimately, the result of the validation group was consistent with the training group (p < 0.0001, Figure 1B). Then we evaluated the prediction accuracy of ES of the overall survival. The ES showed higher time-dependent AUC in CGGA (3 years: 0.9342, 5 years: 0.9004) and TCGA (3 years: 0.8156, 5 years: 0.7862) dataset than seven genes individually (Figure 2A and B).
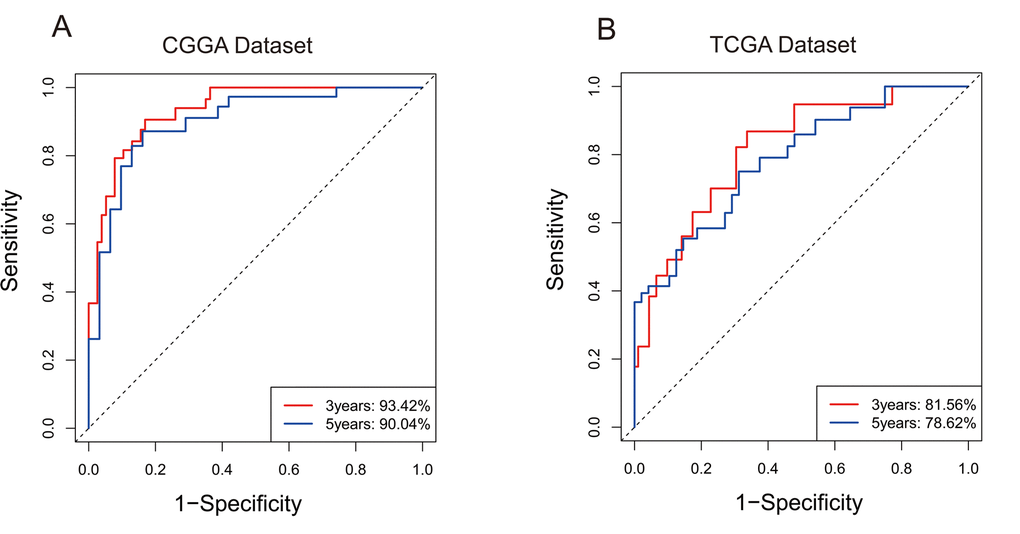
Figure 2. 7-gene signature predicted survival of 3 years and 5 years with high specificity and sensitivity. (A) In CGGA, Area Under Curve (AUC) of 3 years and 5 years reached 93.42% and 90.04%. (B) In TCGA, Area Under Curve (AUC) of 3 years and 5 years reached 81.56% and 78.62%.
To determine whether the seven-gene enrichment score had prognostic value for IDH-wildtype patients, we selected 150 IDH-wildtype gliomas from CGGA and 225 IDH-wildtype gliomas from TCGA and calculated the ES for patients with the same method. A Kaplan-Meier analysis indicated that OS was reduced for high-risk patients with IDH-wildtype glioma (Figure S1A and B). The seven-gene enrichment score could reliably identify the high-risk patients both in patients with IDH-mutant and IDH-wildtype gliomas.
Enrichment score was an independent prognostic factor for IDH-mutant patients
We conducted univariate and multivariate cox regression analysis to assess the prognostic value of our ES after adjusting previous widely accepted prognostic and predictive factors (gender, age, grade) in CGGA and TCGA datasets.
As shown in Table 2, in patients with IDH-mutant glioma, the grade and signature enrichment score were associated with survival in univariate analysis (p < 0.05). After adjusted with grade, enrichment score was still associated with survival significantly (p < 0.001). These results indicated that enrichment score was an independent prognostic factor for overall survival.
Table 2. Univariate and multivariate Cox regression analysis in two datasets.
| Univariate | Multivariate | ||||||||||||||||||||||||||||||||||||||||||||||||||||||||||||||||||||||||||||||||||||||||||||||||||
| HR | 95%CI | p | HR | 95%CI | p | ||||||||||||||||||||||||||||||||||||||||||||||||||||||||||||||||||||||||||||||||||||||||||||||
| Lower | Upper | lower | Upper | ||||||||||||||||||||||||||||||||||||||||||||||||||||||||||||||||||||||||||||||||||||||||||||||||
| CGGA dataset | |||||||||||||||||||||||||||||||||||||||||||||||||||||||||||||||||||||||||||||||||||||||||||||||||||
| Gender | 0.939 | 0.525 | 1.682 | 0.833 | |||||||||||||||||||||||||||||||||||||||||||||||||||||||||||||||||||||||||||||||||||||||||||||||
| Age | 1.517 | 0.752 | 3.060 | 0.244 | |||||||||||||||||||||||||||||||||||||||||||||||||||||||||||||||||||||||||||||||||||||||||||||||
| Grade | 6.583 | 3.535 | 12.26 | <0.001 | 2.746 | 1.445 | 5.220 | 0.002 | |||||||||||||||||||||||||||||||||||||||||||||||||||||||||||||||||||||||||||||||||||||||||||
| Enrichment Score | 10.14 | 4.496 | 22.88 | <0.001 | 7.440 | 3.148 | 17.59 | <0.001 | |||||||||||||||||||||||||||||||||||||||||||||||||||||||||||||||||||||||||||||||||||||||||||
| TCGA dataset | |||||||||||||||||||||||||||||||||||||||||||||||||||||||||||||||||||||||||||||||||||||||||||||||||||
| Gender | 0.889 | 0.508 | 1.553 | 0.678 | |||||||||||||||||||||||||||||||||||||||||||||||||||||||||||||||||||||||||||||||||||||||||||||||
| Age | 1.597 | 0.877 | 2.910 | 0.126 | |||||||||||||||||||||||||||||||||||||||||||||||||||||||||||||||||||||||||||||||||||||||||||||||
| Grade | 3.468 | 1.055 | 11.4 | 0.041 | 2.163 | 0.653 | 7.171 | 0.207 | |||||||||||||||||||||||||||||||||||||||||||||||||||||||||||||||||||||||||||||||||||||||||||
| Enrichment Score | 4.332 | 2.104 | 8.918 | <0.001 | 4.165 | 2.013 | 8.618 | <0.001 | |||||||||||||||||||||||||||||||||||||||||||||||||||||||||||||||||||||||||||||||||||||||||||
| In Cox regression analysis: gender was defined as 1, male, 0, female; age was defined as 1, >45, 0, ≤45;grade was defined as 1, IV, 0, II/III. | |||||||||||||||||||||||||||||||||||||||||||||||||||||||||||||||||||||||||||||||||||||||||||||||||||
Functional annotation of Enrichment Score
In order to further investigate the biological significance and explain the result above, we utilized Pearson correlation analysis to select genes that were strongly correlated with ES (Pearson R ≥ 0.5 in CGGA, Pearson R ≥ 0.4 in TCGA). A total of 637 and 344 genes in CGGA and TCGA dataset met the criteria, respectively (Table S2). We chose the overlapped genes (145 genes) in two datasets for Gene Ontology Analysis in DAVID and found positively related genes were basically enriched in biological functions of cell cycle and cell division (Figures 3A and B), partially explaining the malignancy and poor survival of patients in high-ES group. Meanwhile, we also noticed that 1p/19q co-deletion patients mainly focused on the low-risk group while the 1p/19q intact patients were contrary (CGGA: chi-square = 13.852, p-value = 0.0001977; TCGA: chi-square = 38.938, p-value = 3.505e-09). This result indicated that the ES was closely correlated with 1p/19q status.
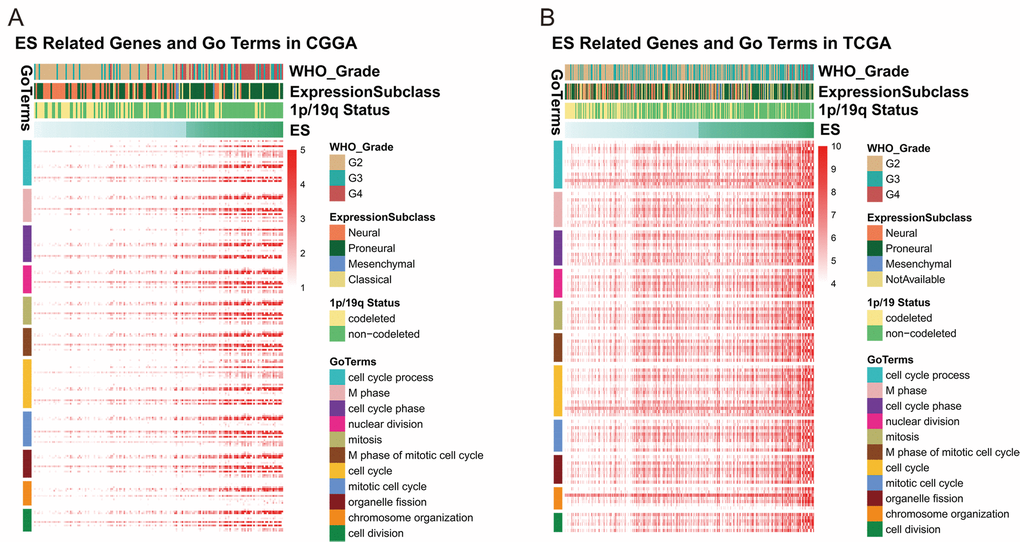
Figure 3. ES positively related genes were involved in biological process of cell cycle and division.
Discussion
The 2016 World Health Organization Classification of Tumors of the Central Nervous System utilized molecular parameters and established the new concept of CNS tumor diagnosis in molecular era [3]. IDH-mutant glioma is an important entity ranging from WHO grade II to grade IV with different clinical manifestations, and objective molecular based classification is in urgent need.
The ROC curve accurately reflects the relationship between specificity and sensitivity of a continuous diagnostic marker. With time-dependent ROC method, Tada T et al detected that HBcrAg was an excellent predictive factor for hepatocellular carcinoma development throughout the follow-up period [13]. Piessevaux H et al revealed that Early Tumor Shrinkage (ETS) was a powerful clinical predictor for patients with metastatic colorectal cancer (mCRC) with cetuximab treatment [14].
Hence, we assumed that a group of genes could accurately predict the survival of patients with IDH-mutant glioma. With the method of time-dependent ROC, we performed gene expression analysis with overall survival in CGGA and TCGA datasets and successfully screened out seven genes with higher time- dependent AUC. Enrichment score (ES) based on seven genes was calculated for every patient and the high-ES group had a significantly poor survival. Utilizing enrichment score, we found time-dependent AUC of 3 years and 5 years was further improved. Univariate and multivariate Cox regression analysis proved that enrichment score was an independent prognostic factor after adjusting grade. However, the time-dependent AUC of 2 years and 3 years in patients with IDH-wildtype glioma (0.6880, 0.8218 in CGGA ; 0.6997, 0.7747 in TCGA; Figure S2A and B) were not as well as patients with IDH-mutant glioma. This result might ascribe to the different genetic backgrounds of gliomas. Through in-depth analysis of the ES-related biological functions, we found that ES was mainly related to cell mitosis and cell division.
The seven genes included in our signature were WEE1, HOXD10, HOXD3, HOXD4, PRR11, HIST1H2BJ, IRX5. To investigate the risk of seven genes, we constructed the heatmap based on gene expression profile. The heatmap showed that the expression of seven genes increased with ES except IRX5 in CGGA dataset and it’s identical in TCGA except WEE1 (Figures S3A and B). Hence, seven genes included in our signature were of high risk and patients with high expression would have a poor prognosis. As shown below, seven genes show some similarity in functions involved in cell mitosis, proliferation, metastasis and progression of tumors. WEE1 encodes a nuclear protein, which inhibits kinase activity of CDK1 and cell mitosis. Some studies found over-expression of WEE1 in gliomas and interfering with WEE1 expression has therapeutic potential in glioblastomas [15]. HOXD10 functions as a transcription factor and is related to some disease such as Wilm's tumor, congenital vertical talus and Charcot-Marie-Tooth disease. HOXD10 is associated with the progression of some tumors [16–18]. HOXD3 regulates cell adhesion processes and enhancing invasion and metastasis of tumor cells. Studies proved that HOXD3 expression was a significant unfavorable prognostic factor for tumor patients [19]. HOXD4 belongs to the homeobox family of genes and we can observe the change of HOXD4 in tumors like colon carcinoma [20] and breast cancer [21]. PRR11 is strictly regulated throughout the cell cycle. PRR11 is a candidate oncogene that has been implicated in the pathogenesis of lung cancer, gastric cancer and hilar cholangiocarcinoma [22–24]. HIST1H2BJ encodes a histone that is a member of H2B family. Four core histones (H2A, H2B, H3, and H4) form an octamer, around which DNA is wrapped in nucleosomes. IRX5 is also related to homeobox gene family and embryonic development. In prostate cancer, IRX5 play an vital role in regulating cell cycle and apoptosis and is expected to play a crucial part in tumor therapy [25]. Interestingly, three genes of the signature belong to the homeobox (HOX) family of genes. HOX is a class of genes that regulate the biological form in an organism, and once these genes mutate, it deforms part of the body. The mechanism of action is to regulate other genes related to cell division, direction of spindle, and the development of wirehair and appendage. Aberrant expression and carcinogenicity of HOX genes have been found in many solid tumors, such as colon, prostate, lung, bladder, ovarian, kidney, breast, etc. And proteins encoded by HOX genes play roles of either transcriptional activators or repressors, both promote oncogenesis [26]. There were also some studies on the interaction between HOX gene and glioma. Guo YB et al. found that inhibition expression of HOXA6 and B13 obviously reduced invasion of GBM U-118 and U-138 cells [27]. Duan R et al. transfected HOXA13 into glioma cells and it promoted proliferation and invasion of cells [28]. Tabuse M et al. silenced the expression of HOXD9 and detected the apoptosis of glioma cell [29]. With RT-PCR, Buccoliero AM et al. perceived the expression pattern of HOXD differed between low-grade gliomas and normal tissues [30]. Meanwhile, some HOX genes are closely related to patients’ survival [28,31].
In summary, we found a seven-gene enrichment score which could be a useful tool of risk stratification and predict the overall survival of 3 years and 5 years for patients with IDH-mutant glioma. These findings extend our understanding of the malignant progression in IDH-mutant gliomas and may potentially help neurosurgeons with the clinical personalized management of IDH-mutant glioma patients.
Materials and Methods
Clinical characteristics of samples
In Chinese Glioma Genome Atlas (CGGA) dataset, we have collected mRNA sequencing data of 167 IDH-mutant glioma samples, ranging from WHO grade II to grade IV, generated with Illumina Hiseq platform. In the Cancer Genome Atlas (TCGA) dataset, mRNA-Seq data of 378 IDH-mutant glioma samples were downloaded online (https://cancergenome.nih.gov/). The clinical and molecular characteristics of those patients from two datasets were shown in Table 3. In CGGA, median age of patients was 38 (ranging from 10 to 62) and median age of TCGA was 39 (ranging from 14 to 75). The proportion of male was 101 (60%) in CGGA and 215 (57%) in TCGA. CGGA dataset included 94 (56%) patients with WHO Grade II glioma, 37 (22%) with Grade III glioma and 36 (22%) with GBM. TCGA included 195 (52%) patients with WHO Grade II glioma, 174 (46%) with Grade III glioma and 9 (2%) with Grade IV glioma. Chromosome 1p/19q co-deletion was detected in 64 (38%) patients in CGGA and 151 (40%) patients in TCGA. Meanwhile, MGMT promoter methylation was harbored in 88 (53%) patients in CGGA and 351 (93%) patients in TCGA. (MGMT promoter methylation status was not available in 53 (32%) patients in CGGA). Tumor tissue samples were obtained by surgical resection. All patients provided written informed consent, and the study was approved by the ethics committees of the participating hospitals. Survival data were collected by clinics during patient visits and/or phone interviews. Patients who underwent biopsy alone were not followed up at our center and were therefore excluded from the survival analysis.
Table 3. Baseline patient characteristics.
| CGGA(n=167,%) | TCGA(n=378,%) | ||
| Age | Median (range) | 38(10-62) | 39(14-75) |
| Gender | Male | 101(60) | 215(57) |
| Female | 66(40) | 163(43) | |
| KPS score | Preoperative KPS≥80 | 61(37) | 193(51) |
| Preoperative KPS<80 | 16(10) | 27(7) | |
| Pathological type | A | 41(25) | 116(31) |
| O | 34(20) | 154(41) | |
| OA | 56(34) | 99(26) | |
| GBM | 36(22) | 9(2) | |
| TCGA subtype | Neural | 56(34) | 77(20) |
| Proneural | 92(55) | 199(53) | |
| Mesenchymal | 4(2) | 14(4) | |
| Classical | 15(9) | 0(0) | |
| Grade | II | 94(56) | 195(52) |
| III | 37(22) | 174(46) | |
| IV | 36(22) | 9(2) | |
| 1p19q status | codeletion | 64(38) | 151(40) |
| non-codeletion | 103(62) | 226(60) | |
| NA | 0(0) | 1(0) | |
| MGMT promoter methylation | Methylated | 88(53) | 351(93) |
| Not methylated | 26(16) | 26(7) | |
| NA | 53(32) | 1(1) |
Detection of IDH1/2 mutations
In CGGA dataset, pyrosequencing technique is commonly used to detect IDH1/2 mutation [32]. And status of IDH1/2 mutation downloaded online from TCGA is mainly obtained through the method of whole exon sequencing (WES) or pyrosequencing.
Gene Set Variation Analysis (GSVA)
The GSVA technique allows sensitive identification of differences in expression of predefined sets of genes between heterogeneous groups and can be used to explore underlying pathways. For functional annotation in this study, GSVA was used to calculate the enrichment score (ES) for every patient and build gene signature based on the expression of seven genes. ES values range from −1 to 1 [33].
Statistical analysis
R, version 3.4.2 (http://www.r-project.org) is the main software environment for our statistical operation and graphics. Time-dependent ROC curve (timeROC) and Area under timeROC curve (AUC) were generated with R package “timeROC” [34]. Survival analysis and univariate and multivariate Cox regression analysis were performed with R package “survival”. Heatmap of ES related genes was drawn with R package “pheatmap”. P value ≤ 0.05 was considered to be statistically significant.
Gene Ontology (GO) Analysis of Associated Genes
Significantly related genes that were shared by CGGA and TCGA dataset (145 genes) were chosen for Gene Ontology analysis in DAVID Bioinformatics Resources 6.8 (https://david.ncifcrf.gov/) for function annotation [35].
Acknowledgements
We appreciate the generosity of TCGA network for sharing the huge amount of data.
Conflicts of Interest
The authors declare that the research was conducted in the absence of any commercial or financial relationships that could be construed as a potential conflict of interest.
Funding
This work has been supported by grants from The National Key Research and Development Plan (No. 2016YFC0902500); Beijing Science and Technology Plan (Z141100000214009); Capital Medical Development Research Fund (2016-1-1072)
References
- 1. Ostrom QT, Gittleman H, Stetson L, Virk SM, Barnholtz-Sloan JS. Epidemiology of gliomas. Cancer Treat Res. 2015; 163:1–14. https://doi.org/10.1007/978-3-319-12048-5_1 [PubMed]
- 2. Omuro A, DeAngelis LM. Glioblastoma and other malignant gliomas: a clinical review. JAMA. 2013; 310:1842–50. https://doi.org/10.1001/jama.2013.280319 [PubMed]
- 3. Louis DN, Perry A, Reifenberger G, von Deimling A, Figarella-Branger D, Cavenee WK, Ohgaki H, Wiestler OD, Kleihues P, Ellison DW. The 2016 World Health Organization Classification of Tumors of the Central Nervous System: a summary. Acta Neuropathol. 2016; 131:803–20. https://doi.org/10.1007/s00401-016-1545-1 [PubMed]
- 4. Turkalp Z, Karamchandani J, Das S. IDH mutation in glioma: new insights and promises for the future. JAMA Neurol. 2014; 71:1319–25. https://doi.org/10.1001/jamaneurol.2014.1205 [PubMed]
- 5. Brito JP, Asi N, Bancos I, Gionfriddo MR, Zeballos-Palacios CL, Leppin AL, Undavalli C, Wang Z, Domecq JP, Prustsky G, Elraiyah TA, Prokop LJ, Montori VM, Murad MH. Testing for germline mutations in sporadic pheochromocytoma/paraganglioma: a systematic review. Clin Endocrinol (Oxf). 2015; 82:338–45. https://doi.org/10.1111/cen.12530 [PubMed]
- 6. Im AP, Sehgal AR, Carroll MP, Smith BD, Tefferi A, Johnson DE, Boyiadzis M. DNMT3A and IDH mutations in acute myeloid leukemia and other myeloid malignancies: associations with prognosis and potential treatment strategies. Leukemia. 2014; 28:1774–83. https://doi.org/10.1038/leu.2014.124 [PubMed]
- 7. Saha SK, Parachoniak CA, Bardeesy N. IDH mutations in liver cell plasticity and biliary cancer. Cell Cycle. 2014; 13:3176–82. https://doi.org/10.4161/15384101.2014.965054 [PubMed]
- 8. Rakheja D, Medeiros LJ, Bevan S, Chen W. The emerging role of d-2-hydroxyglutarate as an oncometabolite in hematolymphoid and central nervous system neoplasms. Front Oncol. 2013; 3:169. https://doi.org/10.3389/fonc.2013.00169 [PubMed]
- 9. Leeper HE, Caron AA, Decker PA, Jenkins RB, Lachance DH, Giannini C. IDH mutation, 1p19q codeletion and ATRX loss in WHO grade II gliomas. Oncotarget. 2015; 6:30295–305. https://doi.org/10.18632/oncotarget.4497 [PubMed]
- 10. Kannan K, Inagaki A, Silber J, Gorovets D, Zhang J, Kastenhuber ER, Heguy A, Petrini JH, Chan TA, Huse JT. Whole-exome sequencing identifies ATRX mutation as a key molecular determinant in lower-grade glioma. Oncotarget. 2012; 3:1194–203. https://doi.org/10.18632/oncotarget.689 [PubMed]
- 11. Pekmezci M, Rice T, Molinaro AM, Walsh KM, Decker PA, Hansen H, Sicotte H, Kollmeyer TM, McCoy LS, Sarkar G, Perry A, Giannini C, Tihan T, et al. Adult infiltrating gliomas with WHO 2016 integrated diagnosis: additional prognostic roles of ATRX and TERT. Acta Neuropathol. 2017; 133:1001–16. https://doi.org/10.1007/s00401-017-1690-1 [PubMed]
- 12. Wiestler B, Capper D, Holland-Letz T, Korshunov A, von Deimling A, Pfister SM, Platten M, Weller M, Wick W. ATRX loss refines the classification of anaplastic gliomas and identifies a subgroup of IDH mutant astrocytic tumors with better prognosis. Acta Neuropathol. 2013; 126:443–51. https://doi.org/10.1007/s00401-013-1156-z [PubMed]
- 13. Tada T, Kumada T, Toyoda H, Kiriyama S, Tanikawa M, Hisanaga Y, Kanamori A, Kitabatake S, Yama T, Tanaka J. HBcrAg predicts hepatocellular carcinoma development: an analysis using time-dependent receiver operating characteristics. J Hepatol. 2016; 65:48–56. https://doi.org/10.1016/j.jhep.2016.03.013 [PubMed]
- 14. Piessevaux H, Buyse M, Schlichting M, Van Cutsem E, Bokemeyer C, Heeger S, Tejpar S. Use of early tumor shrinkage to predict long-term outcome in metastatic colorectal cancer treated with cetuximab. J Clin Oncol. 2013; 31:3764–75. https://doi.org/10.1200/JCO.2012.42.8532 [PubMed]
- 15. Mir SE, De Witt Hamer PC, Krawczyk PM, Balaj L, Claes A, Niers JM, Van Tilborg AA, Zwinderman AH, Geerts D, Kaspers GJ, Peter Vandertop W, Cloos J, Tannous BA, et al. In silico analysis of kinase expression identifies WEE1 as a gatekeeper against mitotic catastrophe in glioblastoma. Cancer Cell. 2010; 18:244–57. https://doi.org/10.1016/j.ccr.2010.08.011 [PubMed]
- 16. Hakami F, Darda L, Stafford P, Woll P, Lambert DW, Hunter KD. The roles of HOXD10 in the development and progression of head and neck squamous cell carcinoma (HNSCC). Br J Cancer. 2014; 111:807–16. https://doi.org/10.1038/bjc.2014.372 [PubMed]
- 17. Vardhini NV, Rao PJ, Murthy PB, Sudhakar G. HOXD10 expression in human breast cancer. Tumour Biol. 2014; 35:10855–60. https://doi.org/10.1007/s13277-014-2324-z [PubMed]
- 18. Wang L, Chen S, Xue M, Zhong J, Wang X, Gan L, Lam EK, Liu X, Zhang J, Zhou T, Yu J, Jin H, Si J. Homeobox D10 gene, a candidate tumor suppressor, is downregulated through promoter hypermethylation and associated with gastric carcinogenesis. Mol Med. 2012; 18:389–400. [PubMed]
- 19. Shaoqiang C, Yue Z, Yang L, Hong Z, Lina Z, Da P, Qingyuan Z. Expression of HOXD3 correlates with shorter survival in patients with invasive breast cancer. Clin Exp Metastasis. 2013; 30:155–63. https://doi.org/10.1007/s10585-012-9524-y [PubMed]
- 20. Kanai M, Hamada J, Takada M, Asano T, Murakawa K, Takahashi Y, Murai T, Tada M, Miyamoto M, Kondo S, Moriuchi T. Aberrant expressions of HOX genes in colorectal and hepatocellular carcinomas. Oncol Rep. 2010; 23:843–51. [PubMed]
- 21. Makiyama K, Hamada J, Takada M, Murakawa K, Takahashi Y, Tada M, Tamoto E, Shindo G, Matsunaga A, Teramoto K, Komuro K, Kondo S, Katoh H, et al. Aberrant expression of HOX genes in human invasive breast carcinoma. Oncol Rep. 2005; 13:673–79. [PubMed]
- 22. Chen Y, Cha Z, Fang W, Qian B, Yu W, Li W, Yu G, Gao Y. The prognostic potential and oncogenic effects of PRR11 expression in hilar cholangiocarcinoma. Oncotarget. 2015; 6:20419–33. [PubMed]
- 23. Song Z, Liu W, Xiao Y, Zhang M, Luo Y, Yuan W, Xu Y, Yu G, Hu Y. PRR11 is a prognostic marker and potential oncogene in patients with gastric cancer. PLoS One. 2015; 10:e0128943. https://doi.org/10.1371/journal.pone.0128943 [PubMed]
- 24. Zhao Q. RNAi-mediated silencing of praline-rich gene causes growth reduction in human lung cancer cells. Int J Clin Exp Pathol. 2015; 8:1760–67. [PubMed]
- 25. Myrthue A, Rademacher BL, Pittsenbarger J, Kutyba-Brooks B, Gantner M, Qian DZ, Beer TM. The iroquois homeobox gene 5 is regulated by 1,25-dihydroxyvitamin D3 in human prostate cancer and regulates apoptosis and the cell cycle in LNCaP prostate cancer cells. Clin Cancer Res. 2008; 14:3562–70. https://doi.org/10.1158/1078-0432.CCR-07-4649 [PubMed]
- 26. Bhatlekar S, Fields JZ, Boman BM. HOX genes and their role in the development of human cancers. J Mol Med (Berl). 2014; 92:811–23. https://doi.org/10.1007/s00109-014-1181-y [PubMed]
- 27. Guo YB, Shao YM, Chen J, Xu SB, Zhang XD, Wang MR, Liu HY. Effect of overexpression of HOX genes on its invasive tendency in cerebral glioma. Oncol Lett. 2016; 11:75–80. https://doi.org/10.3892/ol.2015.3893 [PubMed]
- 28. Duan R, Han L, Wang Q, Wei J, Chen L, Zhang J, Kang C, Wang L. HOXA13 is a potential GBM diagnostic marker and promotes glioma invasion by activating the Wnt and TGF-β pathways. Oncotarget. 2015; 6:27778–93. https://doi.org/10.18632/oncotarget.4813 [PubMed]
- 29. Tabuse M, Ohta S, Ohashi Y, Fukaya R, Misawa A, Yoshida K, Kawase T, Saya H, Thirant C, Chneiweiss H, Matsuzaki Y, Okano H, Kawakami Y, Toda M. Functional analysis of HOXD9 in human gliomas and glioma cancer stem cells. Mol Cancer. 2011; 10:60. https://doi.org/10.1186/1476-4598-10-60 [PubMed]
- 30. Buccoliero AM, Castiglione F, Rossi Degl’Innocenti D, Ammanati F, Giordano F, Sanzo M, Mussa F, Genitori L, Taddei GL. Hox-D genes expression in pediatric low-grade gliomas: real-time-PCR study. Cell Mol Neurobiol. 2009; 29:1–6. https://doi.org/10.1007/s10571-008-9282-1 [PubMed]
- 31. Costa BM, Smith JS, Chen Y, Chen J, Phillips HS, Aldape KD, Zardo G, Nigro J, James CD, Fridlyand J, Reis RM, Costello JF. Reversing HOXA9 oncogene activation by PI3K inhibition: epigenetic mechanism and prognostic significance in human glioblastoma. Cancer Res. 2010; 70:453–62. https://doi.org/10.1158/0008-5472.CAN-09-2189 [PubMed]
- 32. Yan W, Zhang W, You G, Bao Z, Wang Y, Liu Y, Kang C, You Y, Wang L, Jiang T. Correlation of IDH1 mutation with clinicopathologic factors and prognosis in primary glioblastoma: a report of 118 patients from China. PLoS One. 2012; 7:e30339. https://doi.org/10.1371/journal.pone.0030339 [PubMed]
- 33. Hänzelmann S, Castelo R, Guinney J. GSVA: gene set variation analysis for microarray and RNA-seq data. BMC Bioinformatics. 2013; 14:7. https://doi.org/10.1186/1471-2105-14-7 [PubMed]
- 34. Blanche P, Dartigues JF, Jacqmin-Gadda H. Estimating and comparing time-dependent areas under receiver operating characteristic curves for censored event times with competing risks. Stat Med. 2013; 32:5381–97. https://doi.org/10.1002/sim.5958 [PubMed]
- 35. Huang W, Sherman BT, Lempicki RA. Systematic and integrative analysis of large gene lists using DAVID bioinformatics resources. Nat Protoc. 2009; 4:44–57. https://doi.org/10.1038/nprot.2008.211 [PubMed]