Prognostic value of immune checkpoint molecules in head and neck cancer: a meta-analysis
Abstract
Immune checkpoint molecules are important targets in cancer immunotherapy, but their association with prognosis in patients with head and neck cancer is controversial. In this meta-analysis, we searched for 12 immune checkpoint molecules in the PubMed, Embase and Cochrane Library databases and retrieved 52 studies with 7127 participants. Among the molecules included in the search, indoleamine 2, 3-dioxygenase (IDO), programmed death ligand 1 (PD-L1), and programmed death 1 (PD-1) met the inclusion criteria for further analysis. Higher expression of IDO was associated with poorer overall survival in head and neck cancer patients (P = 0.011), but higher expression of PD-L1 correlated with better overall survival specifically in nasopharyngeal carcinoma patients (P = 0.01). In a sensitivity analysis, higher PD-L1 expression correlated with better progression-free survival (P = 0.043), and was associated with better overall survival in Caucasian subjects (P = 0.02), nasopharyngeal carcinoma patients (P = 0.015), and studies with small sample sizes (P = 0.001). PD-1 had no prognostic significance. There was no publication bias affecting the results. Thus, among the immune checkpoint molecules, IDO and PD-L1 are potential prognostic predictors in head and neck cancer.
Introduction
Head and neck cancer (HNC) is the sixth most common malignancy worldwide [1]. Most patients exhibit advanced-stage disease, including regional lymph node involvement, and 10% of patients have distant metastases [2]. The traditional treatment options for HNC are surgery, radiotherapy and chemotherapy [3], which have severe adverse effects. Furthermore, some patients do not benefit much from these treatments, and are likely to relapse. Anatomic complexities often lead to malfunctions in speaking, swallowing and breathing after treatments, hampering patients’ long-term quality of life [4]. Although there have been certain advances in treatment, the overall survival of HNC patients is still unsatisfactory, and the five-year survival rate is less than 50% [5–7].
Immunosuppressive patients are prone to suffer from HNC [8], although the predominant causes of HNC are tobacco and alcohol consumption [4] and viral infections [9,10]. Among the functions of the immune cells, immune checkpoint activity has been reported to be involved in the surveillance of tumor development and progression [11]. Immune checkpoint molecules including programmed death 1 (PD-1) [12,13], indoleamine 2, 3-dioxygenase (IDO) [14,15], B7-H3 [16,17], lymphocyte activation gene 3 (LAG-3) [18], cytotoxic T-lymphocyte-associated protein 4 (CTLA-4) [19], programmed death ligand 2 (PD-L2) [20], V-domain Ig suppressor of T cell activation (VISTA) [21], B7-H4 [22] and programmed death ligand 1 (PD-L1) [23–25] have been used as markers to evaluate the prognosis of HNC. However, the survival rates of patients with high expression of immune checkpoint molecules have differed according to the overexpressed molecule.
In the present study, we performed a systematic review of the available literature on this topic in PubMed, Embase and the Cochrane Library. Then, we conducted a meta-analysis of the survival rates (including overall survival [OS], disease-free survival [DFS], progression-free survival [PFS], disease-specific survival [DSS] and distant metastases-free survival [DMFS]) of patients expressing different levels of immune checkpoint molecules.
Results
Study characteristics
The characteristics of the included studies are shown in Table 1. There were 52 prospective studies comparing contemporary series of patients (level of evidence: 3b) in 51 articles. These studies included 7127 patients and met the criteria for meta-analysis. The literature selection procedure is presented in Figure 1. The included articles were evaluated by the Newcastle–Ottawa Scale (NOS; Supplementary Table 1), and all the articles were published between 2010 and 2018. Roughly half of the studies were conducted in Asia (n=23), while the remainder were conducted in Europe (n=18), North and South America (n=6), Oceania (n=4) and Africa (n=1). Thus, the samples included in this meta-analysis covered most of the continents of the world. In terms of the immune checkpoint molecules, the majority of the studies evaluated PD-L1 (n=40), while the rest assessed PD-1 (n=8) and IDO (n=4). The sample sizes of the included studies ranged from 38 to 517. With reference to the mean value of all the samples, 17 studies were considered to have a large sample size (n > 139), while 35 had a small sample size (n ≤ 139). Forty-three studies explored the prognostic value of their chosen immune checkpoint molecule for OS, 19 for DFS, 6 for PFS, 5 for DSS and 3 for DMFS.
Table 1. Characteristics of included studies.
| Author and year | Target | Country /
Region | Ethnicity | Tumor location | Sample size | Gender M/F | Cut-off value | Detection method | TNM stage | Outcome | HR estimation | Study design | NOS score |
| Ahn et al. 2017 [23] | PD-L1 | Korea | Asian | OSCC | 68 | 45/23 | Grade > 1 | IHC | I-IV | OS DFS | reported | P | 7 |
| Badoual et al. 2013 [12] | PD-1 | France | Caucasian | HNSCC | 64 | NA | > median | IF | I-IV | OS | reported | P | 6 |
| Balempas et al. 2017 [36] | PD-L1 | Germany | Caucasian | HNSCC | 161 | 131/30 | > 5% | IHC | I-IV | OS DMFS | reported | P | 7 |
| Ben-Haj-Ayed et al. 2016 [14] | IDO | Tunisia | Caucasian | NPC | 71 | 48/23 | > median | IHC | I-IV | OS DFS | reported | P | 7 |
| Birtalan et al. 2017 [24] | PD-L1 | Hungary | Caucasian | HNSCC | 106 | 90/16 | Score > 0% | IHC | I-IV | DSS | reported | P | 6 |
| Budczies et al. 2016 [25] | PD-L1 | Germany | Caucasian | HNSCC | 517 | NA | > median | qRT-PCR | NA | OS DFS | reported | P | 5 |
| Chan et al. 2017 [46] | PD-L1 | USA | Caucasian | NPC | 161 | 117/44 | ≥ 1% | IHC | I-IV | OS PFS | reported | P | 6 |
| Chang et al. 2017 [47] | PD-L1 | Philippines | Asian | NPC | 56 | 43/13 | > 1% | IHC | I-IV | OS | reported | P | 5 |
| Chen et al. 2015 [48] | PD-L1 | Taiwan | Asian | OSCC | 218 | 145/73 | > 5% | IHC | I-IV | OS | reported | P | 7 |
| Chen et al. 2017 [49] | PD-L1 | China | Asian | HNSCC | 496 | NA | > 5% | qRT-PCR | I-IV | OS | reported | P | 7 |
| Cho et al. 2011 [50] | PD-L1 | Korea | Asian | OSCC | 45 | 32/13 | Grade > 1 | IHC | I-IV | OS | estimated | P | 6 |
| De Meulenaere et al. 2017 [51] | PD-L1 | Belgium | Caucasian | OSCC | 99 | 82/17 | > 1% | IHC | I-IV | OS DFS | reported | P | 6 |
| Fang et al. 2014 [52] | PD-L1 | China | Asian | NPC | 139 | 113/26 | > 35% | IHC | I-IV | DFS | estimated | P | 6 |
| Feng et al. 2017 [53] | PD-L1 | USA | Caucasian | OSCC | 119 | 74/45 | < 30 μm | IHC | I-IV | OS | estimated | P | 6 |
| Fiedler et al. 2018 [54] | PD-L1 | Germany | Caucasian | HNSCC | 82 | 73/9 | > 5% | IHC | I-IV | OS | reported | P | 7 |
| Hanna et al. 2018 [37] | PD-L1 | USA | Caucasian | OSCC | 81 | 49/32 | > 10% | IHC | I-IV | OS | reported | P | 7 |
| Hong et al. 2016 [55] | PD-L1 | Australia | Caucasian | OSCC | 99 | 79/20 | > 25% | IHC | I-IV | OS | reported | P | 6 |
| Hsu et al. 2010 [13] | PD-1 | Taiwan | Asian | NPC | 46 | 39/7 | > median | IHC | NA | OS DFS | reported | P | 4 |
| Kansy et al. 2017 [56] | PD-1 | Germany | Caucasian | HNSCC | 56 | NA | NA | FACS | I-IV | DFS | reported | P | 6 |
| Kim et al. 2016 [57] | PD-1 | Korea | Asian | HNSCC | 402 | 302/100 | > 5% | IHC | I-IV | OS DFS | reported | P | 6 |
| Kim et al. 2016 [58] | PD-1 | Korea | Asian | OSCC | 133 | 120/13 | > 5% | IHC | I-IV | OS | reported | P | 7 |
| Kogashiwa et al. 2017 [35] | PD-L1 | Japan | Asian | OSCC | 84 | 57/27 | > 5% | IHC | I-IV | OS PFS | reported | P | 7 |
| Laimer et al. 2011 [15] | IDO | Austria | Caucasian | OSCC | 88 | 67/21 | > 4 | IHC | I-IV | OS | reported | P | 7 |
| Larbcharoensub et al. 2018 [59] | PD-L1 | Thailand | Asian | NPC | 114 | 77/67 | ≥ 5% | IHC | I-IV | OS | estimated | P | 7 |
| Lee et al. 2016 [60] | PD-L1 | Hong Kong | Asian | NPC | 104 | 85/19 | > 1 | IHC | I-IV | PFS DMFS OS | reported | P | 5 |
| Li et al. 2017 [61] | PD-L1 | China | Asian | NPC | 62 | 40/14 | > 20% | IHC | I-IV | DFS | reported | P | 5 |
| Lin et al. 2015 [30] | PD-L1 | Taiwan | Asian | OSCC | 305 | 236/69 | > 1 | IHC | I-IV | OS | reported | P | 6 |
| Muller et al. 2017 [62] | PD-L1 | Germany | Caucasian | HNSCC | 293 | 82/16 142/53 (224/69) | Score ≥ 1 | IHC | I-IV | OS | reported | P | 6 |
| Ock et al. 2016 [63] | PD-L1 | South Korea | Asian | HNSCC | 141 | 40/10 61/30 (101/40) | ≥ 5% | IHC | I-IV | OS | reported | P | 6 |
| Oguejiofor et al. 2017 [64] | PD-L1 | UK | Caucasian | OPSCC | 124 | NA | > 5% | IHC | I-IV | OS | reported | P | 7 |
| Oliveira-Costa et al. 2015 [65] | PD-L1 | Brazil | Caucasian | OSCC | 142 | 125/17 | ≥ 5% | IHC | I-III | DSS | reported | P | 6 |
| Ono et al. 2017 [66] | PD-L1 | Japan | Asian | HPSCC | 83 | 79/4 | ≥ 1% | IHC | III-IV | OS PFS | reported | P | 6 |
| Ono et al. 2018 [67] | PD-L1 | Japan | Asian | NPC | 66 | 54/12 | ≥ 5% | IHC | I-IV | OS PFS | reported | P | 7 |
| Ou et al. 2017 [68] | PD-L1 | France | Caucasian | HNSCC | 38 | NA | ≥ 1% | IHC | III-IV | OS PFS | estimated | P | 7 |
| Qu et al. 2018 [69] | PD-L1 | China | Asian | NPC | 96 | 72/24 | > 10% | IHC | I-IV | DMFS | estimated | P | 6 |
| Riobello et al. 2018 [70] | PD-L1 | Spain | Caucasian | SSCC | 53 | 37/16 | ≥ 5% | IHC | I-IV | OS DFS DSS | reported | P | 5 |
| Roper et al. 2017 [71] | PD-L1 | Australia | Caucasian | HNSCC | 74 | 64/10 | > 5% | IHC | NA | DFS | reported | P | 6 |
| Satgunaseelan et al. 2016 [72] | PD-L1 | Australia | Caucasian | OSCC | 217 | 130/87 | Score ≥ 1 | IHC | NA | DSS | estimated | P | 6 |
| Schneider et al. 2018 [73] | PD-1 PD-L1 | Austria | Caucasian | HNSCC | 129 | 97/28 | > 5% | IHC | I-IV | OS DFS | reported | P | 7 |
| Seppälä et al. 2016 [74] | IDO | Finland | Caucasian | OSCC | 58 | 29/29 | > 0 | IHC | I-III | OS | reported | P | 6 |
| Solomon et al. 2018 [75] | PD-L1 | Australia | Caucasian | OSCC | 190 | 157/33 | ≥ 5% | IHC | I-IV | OS | reported | P | 7 |
| Steuer et al. 2018 [76] | PD-1 | USA | Caucasian | OPSCC | 97 | 81/16 | Score > 1 | IHC | I-IV | OS | reported | P | 7 |
| Strati et al. 2017 [77] | PD-L1 | Greece | Caucasian | HNSCC | 113 | 75/19 | NA | qRT-PCR | I-IV | OS PFS | reported | P | 5 |
| Straub et al. 2016 [78] | PD-L1 | Germany | Caucasian | OSCC | 80 | 54/26 | > 5% | IHC FISH | I-IV | OS DFS | estimated | P | 7 |
| Tang et al. 2017 [79] | PD-1 | China | Asian | NPC | 96 | NA | NA | IHC | NA | OS | estimated | P | 6 |
| Ukpo et al. 2013 [80] | PD-L1 | USA | Caucasian | OPSCC | 181 | 162/19 | > 5% | IHC | I-IV | OS DFS DSS | reported | P | 7 |
| Vassilakopoulou et al. 2016 [81] | PD-L1 | Greece | Caucasian | LSCC | 260 | 249/11 | > 59th percentile of AQUA score | IHC | I-IV | OS DFS | reported | P | 7 |
| Ye et al. 2013 [82] | IDO | China | Asian | LSCC | 187 | 179/8 | NA | IHC | I-IV | OS DFS | reported | P | 6 |
| Zhang et al. 2015 [83] | PD-1 PD-L1 | China | Asian | NPC | 139 | 113/26 | H-score PD-1 > 0 PD-L1 > 35 | IHC | I-IV | DFS | estimated | P | 7 |
| Zheng et al. 2017 [84] | PD-L1 | China | Asian | NPC | 85 | 63/22 | Score > 2 | IHC | I-IV | OS | estimated | P | 6 |
| Zhu et al. 2017 [38] | PD-L1 | China | Asian | NPC | 209 | 150/59 | ≥ 5% | IHC | I-IV | OS DFS | reported | P | 7 |
| PD-L1: programmed death ligand 1; PD-1: programmed death 1; IDO: indoleamine 2, 3-dioxygenase; M/F: male/female; NA: not available; OSCC: oral squamous cell carcinoma; HNSCC: head and neck squamous cell carcinoma; NPC: nasopharyngeal carcinoma; OPSCC: oropharyngeal squamous cell carcinoma; HPSCC: hypopharyngeal squamous cell carcinoma; SSCC: sinonasal squamous cell carcinoma; LSCC: laryngeal squamous cell carcinoma; cut-off value: the value that can be diagnosed as positive/high expression of an immune checkpoint molecule; AQUA: automated quantitative analysis; IHC: immunohistochemistry; IF: immunofluorescence; qRT-PCR: quantitative reverse transcription polymerase chain reaction; FACS: fluorescence-activated cell sorting; FISH: fluorescence in situ hybridization; OS: overall survival; DFS: disease-free survival; DMFS: distant metastases-free survival; DSS: disease-specific survival; PFS: progression-free survival; P: prospective; NOS: Newcastle–Ottawa Quality Assessment Scale. |
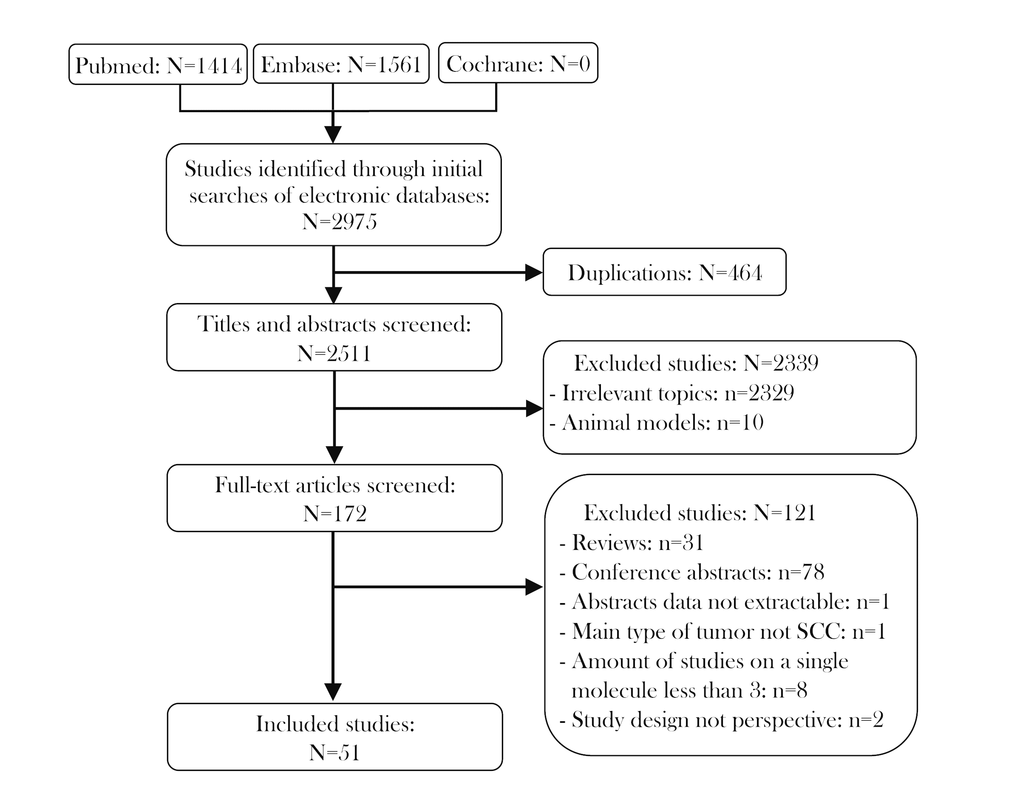
Figure 1. Flow diagram of studies identified, included and excluded.
Methodological quality of the included studies
The quality of the included studies was generally high. Most of the studies mentioned the length of the follow-up period, and the majority provided adequate follow-up data for more than five years. Nevertheless, almost none of the prospective studies had an exposed cohort that sufficiently represented the general characteristics of the population in the community, as this factor was not considered in the study design. None of the studies were designed with adequate comparability of cohorts, due to their failure to match exposed and non-exposed individuals and/or adjust for confounders. Methods for handling missing data and intention-to-treat analysis were not adequately described in the majority of the studies.
Immune checkpoint molecule expression and prognosis of HNC patients
Forty-three studies with 6225 patients reported the relationship between OS and at least one of the three immune checkpoint molecules in HNC. The expression of these molecules was detected mainly at the protein level, except for three studies that evaluated PD-L1 mRNA levels. Overexpression was defined based on cut-off criteria that differed among the studies (as presented in Table 1). When the data for all three immune checkpoint molecules were pooled, there was no significant relationship between the overexpression of these molecules and OS (hazard ratio [HR] = 0.964; 95% confidence interval [CI]: 0.791-1.175, P = 0.714; Table 2), and there was obvious overall heterogeneity (I2 = 74.8%, Ph < 0.001; Figure 2). Similar results were obtained for DFS, PFS, DSS and DMFS.
Table 2. Results of the meta-analysis on the prognostic effects of immune checkpoint molecules in HNC patients.
| Variable | Study no. | Sample size | HR (95% CI) | P value | Heterogeneity |
| I2 | P value |
| OS | Overall | 43 | 6225 | 0.964 (0.791-1.175) | 0.714 | 74.8% | <0.001 |
| Immune checkpoint molecules |
| PD-L1 | 32 | 4854 | 0.874 (0.711-1.073) | 0.197 | 72.8% | <0.001 |
| PD-1 | 7 | 967 | 0.926 (0.424-2.025) | 0.848 | 76.7% | <0.001 |
| IDO | 4 | 404 | 2.197 (1.199-4.023) | 0.011 | 59.8% | 0.059 |
| Ethnicity |
| Asian | 19 | 2938 | 0.923 (0.651-1.307) | 0.650 | 77.1% | <0.001 |
| Caucasian | 24 | 3287 | 0.995 (0.779-1.270) | 0.965 | 73.8% | <0.001 |
| Tumor location |
| OSCC | 13 | 1477 | 0.879 (0.586-1.317) | 0.532 | 85.0% | <0.001 |
| NPC | 10 | 1008 | 0.862 (0.618-1.203) | 0.383 | 33.7% | 0.139 |
| OPSCC | 4 | 592 | 0.878 (0.532-1.450) | 0.611 | 47.1% | 0.129 |
| HPSCC | 1 | 83 | 1.300 (0.700-2.415) | 0.407 | - | - |
| SSCC | 1 | 53 | 1.355 (0.739-2.485) | 0.326 | - | - |
| LSCC | 2 | 447 | 1.517 (0.252-9.126) | 0.649 | 91.4% | 0.001 |
| Sample size |
| Large | 14 | 3721 | 1.044 (0.803-1.356) | 0.748 | 74.0% | <0.001 |
| Small | 29 | 2504 | 0.915 (0.687-1.220) | 0.546 | 74.3% | <0.001 |
| DFS | Overall | 19 | 2901 | 1.097 (0.733-1.642) | 0.652 | 92.5% | <0.001 |
| Inhibitory immune checkpoint molecules |
| PD-L1 | 13 | 2010 | 0.874 (0.523-1.459) | 0.606 | 94.1% | <0.001 |
| IDO | 2 | 258 | 1.725 (0.611-4.869) | 0.303 | 59.5% | 0.116 |
| PD-1 | 4 | 633 | 1.931 (0.716-5.211) | 0.194 | 87.5% | <0.001 |
| Ethnicity |
| Asian | 8 | 1252 | 1.131 (0.506-2.533) | 0.764 | 93.6% | <0.001 |
| Caucasian | 11 | 1649 | 1.060 (0.760-1.479) | 0.731 | 73.9% | <0.001 |
| Tumor location |
| OSCC | 3 | 247 | 0.609 (0.208-1.788) | 0.367 | 70.8% | 0.033 |
| NPC | 6 | 666 | 1.339 (0.581-3.085) | 0.494 | 92.5% | <0.001 |
| SSCC | 1 | 53 | 1.834 (0.955-3.522) | 0.068 | - | - |
| OPSCC | 1 | 181 | 1.090 (0.783-1.518) | 0.610 | - | - |
| LSCC | 2 | 447 | 1.282 (0.242-6.783) | 0.770 | 85.9% | 0.008 |
| Sample size |
| Large | 6 | 1756 | 0.844 (0.595-1.198) | 0.343 | 75.5% | <0.001 |
| Small | 13 | 1145 | 1.225 (0.764-1.963) | 0.399 | 88.9% | <0.001 |
| PFS | Overall | 6 | 545 | 0.996 (0.585-1.685) | 0.989 | 68.5% | 0.007 |
| Inhibitory immune checkpoint molecules |
| PD-L1 | 6 | 545 | 0.891 (0.565-1.404) | 0.989 | 68.5% | 0.007 |
| Ethnicity |
| Asian | 3 | 233 | 0.846 (0.492-1.455) | 0.744 | 48.3% | 0.144 |
| Caucasian | 3 | 312 | 1.218 (0.372-3.993) | 0.546 | 82.7% | 0.003 |
| Tumor location |
| NPC | 2 | 227 | 0.762 (0.506-1.149) | 0.195 | 0.0% | 0.935 |
| OSCC | 1 | 84 | 0.576 (0.308-1.076) | 0.084 | - | - |
| HPSCC | 1 | 83 | 1.350 (0.740-2.463) | 0.328 | - | - |
| Sample size |
| Large | 1 | 161 | 0.770 (0.480-1.235) | 0.279 | - | - |
| Small | 5 | 384 | 1.067 (0.536-2.125) | 0.853 | 73.0% | 0.005 |
| DSS | Overall | 5 | 699 | 0.779 (0.330-1.839) | 0.569 | 84.7% | <0.001 |
| DMFS | Overall | 3 | 361 | 0.599 (0.346-1.035) | 0.066 | 0.0% | 0.604 |
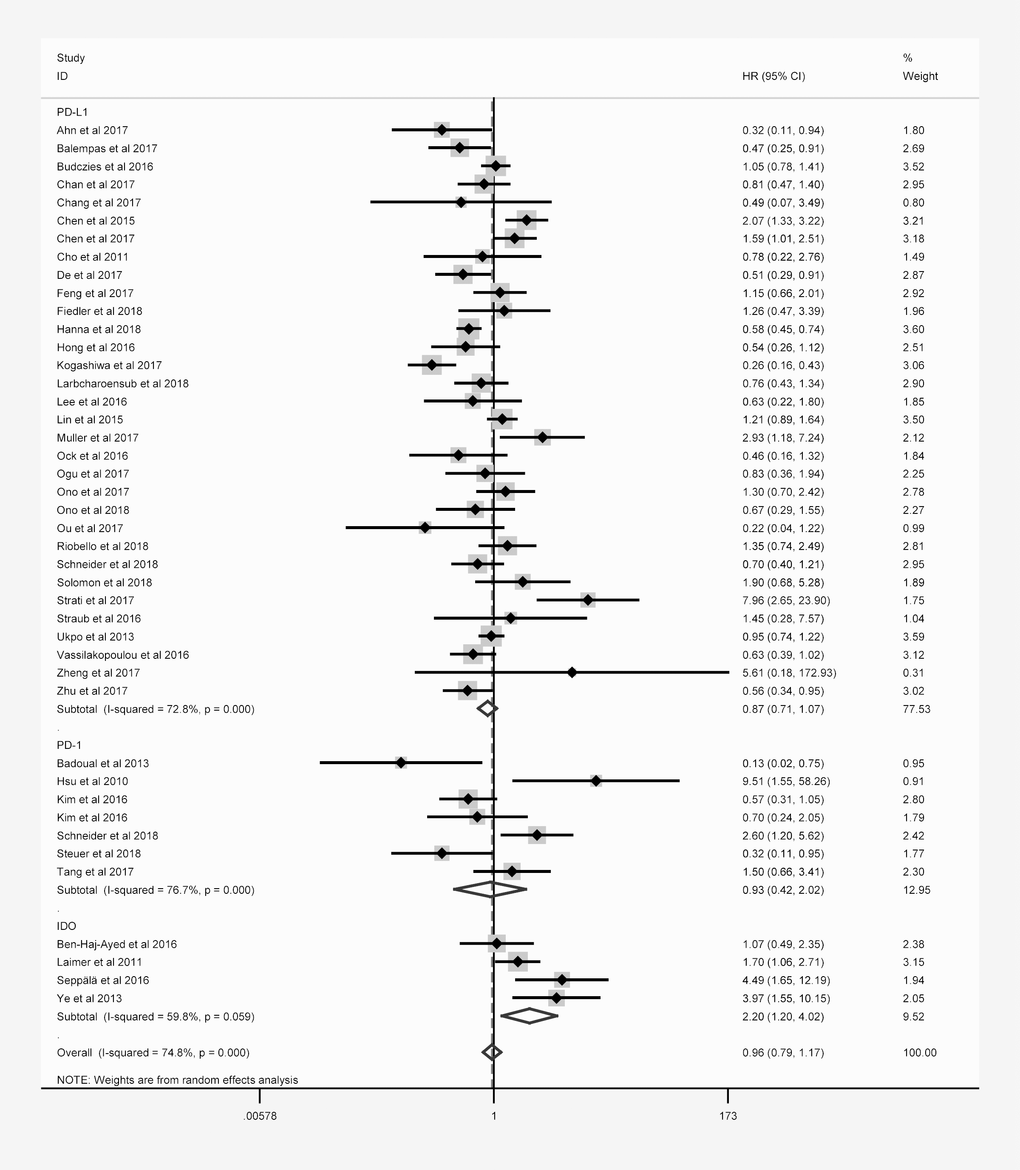
Figure 2. Overall forest plot of stratified analysis based on the type of molecule for the association of immune checkpoint molecules with OS.
Subgroup analyses
Subgroup analyses stratified according to the immune checkpoint molecule, patient ethnicity, tumor location and sample size were performed to detect potential sources of heterogeneity. In the stratification based on the immune checkpoint molecule (Figure 2), poorer OS was consistently found in patients with higher levels of IDO (Table 2), correlating with a poorer prognosis (HR = 2.197, 95% CI: 1.199-4.023, P = 0.011, Figure 2). However, no obvious trend in DFS was found according to IDO expression (Table 2).
The same hierarchical strategy was used to evaluate the studies of PD-L1 (Table 3). Among the immune checkpoint molecules, PD-L1 was the focus of the largest percentage of studies, as 32 studies with 4854 patients reported the relationship between PD-L1 expression and OS (Figure 3). There was a possible trend for a better prognosis in patients overexpressing PD-L1 (HR = 0.874; 95% CI: 0.711-1.073, P = 0.197).
Table 3. Results of the meta-analysis on the prognostic effects of PD-L1 in HNC patients.
| Variable | Study no. | Sample size | HR (95% CI) | P value | Heterogeneity |
| I2 | P value |
| OS | Overall | 32 | 4854 | 0.874 (0.711-1.073) | 0.197 | 72.8% | <0.001 |
| Ethnicity |
| Asian | 14 | 2074 | 0.792 (0.537-1.168) | 0.240 | 78% | <0.001 |
| Caucasian | 18 | 2780 | 0.91 (0.716-1.158) | 0.444 | 68.2% | <0.001 |
| Tumor location |
| OSCC | 10 | 1198 | 0.726 (0.470-1.121) | 0.148 | 84.7% | <0.001 |
| NPC | 7 | 795 | 0.692 (0.523-0.915) | 0.01 | 0.0% | 0.855 |
| OPSCC | 3 | 495 | 0.975 (0.771-1.234) | 0.835 | 0.0% | 0.403 |
| HPSCC | 1 | 83 | 1.300 (0.700-2.415) | 0.407 | - | - |
| SSCC | 1 | 53 | 1.355 (0.739-2.485) | 0.326 | - | - |
| LSCC | 1 | 260 | 0.635 (0.393-1.025) | 0.063 | - | - |
| Sample size |
| Large | 12 | 3132 | 1.022 (0.790-1.321) | 0.87 | 71.4% | <0.001 |
| Small | 20 | 1722 | 0.77 (0.575-1.031) | 0.08 | 66.6% | <0.001 |
| DFS | Overall | 13 | 2011 | 0.874 (0.523-1.465) | 0.607 | 93.9% | <0.001 |
| Ethnicity |
| Asian | 5 | 617 | 0.824 (0.290-2.338) | 0.716 | 94.2% | <0.001 |
| Caucasian | 8 | 1394 | 0.883 (0.638-1.221) | 0.451 | 62.4% | 0.009 |
| Tumor location |
| OSCC | 3 | 247 | 0.610 (0.208-1.793) | 0.369 | 70.5% | 0.034 |
| NPC | 4 | 549 | 1.042 (0.349-3.111) | 0.941 | 94.9% | <0.001 |
| SSCC | 1 | 53 | 1.834 (0.955-3.522) | 0.068 | - | - |
| OPSCC | 1 | 181 | 1.090 (0.783-1.518) | 0.610 | - | - |
| LSCC | 1 | 260 | 0.591 (0.350-0.997) | 0.048 | - | - |
| Sample size |
| Large | 4 | 1167 | 0.829 (0.597-1.151) | 0.263 | 57.5% | 0.07 |
| Small | 9 | 844 | 0.900 (0.454-1.785) | 0.762 | 91.7% | <0.001 |
| PFS | Overall | 7 | 630 | 0.996 (0.632-1.569) | 0.986 | 62.1% | 0.015 |
| Ethnicity |
| Asian | 4 | 318 | 0.879 (0.585-1.321) | 0.534 | 24.2% | 0.266 |
| Caucasian | 3 | 312 | 1.219 (0.372-3.997) | 0.744 | 82.6% | 0.003 |
| Tumor location |
| OSCC | 2 | 169 | 0.706 (0.416-1.197) | 0.196 | 7.8% | 0.298 |
| HPSCC | 1 | 83 | 1.350 (0.737-2.473) | 0.331 | - | - |
| NPC | 2 | 227 | 0.762 (0.503-1.154) | 0.200 | 0.0% | 0.935 |
| Sample size |
| Large | 1 | 161 | 0.770 (0.476-1.246) | 0.287 | - | <0.001 |
| Small | 6 | 469 | 1.058 (0.600-1.876) | 0.845 | 66.2% | 0.011 |
| DSS | Overall | 5 | 699 | 0.779 (0.330-1.839) | 0.569 | 84.7% | <0.001 |
| DMFS | Overall | 3 | 361 | 0.599 (0.346-1.035) | 0.066 | 0.0% | 0.604 |
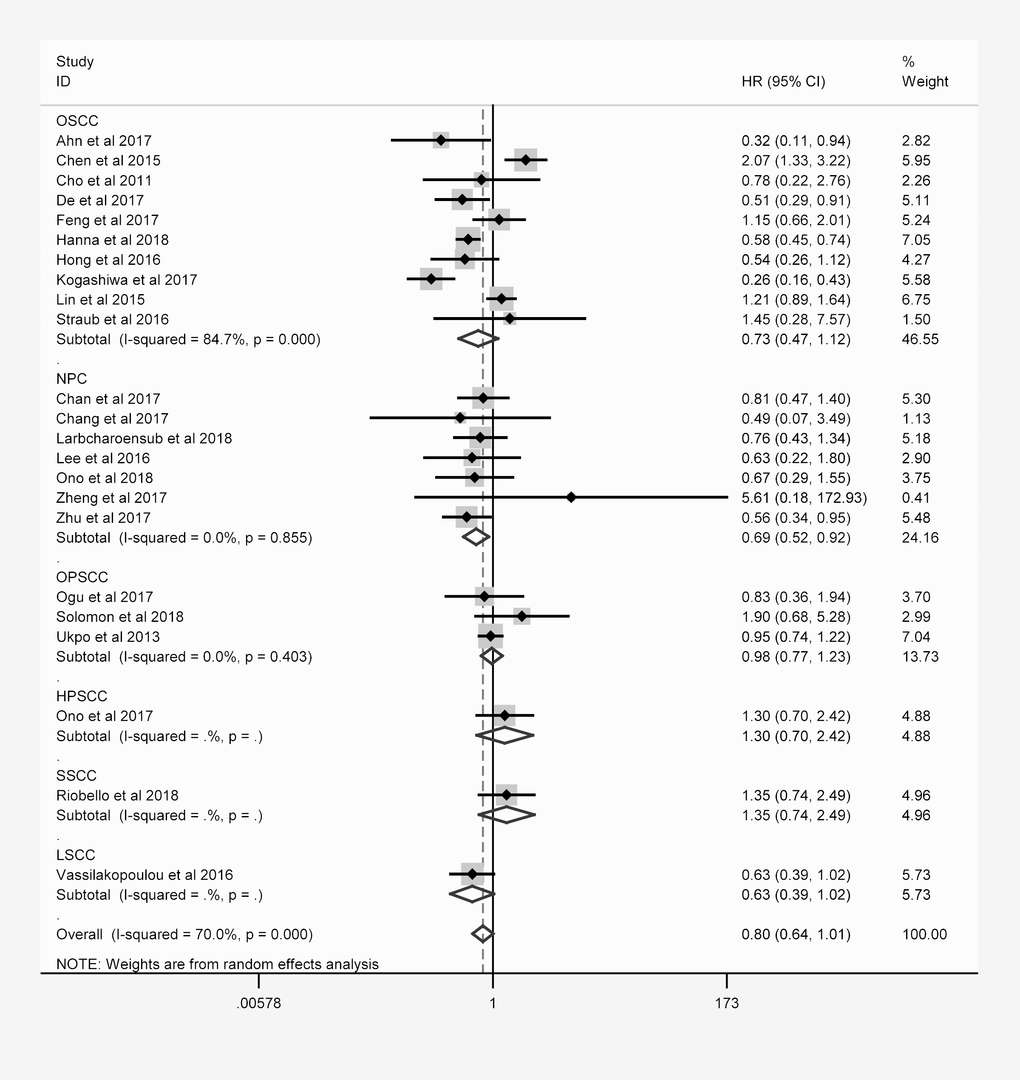
Figure 3. Overall forest plot of stratified analysis based on the tumor location for the association between PD-L1 and OS.
In nasopharyngeal carcinoma (NPC) patients, the OS was better for those expressing higher levels of PD-L1 (HR = 0.692, 95% CI: 0.523-0.915, P = 0.010). However, no obvious trend in DFS, PFS, DSS or DMFS was found according to PD-L1 expression. In laryngeal squamous cell carcinoma patients, higher PD-L1 expression was associated with better DFS (HR = 0.591, 95% CI: 0.350-0.997, P = 0.048).
Sensitivity analysis and publication bias
A sensitivity analysis of the association between the expression of PD-L1 and the prognosis of HNC patients was performed for high-quality studies (NOS score ≥ 7, Table 4). The overall HRs and 95% CIs followed the same trends as those in the previous analysis. Higher levels of PD-L1 exhibited a trend of correlation with better OS (HR = 0.754, 95% CI: 0.568-1.002, P = 0.051, Figure 4A) and were associated with better PFS (HR = 0.618, 95% CI: 0.388-0.985, P = 0.043, Figure 4B) in the high-quality studies. As in the previous analysis, the OS of NPC patients was better in the high-PD-L1 group (HR = 0.649, 95% CI: 0.458-0.920, P = 0.015, Figure 4A). The heterogeneity among the studies decreased slightly for OS, but it remained statistically significant (I2 = 76.6%, Ph < 0.001; Table 4). In addition, subgroup analyses revealed that higher PD-L1 levels were associated with better OS in Caucasian patients (HR = 0.742, 95% CI: 0.578-0.954, P = 0.020) and in studies with small sample sizes (HR = 0.582, 95% CI: 0.426-0.796, P < 0.001, Table 4).
Table 4. Sensitivity analysis results for high-quality studies on the prognostic effects of PD-L1 in HNC patients.
| Variable | Study no. | Sample size | HR (95% CI) | P value | Heterogeneity |
| I2 | P value |
| OS | Overall | 17 | 2581 | 0.754 (0.568-1.002) | 0.051 | 76.6% | <0.001 |
| Ethnicity |
| Asian | 7 | 1255 | 0.720 (0.385-1.348) | 0.305 | 88.1% | <0.001 |
| Caucasian | 10 | 1326 | 0.742 (0.578-0.954) | 0.020 | 46.1% | 0.054 |
| Tumor location |
| OSCC | 5 | 531 | 0.653 (0.292-1.462) | 0.300 | 90.7% | <0.001 |
| NPC | 3 | 389 | 0.649 (0.458-0.920) | 0.015 | 0.0% | 0.744 |
| OPSCC | 3 | 495 | 0.975 (0.771-1.234) | 0.835 | 0.0% | 0.403 |
| LSCC | 1 | 260 | 0.635 (0.393-1.025) | 0.063 | - | - |
| Sample size |
| Large | 7 | 1715 | 0.984 (0.659-1.468) | 0.936 | 79.5% | <0.001 |
| Small | 10 | 866 | 0.582 (0.426-0.796) | 0.001 | 50.3% | 0.034 |
| DFS | Overall | 7 | 1066 | 0.928 (0.618-1.392) | 0.717 | 69.4% | 0.003 |
| Ethnicity |
| Asian | 3 | 416 | 0.809 (0.241-2.720) | 0.732 | 85.8% | 0.001 |
| Caucasian | 4 | 650 | 0.938 (0.663-1.328) | 0.719 | 43.6% | 0.150 |
| Tumor location |
| OSCC | 2 | 148 | 0.699 (0.114-4.263) | 0.697 | 78.4% | 0.032 |
| NPC | 2 | 348 | 1.215 (0.288-5.133) | 0.791 | 91.0% | 0.001 |
| OPSCC | 1 | 181 | 1.090 (0.783-1.518) | 0.610 | - | - |
| LSCC | 1 | 260 | 0.591 (0.351-0.996) | 0.048 | - | - |
| Sample size |
| Large | 3 | 650 | 0.753 (0.485-1.171) | 0.208 | 66.8% | 0.049 |
| Small | 4 | 416 | 1.146 (0.536-2.450) | 0.725 | 71.0% | 0.016 |
| PFS | Overall | 3 | 188 | 0.618 (0.388-0.985) | 0.043 | 0.0% | 0.867 |
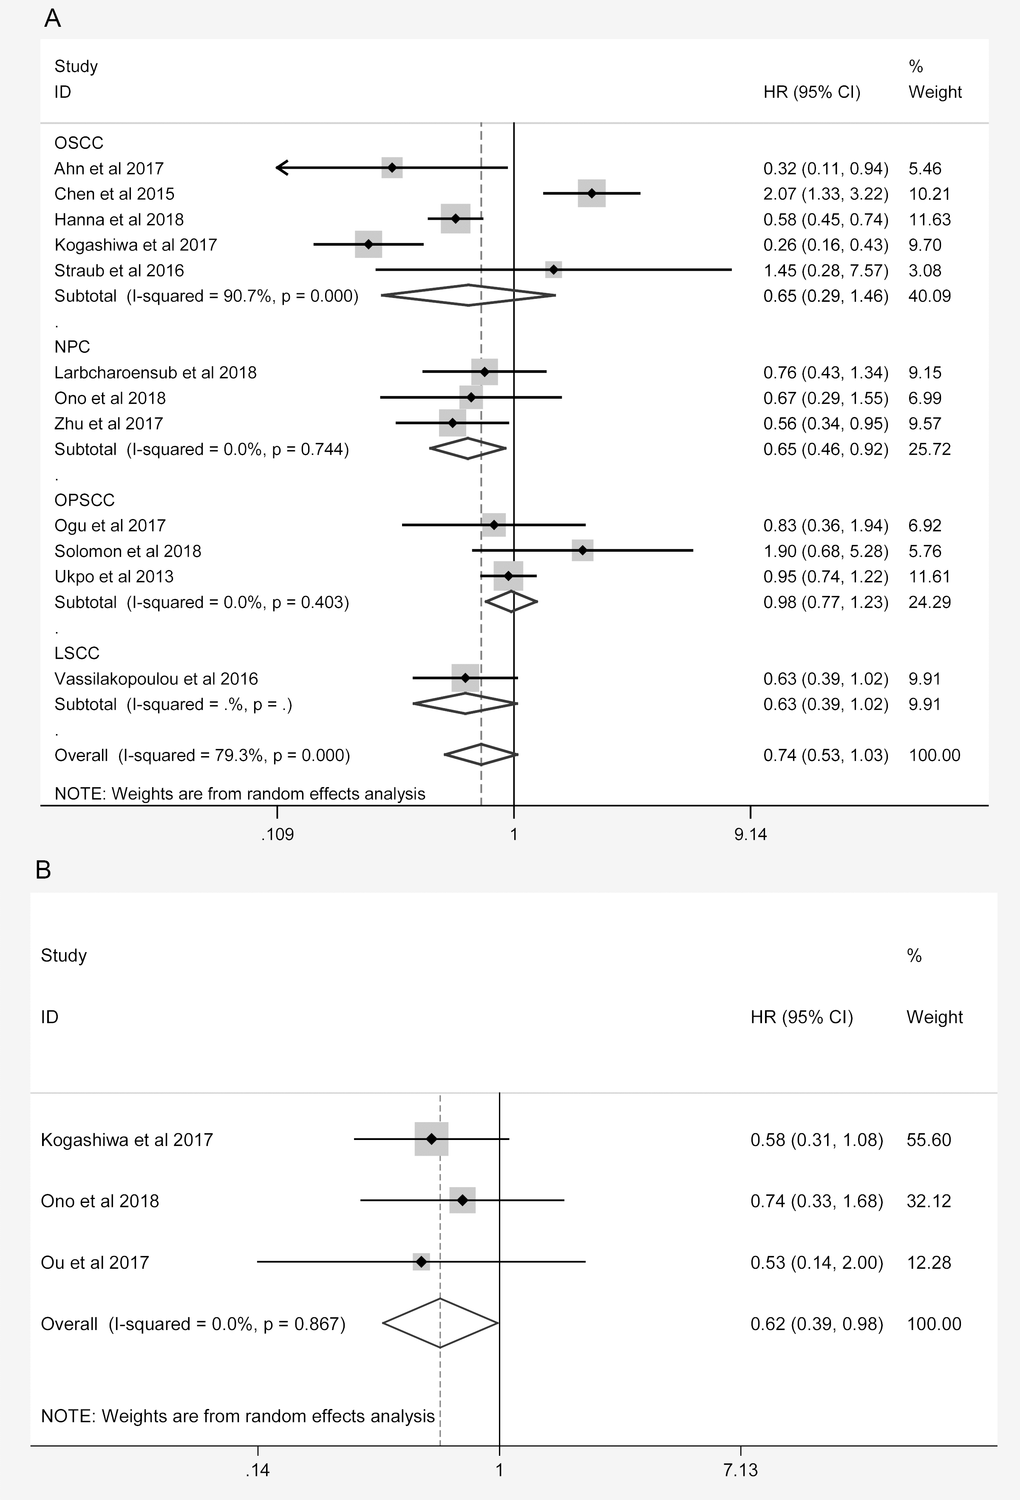
Figure 4. Overall forest plots of sensitivity analysis. (A) Stratified analysis based on the tumor location for the association between PD-L1 and OS. (B) Overall forest plots of sensitivity analysis for the association between PD-L1 and PFS.
Funnel plots of OS were created for all the studies (Figure 5A), for the studies on PD-L1 (Figure 5B) and for the high-quality studies on PD-L1 (Figure 5C). For all three plots, the studies were distributed uniformly around the axis, manifesting no obvious publication bias (P = 0.509, 0.876 and 0.868 for all the studies, the studies on PD-L1 and the high-quality studies on PD-L1, respectively).
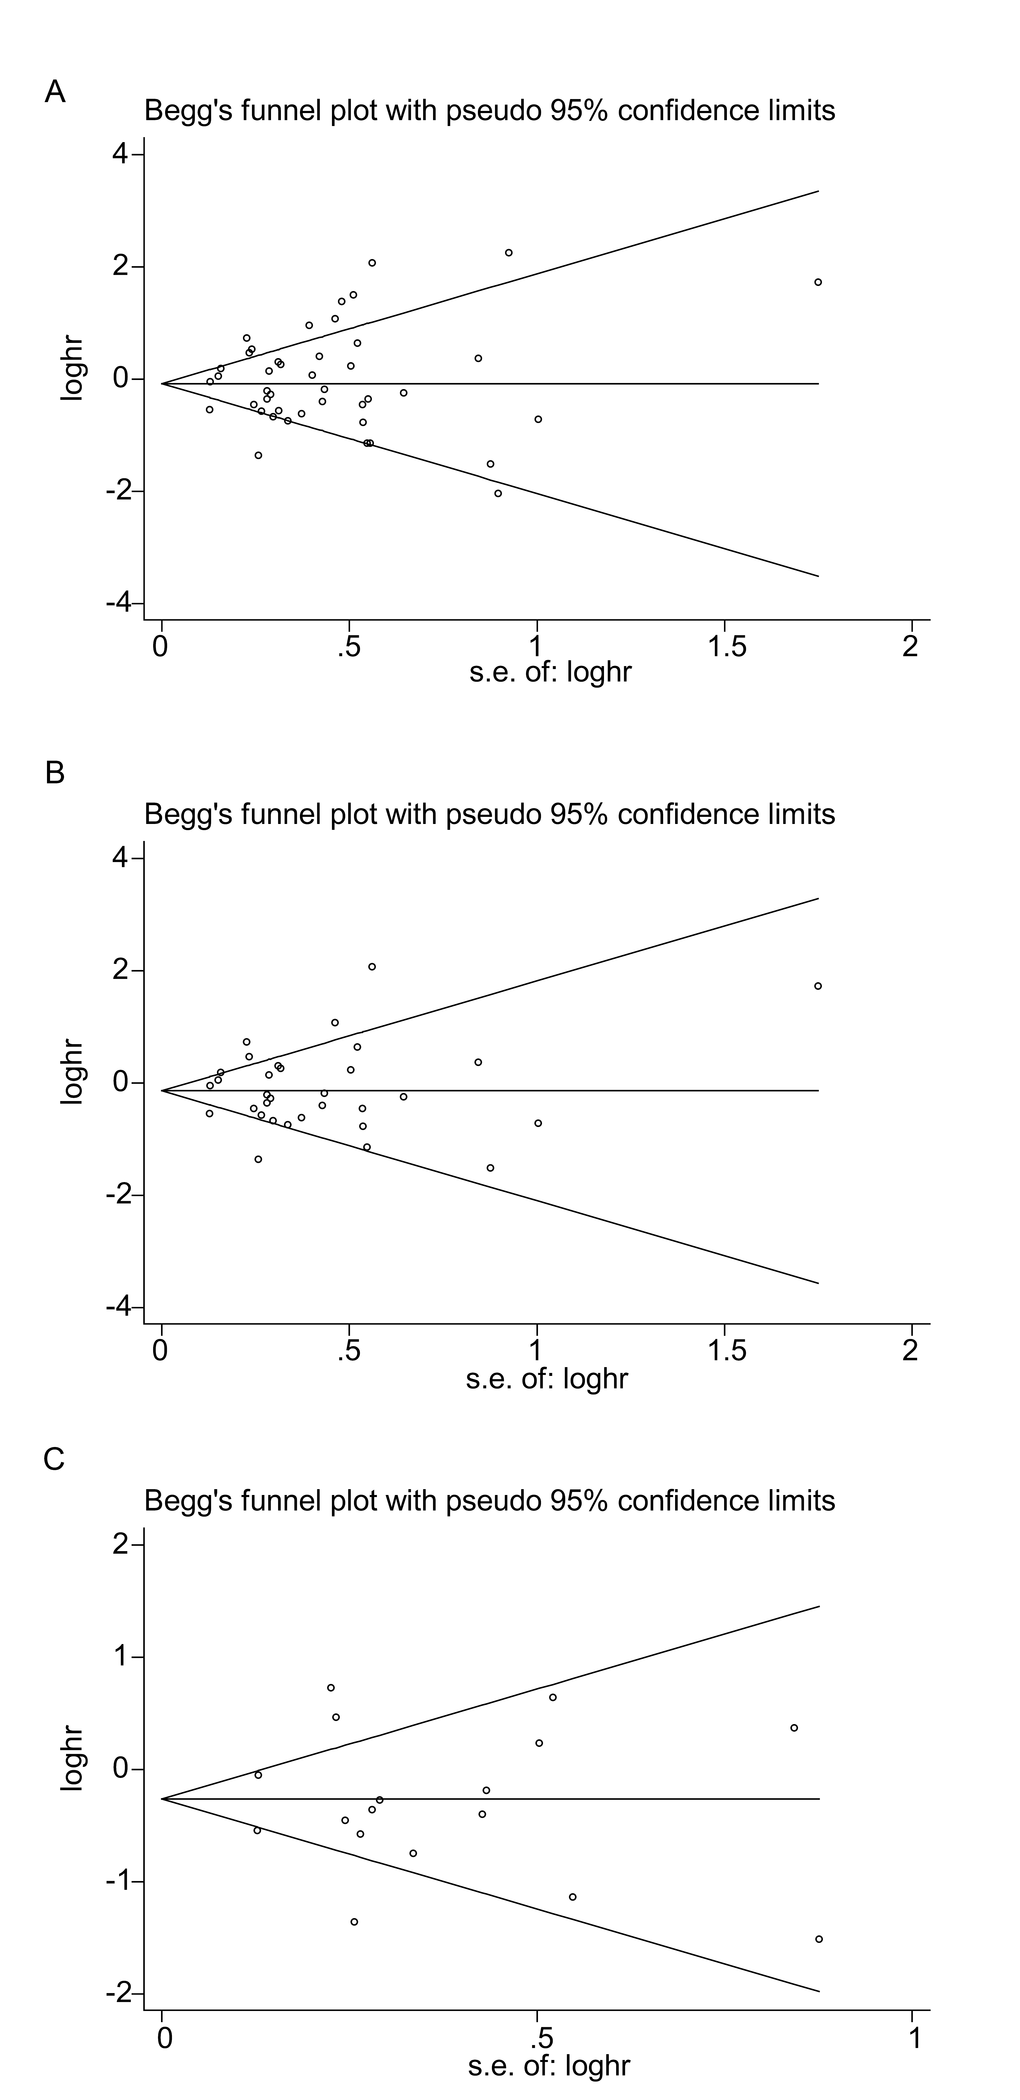
Figure 5. Begg’s funnel plots of publication bias on the relationships between immune checkpoint molecules and OS in all studies (A), PD-L1-associated studies (B) and high-quality studies on PD-L1 (C).
Discussion
As immune checkpoint molecules could be involved in the immune surveillance of tumor development and progression and the clearance of tumors [11], anti-immune-checkpoint drugs such as pembrolizumab [3,19], nivolumab [26,27] and ipilimumab [28] have been approved to treat melanoma, non-small cell lung cancer, renal cell carcinoma, prostate cancer and HNC. Recent studies have examined how immune checkpoint molecules, especially PD-L1, influence the prognosis of cancer patients, and a large number of updated reports have been published in the past two years. However, no consensus has been reached on the effects of immune checkpoint molecules on the prognosis of HNC.
This meta-analysis on the prognostic value of immune checkpoint molecules included 52 studies with a total of 7127 patients. The expression of immune checkpoint molecules was found to be a controversial prognostic factor for the OS, DFS, PFS, DSS and DMFS of HNC patients. Although the current view is that immune checkpoint molecules may be important predictors of a poor prognosis in HNC [17–19,22,29–31], our subgroup analysis stratified according to the immune checkpoint molecule revealed that different molecules had different associations with the patient prognosis. Thus, our results require careful attention.
Higher IDO expression was associated with a poorer prognosis for HNC patients in our study. Similarly, high IDO expression has been reported to correlate with a poor prognosis in patients with melanoma, breast cancer and colon cancer [32–34]. However, in our study, higher expression of PD-L1 tended to be associated with better OS. Kogashiwa et al. [35] found that higher expression of PD-L1 was associated with a higher number of CD8+ tumor-infiltrating lymphocytes, leading to better OS for HNC patients. Balermapas et al. and Hanna et al. [36,37] also reported higher levels of tumor-infiltrating lymphocytes in HNC patients expressing higher levels of PD-L1, which could explain the improved OS of these patients.
As PD-L1 attracted the most attention of the included immune checkpoint molecules, and a large number of updated studies reported the relationship between high levels of PD-L1 and the prognosis of HNC in 2017 and 2018, we considered it important to conduct a further meta-analysis solely on this molecule. We found that higher PD-L1 expression was associated with better OS in NPC patients, although for HNC overall there was only a positive trend, rather than a concrete link (Figure 3). A sensitivity analysis revealed the same trends in OS. In addition, higher PD-L1 expression was found to correlate with better PFS. The results of the sensitivity analysis may be more dependable than the former results, as all the included studies were of high quality. Furthermore, the same relationship between PD-L1 expression and OS was confirmed in Caucasian subjects, NPC patients and studies with small sample sizes.
Tumors can develop adaptive immune resistance, which is one of the two mechanisms regulating tumor PD-L1 expression (the second being intrinsic immune resistance) [38]. While the intrinsic mechanism leads to PD-L1 expression after oncogenic mutation [39], the adaptive mechanism causes tumor cells to express PD-L1 after they have been stimulated by interferon gamma secreted by CD8+ T cells [40,41]. Therefore, tumor-membranous PD-L1 levels could partly reflect the amount of tumor-infiltrating lymphocytes, especially cytotoxic T cells, accounting to some extent for the better survival of patients with higher PD-L1 levels.
There are several limitations to this meta-analysis. Firstly, the overall heterogeneity was high, so random effects models were required for the analysis, and there was less sensitivity to detect significant differences. Secondly, all the included studies were prospective, and the majority of studies did not have adequate random sequences or comparable cohorts, increasing the risk of bias. Thus, the quality of the included studies was not perfect. Lastly, the study populations were all of Asian or Caucasian ethnicity, which may have caused a population selection bias.
Our meta-analysis indicated that different immune checkpoint molecules correlated with different prognoses in HNC patients: higher IDO expression predicted a poorer prognosis, while higher PD-L1 expression was associated with a better prognosis. Furthermore, our study revealed that higher expression of PD-L1 was associated with significantly better OS in Caucasian subjects, NPC patients and studies with small sample sizes. In summary, our study suggested that the immune checkpoint molecules IDO and PD-L1 have potential prognostic value and applicability to immune therapy for HNC.
Methods
Literature-search strategy
This literature search was performed on August 10, 2018 without any restrictions in region, publication type, journal or language. The databases of PubMed, Embase and the Cochrane Library were thoroughly searched with the following strategy: ((((((((((((((((((((((((((head and neck cancer [Title/Abstract]) OR head and neck squamous cell carcinoma[Title/Abstract]) OR head and neck neoplasm$[Title/Abstract]) OR HNSCC[Title/Abstract]) OR SCCHN[Title/Abstract]) OR HNC[Title /Abstract]) OR mouth neoplasms[Title /Abstract]) OR cancers of mouth[Title/Abstract]) OR oral[Title/Abstract]) OR laryn*[Title/Abstract]) OR pharyn*[Title/Abstract]) OR tongue[Title/Abstract]) OR oropharyn*[Title/Abstract]) OR nasopharyn*[Title/Abstract]) OR hypopharyn*[Title/Abstract]) OR trachea[Title/Abstract]) OR laryngopharyn*[Title /Abstract]) OR cervical tracheal[Title/Abstract]) OR cervical esophagus[Title/Abstract]) OR lip[Title /Abstract])) OR sinonasal[Title/Abstract]) OR head and neck cutaneous squamous cell carcinoma[Title/Abstract]) OR squamous cell carcinoma of the oral cavity[Title/Abstract]) OR salivary gland carcinoma[Title/Abstract]) OR SGC[Title/Abstract]) AND (((((((((((((((((((((((((b7-h3[Title/Abstract]) OR cd276[Title/Abstract]) OR b7-h4[Title/Abstract]) OR vtcn1[Title/Abstract]) OR btla[Title/Abstract]) OR b and t lymphocyte attenuator) OR cd272[Title/Abstract]) OR ctla-4[Title/Abstract]) OR cytotoxic t-lymphocyte-associated protein 4[Title/Abstract]) OR cd152[Title /Abstract]) OR ido[Title/Abstract]) OR indoleamine 2,3-dioxygenase[Title/Abstract]) OR kir[Title/Abstract]) OR killer-cell immunoglobulin-like receptor[Title/Abstract]) OR lag3[Title/Abstract]) OR lymphocyte activation gene-3[Title/Abstract]) OR pd-1[Title/Abstract]) OR programmed death 1 receptor[Title/Abstract]) OR pd-l1[Title/Abstract]) OR programmed death ligand 1[Title/Abstract]) OR pd-l2[Title/Abstract]) OR tim-3[Title/Abstract]) OR t-cell immunoglobulin domain and mucin domain 3[Title/Abstract]) OR vista[Title/Abstract]) OR v-domain ig suppressor of t cell activation[Title/Abstract]) OR b7-h1[Title/Abstract]). Two reviewers (Y.Q.J. and B.Y.) inspected all candidate articles independently. Discrepancies were resolved by discussion with the senior authors (Z.W. and B.C.).
Inclusion and exclusion criteria
The available prospective comparative studies (cohort studies) were included in this study based on their conformance to the following inclusion criteria: 1) the association of immune checkpoint marker expression with OS/DFS/PFS/DSS/DMFS in HNC was reported; 2) the diagnosis of HNC was made based on pathological examination; 3) HRs and 95% CIs were provided or could be estimated from the text; 4) only the more recent or complete article was selected when multiple reports described the same population, to avoid the duplicate inclusion of data; and 5) articles were published as original research.
The exclusion criteria were: 1) reviews, meeting abstracts, letters; 2) animal model studies; 3) sample size < 30 patients; 4) insufficient data to estimate the HR and 95% CI; 5) the main type of tumor was not SCC; 6) the number of studies on a single molecule was less than three; and 7) the study design was not prospective.
Data extraction and quality assessment
Two reviewers (Y.Q.J. and B.Y.) extracted the following information independently from the included studies: author, year of publication, study country or region, sample ethnicity, tumor location, follow-up period, sample size, gender, cut-off values of immune checkpoint molecules, detection method, TNM stage, and survival data such as OS, DFS, PFS, DSS and DMFS. The HR and 95% CI were either reported or calculated from the P value or Kaplan-Meier survival curve [42,43]. Disagreements were resolved by a senior reviewer (Z.W.).
Two reviewers (L.L.W. and W.X.M.) independently assessed the quality of the included studies by the NOS. A score of 0–9 was given to each study, and studies with NOS scores ≥ 7 were defined as high-quality. Consensus was reached by discussion with senior reviewers (B.C. and Z.W.) when there were inconsistent results. Importantly, the procedure of assessing the quality of the studies was blinded to the reviewers who extracted the data (Y.Q.J. and B.Y.).
Statistical analysis
This meta-analysis was performed in accordance with recommendations from the Cochrane Collaboration and the Quality of Reporting of Meta-analyses guidelines [44,45]. The HR was used as a summary statistic for censored outcomes (OS, DFS, PFS, DSS and DMFS). HRs > 1 represented a poor prognosis in HNC.
Heterogeneity among the primary studies was evaluated by Cochrane’s Q statistic and the I2 statistic. A P value < 0.10 in Cochrane’s Q test or an I2 value > 50% indicates substantial heterogeneity among studies, so a random effects model was used to calculate the pooled HR and 95% CI in such cases. Otherwise, a fixed effects model was applied.
We used the mean sample size as the boundary between studies with large and small sample sizes. Subgroup analyses were carried out according to the immune checkpoint molecule, ethnicity, sample size and tumor location. Sensitivity analysis was applied to high-quality studies (NOS ≥ 7). Begg’s funnel plots were used to assess publication bias. All statistical analyses were conducted with STATA 12.0 statistical software (Stata Corporation, College Station, TX, USA). A two-tailed P value < 0.05 was considered statistically significant.
Abbreviations
PD-L1: programmed death ligand 1;
PD-1: programmed death 1;
LAG-3: lymphocyte activation gene 3;
CTLA-4: cytotoxic T-lymphocyte-associated protein 4;
PD-L2: programmed death ligand 2;
IDO: indoleamine 2, 3-dioxygenase;
VISTA: V-domain Ig suppressor of T cell activation;
HR: hazard ratio;
M/F: male/female;
NA: not available;
HNC: head and neck cancer;
HNSCC: head and neck squamous cell carcinoma;
OSCC: oral squamous cell carcinoma;
NPC: nasopharyngeal carcinoma;
OPSCC: oropharyngeal squamous cell carcinoma;
LSCC: laryngeal squamous cell carcinoma;
cut-off value: the value that can be diagnosed as positive/high expression of an immune checkpoint molecule;
AQUA: automated quantitative analysis;
IHC: immunohistochemistry;
IF: immunofluorescence;
qRT-PCR: quantitative reverse transcription polymerase chain reaction;
FACS: fluorescence-activated cell sorting;
FISH: fluorescence in situ hybridization;
OS: overall survival;
PFS: progression-free survival;
DFS: disease-free survival;
DSS: disease-specific survival;
DMFS: distant metastases-free survival;
P: prospective;
NOS: Newcastle–Ottawa Quality Assessment Scale;
CI: confidence interval.
Author Contributions
Y.Q.J. and B.Y. conceived and designed the research, analyzed the data and wrote the paper. Z.W. and B.C. reviewed drafts of the paper and participated in its design and coordination. L.L.W. and W.X.M. evaluated the quality of the literature and prepared the figures and tables. All the authors read and approved the final manuscript.
Conflicts of Interest
The authors declare no conflict of interest.
Funding
This study was supported by the National Natural Science Foundation of China (No. 81630025, 81772896, 81472524, 81630025) and the Natural Science Foundation of Guangdong Province (No. 2017A030311033).
References
-
1.
Torre LA, Bray F, Siegel RL, Ferlay J, Lortet-Tieulent J, Jemal A. Global cancer statistics, 2012. CA Cancer J Clin. 2015; 65:87–108. https://doi.org/10.3322/caac.21262 [PubMed]
-
2.
Albers AE, Strauss L, Liao T, Hoffmann TK, Kaufmann AM. T cell-tumor interaction directs the development of immunotherapies in head and neck cancer. Clin Dev Immunol. 2010; 2010:236378. https://doi.org/10.1155/2010/236378 [PubMed]
-
3.
De Costa AM, Young MR. Immunotherapy for head and neck cancer: advances and deficiencies. Anticancer Drugs. 2011; 22:674–81. https://doi.org/10.1097/CAD.0b013e328340fd18 [PubMed]
-
4.
Schoenfeld JD. Immunity in head and neck cancer. Cancer Immunol Res. 2015; 3:12–17. https://doi.org/10.1158/2326-6066.CIR-14-0205 [PubMed]
-
5.
Duray A, Demoulin S, Hubert P, Delvenne P, Saussez S. Immune suppression in head and neck cancers: a review. Clin Dev Immunol. 2010; 2010:701657. https://doi.org/10.1155/2010/701657 [PubMed]
-
6.
Fuller CD, Wang SJ, Thomas CRJr, Hoffman HT, Weber RS, Rosenthal DI. Conditional survival in head and neck squamous cell carcinoma: results from the SEER dataset 1973-1998. Cancer. 2007; 109:1331–43. https://doi.org/10.1002/cncr.22563 [PubMed]
-
7.
St John MA, Abemayor E, Wong DT. Recent new approaches to the treatment of head and neck cancer. Anticancer Drugs. 2006; 17:365–75. https://doi.org/10.1097/01.cad.0000198913.75571.13 [PubMed]
-
8.
Engels EA, Pfeiffer RM, Fraumeni JFJr, Kasiske BL, Israni AK, Snyder JJ, Wolfe RA, Goodrich NP, Bayakly AR, Clarke CA, Copeland G, Finch JL, Fleissner ML, et al. Spectrum of cancer risk among US solid organ transplant recipients. JAMA. 2011; 306:1891–901. https://doi.org/10.1001/jama.2011.1592 [PubMed]
-
9.
Chaturvedi AK, Anderson WF, Lortet-Tieulent J, Curado MP, Ferlay J, Franceschi S, Rosenberg PS, Bray F, Gillison ML. Worldwide trends in incidence rates for oral cavity and oropharyngeal cancers. J Clin Oncol. 2013; 31:4550–59. https://doi.org/10.1200/JCO.2013.50.3870 [PubMed]
-
10.
Raab-Traub N. Epstein-Barr virus in the pathogenesis of NPC. Semin Cancer Biol. 2002; 12:431–41. https://doi.org/10.1016/S1044579X0200086X [PubMed]
-
11.
Kerkar SP, Restifo NP. Cellular constituents of immune escape within the tumor microenvironment. Cancer Res. 2012; 72:3125–30. https://doi.org/10.1158/0008-5472.CAN-11-4094 [PubMed]
-
12.
Badoual C, Hans S, Merillon N, Van Ryswick C, Ravel P, Benhamouda N, Levionnois E, Nizard M, Si-Mohamed A, Besnier N, Gey A, Rotem-Yehudar R, Pere H, et al. PD-1-expressing tumor-infiltrating T cells are a favorable prognostic biomarker in HPV-associated head and neck cancer. Cancer Res. 2013; 73:128–38. https://doi.org/10.1158/0008-5472.CAN-12-2606 [PubMed]
-
13.
Hsu MC, Hsiao JR, Chang KC, Wu YH, Su IJ, Jin YT, Chang Y. Increase of programmed death-1-expressing intratumoral CD8 T cells predicts a poor prognosis for nasopharyngeal carcinoma. .Modern pathology. 2010; 23:1393–403. https://doi.org/10.1038/modpathol.2010.130
-
14.
Ben-Haj-Ayed A, Moussa A, Ghedira R, Gabbouj S, Miled S, Bouzid N, Tebra-Mrad S, Bouaouina N, Chouchane L, Zakhama A, Hassen E. Prognostic value of indoleamine 2,3-dioxygenase activity and expression in nasopharyngeal carcinoma. Immunol Lett. 2016; 169:23–32. https://doi.org/10.1016/j.imlet.2015.11.012 [PubMed]
-
15.
Laimer K, Troester B, Kloss F, Schafer G, Obrist P, Perathoner A, Laimer J, Brandacher G, Rasse M, Margreiter R, Amberger A. Expression and prognostic impact of indoleamine 2,3-dioxygenase in oral squamous cell carcinomas. Oral Oncol. 2011; 47:352–57. https://doi.org/10.1016/j.oraloncology.2011.03.007 [PubMed]
-
16.
Chen JT, Chen CH, Ku KL, Hsiao M, Chiang CP, Hsu TL, Chen MH, Wong CH. Glycoprotein B7-H3 overexpression and aberrant glycosylation in oral cancer and immune response. Proc Natl Acad Sci USA. 2015; 112:13057–62. https://doi.org/10.1073/pnas.1516991112 [PubMed]
-
17.
Katayama A, Takahara M, Kishibe K, Nagato T, Kunibe I, Katada A, Hayashi T, Harabuchi Y. Expression of B7-H3 in hypopharyngeal squamous cell carcinoma as a predictive indicator for tumor metastasis and prognosis. Int J Oncol. 2011; 38:1219–26. https://doi.org/10.3892/ijo.2011.949 [PubMed]
-
18.
Deng WW, Mao L, Yu GT, Bu LL, Ma SR, Liu B, Gutkind JS, Kulkarni AB, Zhang WF, Sun ZJ. LAG-3 confers poor prognosis and its blockade reshapes antitumor response in head and neck squamous cell carcinoma. OncoImmunology. 2016; 5:e1239005. https://doi.org/10.1080/2162402X.2016.1239005 [PubMed]
-
19.
Huang PY, Guo SS, Zhang Y, Lu JB, Chen QY, Tang LQ, Zhang L, Liu LT, Zhang L, Mai HQ. Tumor CTLA-4 overexpression predicts poor survival in patients with nasopharyngeal carcinoma. Oncotarget. 2016; 7:13060–68. https://doi.org/10.18632/oncotarget.7421 [PubMed]
-
20.
Yearley JH, Gibson C, Yu N, Moon C, Murphy E, Juco J, Lunceford J, Cheng J, Chow LQ, Seiwert TY, Handa M, Tomassini JE, McClanahan T. PD-L2 expression in human tumors: relevance to anti-PD-1 therapy in cancer. Clin Cancer Res. 2017; 23:3158–67. https://doi.org/10.1158/1078-0432.CCR-16-1761 [PubMed]
-
21.
Wu L, Deng WW, Huang CF, Bu LL, Yu GT, Mao L, Zhang WF, Liu B, Sun ZJ. Expression of VISTA correlated with immunosuppression and synergized with CD8 to predict survival in human oral squamous cell carcinoma. .Cancer Immunol Immunother. 2017; 66:627–36. https://doi.org/10.1007/s00262-017-1968-0
-
22.
Wu L, Deng WW, Yu GT, Mao L, Bu LL, Ma SR, Liu B, Zhang WF, Sun ZJ. B7-H4 expression indicates poor prognosis of oral squamous cell carcinoma. Cancer Immunol Immunother. 2016; 65:1035–45. https://doi.org/10.1007/s00262-016-1867-9 [PubMed]
-
23.
Ahn H, Yang JM, Kim H, Chung JH, Ahn SH, Jeong WJ, Paik JH. Clinicopathologic implications of the miR-197/PD-L1 axis in oral squamous cell carcinoma. Oncotarget. 2017; 8:66178–94. https://doi.org/10.18632/oncotarget.19842 [PubMed]
-
24.
Birtalan E, Danos K, Gurbi B, Brauswetter D, Halasz J, Kalocsane Piurko V, Acs B, Antal B, Mihalyi R, Pato A, Fent Z, Polony G, Timar J, et al. Expression of PD-L1 on Immune Cells Shows Better Prognosis in Laryngeal, Oropharygeal, and Hypopharyngeal Cancer. Appl Immunohistochem Mol Morphol. 2018; 26:e79–e85. https://doi.org/10.1097/pai.0000000000000590 [PubMed]
-
25.
Budczies J, Bockmayr M, Denkert C, Klauschen F, Gröschel S, Darb-Esfahani S, Pfarr N, Leichsenring J, Onozato ML, Lennerz JK, Dietel M, Fröhling S, Schirmacher P, et al. Pan-cancer analysis of copy number changes in programmed death-ligand 1 (PD-L1, CD274) - associations with gene expression, mutational load, and survival. Genes Chromosomes Cancer. 2016; 55:626–39. https://doi.org/10.1002/gcc.22365 [PubMed]
-
26.
Nanda R, Chow LQ, Dees EC, Berger R, Gupta S, Geva R, Pusztai L, Pathiraja K, Aktan G, Cheng JD, Karantza V, Buisseret L. Pembrolizumab in patients with advanced triple-negative breast cancer: Phase Ib KEYNOTE-012 Study. J Clin Oncol. 2016; 34:2460–67. https://doi.org/10.1200/JCO.2015.64.8931 [PubMed]
-
27.
Ferris RL, Blumenschein GJr, Fayette J, Guigay J, Colevas AD, Licitra L, Harrington K, Kasper S, Vokes EE, Even C, Worden F, Saba NF, Iglesias Docampo LC, et al. Nivolumab for recurrent squamous-cell carcinoma of the head and neck. N Engl J Med. 2016; 375:1856–67. https://doi.org/10.1056/NEJMoa1602252 [PubMed]
-
28.
Kwon ED, Drake CG, Scher HI, Fizazi K, Bossi A, van den Eertwegh AJ, Krainer M, Houede N, Santos R, Mahammedi H, Ng S, Maio M, Franke FA, et al, and CA184-043 Investigators. Ipilimumab versus placebo after radiotherapy in patients with metastatic castration-resistant prostate cancer that had progressed after docetaxel chemotherapy (CA184-043): a multicentre, randomised, double-blind, phase 3 trial. Lancet Oncol. 2014; 15:700–12. https://doi.org/10.1016/S1470-2045(14)70189-5 [PubMed]
-
29.
Li J, Wang P, Xu Y. Prognostic value of programmed cell death ligand 1 expression in patients with head and neck cancer: A systematic review and meta-analysis. PLoS One. 2017; 12:e0179536. https://doi.org/10.1371/journal.pone.0179536 [PubMed]
-
30.
Lin YM, Sung WW, Hsieh MJ, Tsai SC, Lai HW, Yang SM, Shen KH, Chen MK, Lee H, Yeh KT, Chen CJ. High PD-L1 Expression Correlates with Metastasis and Poor Prognosis in Oral Squamous Cell Carcinoma. PLoS One. 2015; 10:e0142656. https://doi.org/10.1371/journal.pone.0142656 [PubMed]
-
31.
Karpathiou G, Casteillo F, Giroult JB, Forest F, Fournel P, Monaya A, Froudarakis M, Dumollard JM, Prades JM, Peoc’h M. Prognostic impact of immune microenvironment in laryngeal and pharyngeal squamous cell carcinoma: immune cell subtypes, immuno-suppressive pathways and clinicopathologic characteristics. Oncotarget. 2017; 8:19310–22. https://doi.org/10.18632/oncotarget.14242 [PubMed]
-
32.
Wei L, Zhu S, Li M, Li F, Wei F, Liu J, Ren X. High Indoleamine 2,3-Dioxygenase Is Correlated With Microvessel Density and Worse Prognosis in Breast Cancer. Front Immunol. 2018; 9:724. https://doi.org/10.3389/fimmu.2018.00724 [PubMed]
-
33.
Liu X, Zhou W, Zhang X, Ding Y, Du Q, Hu R. 1-L-MT, an IDO inhibitor, prevented colitis-associated cancer by inducing CDC20 inhibition-mediated mitotic death of colon cancer cells. Int J Cancer. 2018; 143:1516–29. https://doi.org/10.1002/ijc.31417 [PubMed]
-
34.
Jia H, Ren W, Feng Y, Wei T, Guo M, Guo J, Zhao J, Song X, Wang M, Zhao T, Wang H, Feng Z, Tian Z. The enhanced antitumour response of pimozide combined with the IDO inhibitor L‑MT in melanoma. Int J Oncol. 2018; 53:949–60. https://doi.org/10.3892/ijo.2018.4473 [PubMed]
-
35.
Kogashiwa Y, Yasuda M, Sakurai H, Nakahira M, Sano Y, Gonda K, Ikeda T, Inoue H, Kuba K, Oba S, Ishikawa J, Enoki Y, Matsumura S, et al. PD-L1 Expression Confers Better Prognosis in Locally Advanced Oral Squamous Cell Carcinoma. Anticancer Res. 2017; 37:1417–24. https://doi.org/10.21873/anticanres.11465 [PubMed]
-
36.
Balermpas P, Rödel F, Krause M, Linge A, Lohaus F, Baumann M, Tinhofer I, Budach V, Sak A, Stuschke M, Gkika E, Grosu AL, Abdollahi A, et al, and DKTK-ROG. The PD-1/PD-L1 axis and human papilloma virus in patients with head and neck cancer after adjuvant chemoradiotherapy: a multicentre study of the German Cancer Consortium Radiation Oncology Group (DKTK-ROG). Int J Cancer. 2017; 141:594–603. https://doi.org/10.1002/ijc.30770 [PubMed]
-
37.
Hanna GJ, Woo SB, Li YY, Barletta JA, Hammerman PS, Lorch JH. Tumor PD-L1 expression is associated with improved survival and lower recurrence risk in young women with oral cavity squamous cell carcinoma. Int J Oral Maxillofac Surg. 2018; 47:568–77. https://doi.org/10.1016/j.ijom.2017.09.006 [PubMed]
-
38.
Zhu Q, Cai MY, Chen CL, Hu H, Lin HX, Li M, Weng DS, Zhao JJ, Guo L, Xia JC. Tumor cells PD-L1 expression as a favorable prognosis factor in nasopharyngeal carcinoma patients with pre-existing intratumor-infiltrating lymphocytes. OncoImmunology. 2017; 6:e1312240. https://doi.org/10.1080/2162402X.2017.1312240 [PubMed]
-
39.
Tumeh PC, Harview CL, Yearley JH, Shintaku IP, Taylor EJ, Robert L, Chmielowski B, Spasic M, Henry G, Ciobanu V, West AN, Carmona M, Kivork C, et al. PD-1 blockade induces responses by inhibiting adaptive immune resistance. Nature. 2014; 515:568–71. https://doi.org/10.1038/nature13954 [PubMed]
-
40.
Spranger S, Spaapen RM, Zha Y, Williams J, Meng Y, Ha TT, Gajewski TF. Up-regulation of PD-L1, IDO, and T(regs) in the melanoma tumor microenvironment is driven by CD8(+) T cells. Sci Transl Med. 2013; 5:200ra116. https://doi.org/10.1126/scitranslmed.3006504 [PubMed]
-
41.
Taube JM, Young GD, McMiller TL, Chen S, Salas JT, Pritchard TS, Xu H, Meeker AK, Fan J, Cheadle C, Berger AE, Pardoll DM, Topalian SL. Differential expression of immune-regulatory genes associated with PD-L1 display in melanoma: implications for PD-1 pathway blockade. Clin Cancer Res. 2015; 21:3969–76. https://doi.org/10.1158/1078-0432.CCR-15-0244 [PubMed]
-
42.
Parmar MK, Torri V, Stewart L. Extracting summary statistics to perform meta-analyses of the published literature for survival endpoints. Stat Med. 1998; 17:2815–34. https://doi.org/10.1002/(SICI)1097-0258(19981230)17:24<2815::AID-SIM110>3.0.CO;2-8 [PubMed]
-
43.
Tierney JF, Stewart LA, Ghersi D, Burdett S, Sydes MR. Practical methods for incorporating summary time-to-event data into meta-analysis. Trials. 2007; 8:16. https://doi.org/10.1186/1745-6215-8-16 [PubMed]
-
44.
Clarke M, Horton R. Bringing it all together: Lancet-Cochrane collaborate on systematic reviews. Lancet. 2001; 357:1728. https://doi.org/10.1016/S0140-6736(00)04934-5 [PubMed]
-
45.
Stroup DF, Berlin JA, Morton SC, Olkin I, Williamson GD, Rennie D, Moher D, Becker BJ, Sipe TA, Thacker SB. Meta-analysis of observational studies in epidemiology: a proposal for reporting. Meta-analysis Of Observational Studies in Epidemiology (MOOSE) group. JAMA. 2000; 283:2008–12. https://doi.org/10.1001/jama.283.15.2008 [PubMed]
-
46.
Chan OS, Kowanetz M, Ng WT, Koeppen H, Chan LK, Yeung RM, Wu H, Amler L, Mancao C. Characterization of PD-L1 expression and immune cell infiltration in nasopharyngeal cancer. Oral Oncol. 2017; 67:52–60. https://doi.org/10.1016/j.oraloncology.2017.02.002 [PubMed]
-
47.
Chang AM, Chiosea SI, Altman A, Pagdanganan HA, Ma C. Programmed Death-Ligand 1 expression, microsatellite instability, Epstein-Barr virus, and Human Papillomavirus in nasopharyngeal carcinomas of patients from the Philippines. Head Neck Pathol. 2017; 11:203–11. https://doi.org/10.1007/s12105-016-0765-y [PubMed]
-
48.
Chen TC, Wu CT, Wang CP, Hsu WL, Yang TL, Lou PJ, Ko JY, Chang YL. Associations among pretreatment tumor necrosis and the expression of HIF-1α and PD-L1 in advanced oral squamous cell carcinoma and the prognostic impact thereof. Oral Oncol. 2015; 51:1004–10. https://doi.org/10.1016/j.oraloncology.2015.08.011 [PubMed]
-
49.
Chen YP, Zhang J, Wang YQ, Liu N, He QM, Yang XJ, Sun Y, Ma J. The immune molecular landscape of the B7 and TNFR immunoregulatory ligand-receptor families in head and neck cancer: A comprehensive overview and the immunotherapeutic implications. OncoImmunology. 2017; 6:e1288329. https://doi.org/10.1080/2162402X.2017.1288329 [PubMed]
-
50.
Cho YA, Yoon HJ, Lee JI, Hong SP, Hong SD. Relationship between the expressions of PD-L1 and tumor-infiltrating lymphocytes in oral squamous cell carcinoma. Oral Oncol. 2011; 47:1148–53. https://doi.org/10.1016/j.oraloncology.2011.08.007 [PubMed]
-
51.
De Meulenaere A, Vermassen T, Aspeslagh S, Deron P, Duprez F, Laukens D, Van Dorpe J, Ferdinande L, Rottey S. Tumor PD-L1 status and CD8+ tumor-infiltrating T cells: markers of improved prognosis in oropharyngeal cancer. Oncotarget. 2017; 8:80443–52. https://doi.org/10.18632/oncotarget.19045 [PubMed]
-
52.
Fang W, Zhang J, Hong S, Zhan J, Chen N, Qin T, Tang Y, Zhang Y, Kang S, Zhou T, Wu X, Liang W, Hu Z, et al. EBV-driven LMP1 and IFN-γ up-regulate PD-L1 in nasopharyngeal carcinoma: implications for oncotargeted therapy. Oncotarget. 2014; 5:12189–202. https://doi.org/10.18632/oncotarget.2608 [PubMed]
-
53.
Feng Z, Bethmann D, Kappler M, Ballesteros-Merino C, Eckert A, Bell RB, Cheng A, Bui T, Leidner R, Urba WJ, Johnson K, Hoyt C, Bifulco CB, et al. Multiparametric immune profiling in HPV- oral squamous cell cancer. JCI Insight. 2017; 2:93652. https://doi.org/10.1172/jci.insight.93652 [PubMed]
-
54.
Fiedler M, Weber F, Hautmann MG, Haubner F, Reichert TE, Klingelhöffer C, Schreml S, Meier JK, Hartmann A, Ettl T. Biological predictors of radiosensitivity in head and neck squamous cell carcinoma. Clin Oral Investig. 2018; 22:189–200. https://doi.org/10.1007/s00784-017-2099-x [PubMed]
-
55.
Hong AM, Vilain RE, Romanes S, Yang J, Smith E, Jones D, Scolyer RA, Lee CS, Zhang M, Rose B. PD-L1 expression in tonsillar cancer is associated with human papillomavirus positivity and improved survival: implications for anti-PD1 clinical trials. Oncotarget. 2016; 7:77010–20. https://doi.org/10.18632/oncotarget.12776 [PubMed]
-
56.
Kansy BA, Concha-Benavente F, Srivastava RM, Jie HB, Shayan G, Lei Y, Moskovitz J, Moy J, Li J, Brandau S, Lang S, Schmitt NC, Freeman GJ, et al. PD-1 Status in CD8+ T Cells Associates with Survival and Anti-PD-1 Therapeutic Outcomes in Head and Neck Cancer. Cancer Res. 2017; 77:6353–64. https://doi.org/10.1158/0008-5472.CAN-16-3167 [PubMed]
-
57.
Kim HR, Ha SJ, Hong MH, Heo SJ, Koh YW, Choi EC, Kim EK, Pyo KH, Jung I, Seo D, Choi J, Cho BC, Yoon SO. PD-L1 expression on immune cells, but not on tumor cells, is a favorable prognostic factor for head and neck cancer patients. Sci Rep. 2016; 6:36956. https://doi.org/10.1038/srep36956 [PubMed]
-
58.
Kim HS, Lee JY, Lim SH, Park K, Sun JM, Ko YH, Baek CH, Son YI, Jeong HS, Ahn YC, Lee MY, Hong M, Ahn MJ. Association Between PD-L1 and HPV Status and the Prognostic Value of PD-L1 in Oropharyngeal Squamous Cell Carcinoma. Cancer Res Treat. 2016; 48:527–36. https://doi.org/10.4143/crt.2015.249 [PubMed]
-
59.
Larbcharoensub N, Mahaprom K, Jiarpinitnun C, Trachu N, Tubthong N, Pattaranutaporn P, Sirachainan E, Ngamphaiboon N. Characterization of PD-L1 and PD-1 expression and CD8+ Tumor-infiltrating lymphocyte in Epstein-Barr Virus-associated nasopharyngeal carcinoma. Am J Clin Oncol. 2018; 41:1204–10. https://doi.org/10.1097/COC.0000000000000449 [PubMed]
-
60.
Lee VH, Lo AW, Leung CY, Shek WH, Kwong DL, Lam KO, Tong CC, Sze CK, Leung TW. Correlation of PD-L1 expression of tumor cells with survival outcomes after radical intensity-modulated radiation therapy for non-metastatic nasopharyngeal carcinoma. PLoS One. 2016; 11:e0157969. https://doi.org/10.1371/journal.pone.0157969 [PubMed]
-
61.
Li YF, Ding JW, Liao LM, Zhang ZL, Liao SS, Wu Y, Zhou DY, Liu AW, Huang L. Expression of programmed death ligand-1 predicts poor outcome in nasopharyngeal carcinoma. Mol Clin Oncol. 2017; 7:378–82. https://doi.org/10.3892/mco.2017.1318 [PubMed]
-
62.
Müller T, Braun M, Dietrich D, Aktekin S, Höft S, Kristiansen G, Göke F, Schröck A, Brägelmann J, Held SA, Bootz F, Brossart P. PD-L1: a novel prognostic biomarker in head and neck squamous cell carcinoma. Oncotarget. 2017; 8:52889–900. https://doi.org/10.18632/oncotarget.17547 [PubMed]
-
63.
Ock CY, Kim S, Keam B, Kim M, Kim TM, Kim JH, Jeon YK, Lee JS, Kwon SK, Hah JH, Kwon TK, Kim DW, Wu HG, et al. PD-L1 expression is associated with epithelial-mesenchymal transition in head and neck squamous cell carcinoma. Oncotarget. 2016; 7:15901–14. https://doi.org/10.18632/oncotarget.7431 [PubMed]
-
64.
Oguejiofor K, Galletta-Williams H, Dovedi SJ, Roberts DL, Stern PL, West CM. Distinct patterns of infiltrating CD8+ T cells in HPV+ and CD68 macrophages in HPV- oropharyngeal squamous cell carcinomas are associated with better clinical outcome but PD-L1 expression is not prognostic. Oncotarget. 2017; 8:14416–27. https://doi.org/10.18632/oncotarget.14796 [PubMed]
-
65.
Oliveira-Costa JP, de Carvalho AF, da Silveira GG, Amaya P, Wu Y, Park KJ, Gigliola MP, Lustberg M, Buim ME, Ferreira EN, Kowalski LP, Chalmers JJ, Soares FA, et al. Gene expression patterns through oral squamous cell carcinoma development: PD-L1 expression in primary tumor and circulating tumor cells. Oncotarget. 2015; 6:20902–20. https://doi.org/10.18632/oncotarget.3939 [PubMed]
-
66.
Ono T, Azuma K, Kawahara A, Sasada T, Hattori S, Sato F, Shin B, Chitose SI, Akiba J, Hirohito U. Association between PD-L1 expression combined with tumor-infiltrating lymphocytes and the prognosis of patients with advanced hypopharyngeal squamous cell carcinoma. Oncotarget. 2017; 8:92699–714. https://doi.org/10.18632/oncotarget.21564 [PubMed]
-
67.
Ono T, Azuma K, Kawahara A, Sasada T, Matsuo N, Kakuma T, Kamimura H, Maeda R, Hattori C, On K, Nagata K, Sato F, Chitose SI, et al. Prognostic stratification of patients with nasopharyngeal carcinoma based on tumor immune microenvironment. Head Neck. 2018; 40:2007–19. https://doi.org/10.1002/hed.25189 [PubMed]
-
68.
Ou D, Adam J, Garberis I, Blanchard P, Nguyen F, Levy A, Casiraghi O, Gorphe P, Breuskin I, Janot F, Temam S, Scoazec JY, Deutsch E, Tao Y. Clinical relevance of tumor infiltrating lymphocytes, PD-L1 expression and correlation with HPV/p16 in head and neck cancer treated with bio- or chemo-radiotherapy. OncoImmunology. 2017; 6:e1341030. https://doi.org/10.1080/2162402X.2017.1341030 [PubMed]
-
69.
Qu Y, Wang D, Yang L, Liu HY, Cui W, Che YQ. Expression and clinical significance of programmed death ligand 1 in nasopharyngeal carcinoma. Mol Clin Oncol. 2018; 9:75–81. https://doi.org/10.3892/mco.2018.1633 [PubMed]
-
70.
Riobello C, Vivanco B, Reda S, López-Hernández A, García-Inclán C, Potes-Ares S, Cabal VN, López F, Llorente JL, Hermsen MA. Programmed death ligand-1 expression as immunotherapeutic target in sinonasal cancer. Head Neck. 2018; 40:818–27. https://doi.org/10.1002/hed.25067 [PubMed]
-
71.
Roper E, Lum T, Palme CE, Ashford B, Ch’ng S, Ranson M, Boyer M, Clark J, Gupta R. PD-L1 expression predicts longer disease free survival in high risk head and neck cutaneous squamous cell carcinoma. Pathology. 2017; 49:499–505. https://doi.org/10.1016/j.pathol.2017.04.004 [PubMed]
-
72.
Satgunaseelan L, Gupta R, Madore J, Chia N, Lum T, Palme CE, Boyer M, Scolyer RA, Clark JR. Programmed cell death-ligand 1 expression in oral squamous cell carcinoma is associated with an inflammatory phenotype. Pathology. 2016; 48:574–80. https://doi.org/10.1016/j.pathol.2016.07.003 [PubMed]
-
73.
Schneider S, Kadletz L, Wiebringhaus R, Kenner L, Selzer E, Füreder T, Rajky O, Berghoff AS, Preusser M, Heiduschka G. PD-1 and PD-L1 expression in HNSCC primary cancer and related lymph node metastasis - impact on clinical outcome. Histopathology. 2018; 73:573–84. https://doi.org/10.1111/his.13646 [PubMed]
-
74.
Seppälä M, Halme E, Tiilikainen L, Luukkainen A, Laranne J, Rautiainen M, Huhtala H, Paavonen T, Toppila-Salmi S. The expression and prognostic relevance of indoleamine 2,3-dioxygenase in tongue squamous cell carcinoma. Acta Otolaryngol. 2016; 136:729–35. https://doi.org/10.3109/00016489.2016.1152631 [PubMed]
-
75.
Solomon B, Young RJ, Bressel M, Urban D, Hendry S, Thai A, Angel C, Haddad A, Kowanetz M, Fua T, Corry J, Fox S, Rischin D. Prognostic Significance of PD-L1+ and CD8+ immune cells in HPV+ oropharyngeal squamous cell carcinoma. Cancer Immunol Res. 2018; 6:295–304. https://doi.org/10.1158/2326-6066.CIR-17-0299 [PubMed]
-
76.
Steuer CE, Griffith CC, Nannapaneni S, Patel MR, Liu Y, Magliocca KR, El-Deiry MW, Cohen C, Owonikoko TK, Shin DM, Chen ZG, Saba NF. A correlative analysis of PD-L1, PD-1, PD-L2, EGFR, HER2, and HER3 expression in oropharyngeal squamous cell carcinoma. Mol Cancer Ther. 2018; 17:710–16. https://doi.org/10.1158/1535-7163.MCT-17-0504 [PubMed]
-
77.
Strati A, Koutsodontis G, Papaxoinis G, Angelidis I, Zavridou M, Economopoulou P, Kotsantis I, Avgeris M, Mazel M, Perisanidis C, Sasaki C, Alix-Panabières C, Lianidou E, Psyrri A. Prognostic significance of PD-L1 expression on circulating tumor cells in patients with head and neck squamous cell carcinoma. Ann Oncol. 2017; 28:1923–33. https://doi.org/10.1093/annonc/mdx206 [PubMed]
-
78.
Straub M, Drecoll E, Pfarr N, Weichert W, Langer R, Hapfelmeier A, Götz C, Wolff KD, Kolk A, Specht K. CD274/PD-L1 gene amplification and PD-L1 protein expression are common events in squamous cell carcinoma of the oral cavity. Oncotarget. 2016; 7:12024–34. https://doi.org/10.18632/oncotarget.7593 [PubMed]
-
79.
Tang Y, He Y, Shi L, Yang L, Wang J, Lian Y, Fan C, Zhang P, Guo C, Zhang S, Gong Z, Li X, Xiong F, et al. Co-expression of AFAP1-AS1 and PD-1 predicts poor prognosis in nasopharyngeal carcinoma. Oncotarget. 2017; 8:39001–11. https://doi.org/10.18632/oncotarget.16545 [PubMed]
-
80.
Ukpo OC, Thorstad WL, Lewis JSJr. B7-H1 expression model for immune evasion in human papillomavirus-related oropharyngeal squamous cell carcinoma. Head Neck Pathol. 2013; 7:113–21. https://doi.org/10.1007/s12105-012-0406-z [PubMed]
-
81.
Vassilakopoulou M, Avgeris M, Velcheti V, Kotoula V, Rampias T, Chatzopoulos K, Perisanidis C, Kontos CK, Giotakis AI, Scorilas A, Rimm D, Sasaki C, Fountzilas G, Psyrri A. Evaluation of PD-L1 expression and associated tumor-infiltrating lymphocytes in laryngeal squamous cell carcinoma. Clin Cancer Res. 2016; 22:704–13. https://doi.org/10.1158/1078-0432.CCR-15-1543 [PubMed]
-
82.
Ye J, Liu H, Hu Y, Li P, Zhang G, Li Y. Tumoral indoleamine 2,3-dioxygenase expression predicts poor outcome in laryngeal squamous cell carcinoma. Virchows Arch. 2013; 462:73–81. https://doi.org/10.1007/s00428-012-1340-x [PubMed]
-
83.
Zhang J, Fang W, Qin T, Yang Y, Hong S, Liang W, Ma Y, Zhao H, Huang Y, Xue C, Huang P, Hu Z, Zhao Y, Zhang L. Co-expression of PD-1 and PD-L1 predicts poor outcome in nasopharyngeal carcinoma. Med Oncol. 2015; 32:86. https://doi.org/10.1007/s12032-015-0501-6 [PubMed]
-
84.
Zheng L, Cao C, Cheng G, Hu Q, Chen X. Cytomembranic PD-L1 expression in locoregionally advanced nasopharyngeal carcinoma. Onco Targets Ther. 2017; 10:5483–87. https://doi.org/10.2147/OTT.S152007 [PubMed]