


Introduction
Recently, progress using high-throughput sequencing technologies has spurred cancer genome research. Strikingly, the limited number of protein-coding genes makes it difficult to account for the abundant proteomic phenotypes, especially for tumors [1,2]. Alternative splicing (AS) is a major physiological phenomenon that allows for transcript variants in mammalian cells and for subsequent reprogramming of protein diversity for better environmental fit [3]. Given the indispensable functional impact of AS in genomic analysis, it is not surprising that disruptions of AS often lead to aberrant cellular homeostasis and are linked to cancer. Characterization of the AS landscape in cancers via reliable big data to identify biomarkers provides a wealth of insight into cancers with excellent prognostic value. Hence, increasing evidence has indicated that AS is actively involved in the initiation, progression and prognosis of cancers [4,5]. Additionally, cancer researchers realize the significant clinical utility of AS and its potential as a useful therapeutic signaling target [6–8]. In general, AS is a complex and tightly regulated process orchestrated by limited splicing factors (SFs) [9]. Therefore, recent analyses of cancer genomes have predominantly focused on evaluating the clinical significance of AS events and SFs in tumors, their potentially pathogenic impact for downstream pathways and the development of their regulatory network.
Thyroid cancer is the most common endocrine neoplasia, where papillary thyroid cancer (PTC) represents more than 90% of all thyroid cancers [10]. In recent decades, the sharp increase in PTC morbidity has aroused substantial concern [11,12]. Although PTC is indolent in most cases, high-incidence patients develop distant metastasis and lymph node metastasis, which often lead to high mortality. Therefore, it is imperative to screen for biomarkers to characterize PTC recurrence and metastasis for effective prognostic monitoring. AS is exploited by tumor cells, allowing the cells to live by sustaining a series of malignant behaviors. AS is emerging as an important diagnostic and prognostic signature to further understand tumorigenesis and to develop new targets for precision therapy in PTC [13]. To elucidate the global set of AS events, their contribution to the onset and development of PTC and how they affect molecular signaling to exert their biological function, a comprehensive analysis based on large clinical samples is urgently needed. RNA sequencing (RNA-seq) data generated by The Cancer Genome Atlas (TCGA) have supported data at the genome-wide level to identify the prognostic value of AS. Cancer-specific AS events could be effective biomarkers for clinical monitoring; however, dysregulation of splicing patterns on a transcriptome-wide scale has been less well studied until recently in PTC.
To unravel the pattern of global aberrant AS and its clinical implications in PTC, we focused on global AS patterns with complete clinical information from the TCGA database. From the perspective of AS, prognostic risk score systems were constructed based on AS events to predict the prognosis of PTC. Furthermore, we study how biological processes are affected by these AS evens. To assess the regulatory relationships between AS events and SFs, an evaluation of the regulatory network in silico tools is also presented.
Results
Cohort characteristics
We processed TCGA splice-seq files and clinical information of PTC patients. A total of 496 patients were included in the present analysis. The general clinical characteristics are summarized in Table 1. Before exploring the prognostic values of AS events, univariate Cox hazard analyses were performed to assess the relationship between the clinical features and clinical outcome of PTC patients (Table 1). American Joint Committee on Cancer (AJCC) TNM stage (hazard ration (HR)=2.780, 95% CI: 1.582-4.886; P<0.001), tumor stage (HR=2.830, 95% CI: 1.583-5.060; P<0.001), distant metastasis (HR=6.432, 95% CI: 2.202-18.789; P =0.001) and tumor status (HR=16.566, 95% CI: 9.361-29.314; P<0.001) were significantly correlated with the progression-free interval (PFI) of PTC. However, no significant correlations were observed between PFI and age, gender, lymph node metastasis and neoplasm focus type.
Table 1. General characteristics of included papillary thyroid cancer patients.
| Clinical parameters | No. | PFI | Hazard rations (95%CI) | P value | |||||||||||||||||||||||||||||||||||||||||||||||||||||||||||||||||||||||||||||||||||||||||||||||
| Event | Censored | ||||||||||||||||||||||||||||||||||||||||||||||||||||||||||||||||||||||||||||||||||||||||||||||||||
| All | 483 | 49 | 434 | - | - | ||||||||||||||||||||||||||||||||||||||||||||||||||||||||||||||||||||||||||||||||||||||||||||||
| Age | ≥50 | 214 | 27 | 187 | 1.705 (0.969-2.998) | 0.064 | |||||||||||||||||||||||||||||||||||||||||||||||||||||||||||||||||||||||||||||||||||||||||||||
| <50 | 269 | 22 | 247 | ||||||||||||||||||||||||||||||||||||||||||||||||||||||||||||||||||||||||||||||||||||||||||||||||
| Gender | Male | 128 | 18 | 110 | 1.757 (0.982-3.142) | 0.058 | |||||||||||||||||||||||||||||||||||||||||||||||||||||||||||||||||||||||||||||||||||||||||||||
| Female | 355 | 31 | 324 | ||||||||||||||||||||||||||||||||||||||||||||||||||||||||||||||||||||||||||||||||||||||||||||||||
| AJCC TNM stage | Stage III/IV | 158 | 27 | 131 | 2.780 (1.582-4.886) | <0.001 | |||||||||||||||||||||||||||||||||||||||||||||||||||||||||||||||||||||||||||||||||||||||||||||
| Stage I/II | 324 | 22 | 302 | ||||||||||||||||||||||||||||||||||||||||||||||||||||||||||||||||||||||||||||||||||||||||||||||||
| NA | 1 | 0 | 1 | ||||||||||||||||||||||||||||||||||||||||||||||||||||||||||||||||||||||||||||||||||||||||||||||||
| Tumor stage | T3-T4 | 184 | 31 | 153 | 2.830 (1.583-5.060) | <0.001 | |||||||||||||||||||||||||||||||||||||||||||||||||||||||||||||||||||||||||||||||||||||||||||||
| T1-T2 | 297 | 18 | 279 | ||||||||||||||||||||||||||||||||||||||||||||||||||||||||||||||||||||||||||||||||||||||||||||||||
| NA | 2 | 0 | 2 | ||||||||||||||||||||||||||||||||||||||||||||||||||||||||||||||||||||||||||||||||||||||||||||||||
| Lymph node metastasis | Positive | 212 | 28 | 184 | 1.713 (0.938-3.131) | 0.080 | |||||||||||||||||||||||||||||||||||||||||||||||||||||||||||||||||||||||||||||||||||||||||||||
| Negative | 222 | 17 | 205 | ||||||||||||||||||||||||||||||||||||||||||||||||||||||||||||||||||||||||||||||||||||||||||||||||
| NA | 49 | 4 | 45 | ||||||||||||||||||||||||||||||||||||||||||||||||||||||||||||||||||||||||||||||||||||||||||||||||
| Distant metastasis | Positive | 8 | 4 | 4 | 6.432 (2.202-18.789) | 0.001 | |||||||||||||||||||||||||||||||||||||||||||||||||||||||||||||||||||||||||||||||||||||||||||||
| Negative | 273 | 22 | 251 | ||||||||||||||||||||||||||||||||||||||||||||||||||||||||||||||||||||||||||||||||||||||||||||||||
| NA | 202 | 23 | 179 | ||||||||||||||||||||||||||||||||||||||||||||||||||||||||||||||||||||||||||||||||||||||||||||||||
| Neoplasm focus type | Multifocal | 214 | 21 | 193 | 1.101 (0.623-1.947) | 0.740 | |||||||||||||||||||||||||||||||||||||||||||||||||||||||||||||||||||||||||||||||||||||||||||||
| Unifocal | 259 | 28 | 231 | ||||||||||||||||||||||||||||||||||||||||||||||||||||||||||||||||||||||||||||||||||||||||||||||||
| NA | 10 | 0 | 10 | ||||||||||||||||||||||||||||||||||||||||||||||||||||||||||||||||||||||||||||||||||||||||||||||||
| Tumor status | With tumor | 40 | 25 | 15 | 16.566 (9.361-29.314) | <0.001 | |||||||||||||||||||||||||||||||||||||||||||||||||||||||||||||||||||||||||||||||||||||||||||||
| Tumor free | 434 | 23 | 411 | ||||||||||||||||||||||||||||||||||||||||||||||||||||||||||||||||||||||||||||||||||||||||||||||||
| NA | 9 | 1 | 8 | ||||||||||||||||||||||||||||||||||||||||||||||||||||||||||||||||||||||||||||||||||||||||||||||||
| PFI: progression-free interval; NA: not available; CI: confidence interval. | |||||||||||||||||||||||||||||||||||||||||||||||||||||||||||||||||||||||||||||||||||||||||||||||||||
Survival associated AS events
As a whole, there are 3025 alternate acceptor (AA) events in 2227 genes, 2683 alternate donor (AD) events in 1955 genes, 8351 alternate promoter (AP) events in 3409 genes, 7598 alternate terminator (AT) events in 3381 genes, 13655 exon skip (ES) events in 5855 genes, 209 mutually exclusive exon (ME) events in 202 genes, and 2280 retained intron (RI) events in 1548 genes for evaluation of prognostic value (Figure 1A). A total of 207 AA events in 206 genes, 178 AD events in 173 genes, 706 AP events in 418 genes, 547 AT events in 314 genes, 986 ES events in 814 genes, 18 ME events in 18 genes, and 157 RI events in 149 genes were identified as prognosis-associated AS events (P<0.05) (Figure 1B). Thus, one gene might have two or more AS events that were markedly related to the PFI of PTC patients. The UpSet plot vividly revealed that ES was the most common prognosis-related event, and a gene could have up to three prognosis-related events (Figure 1C).
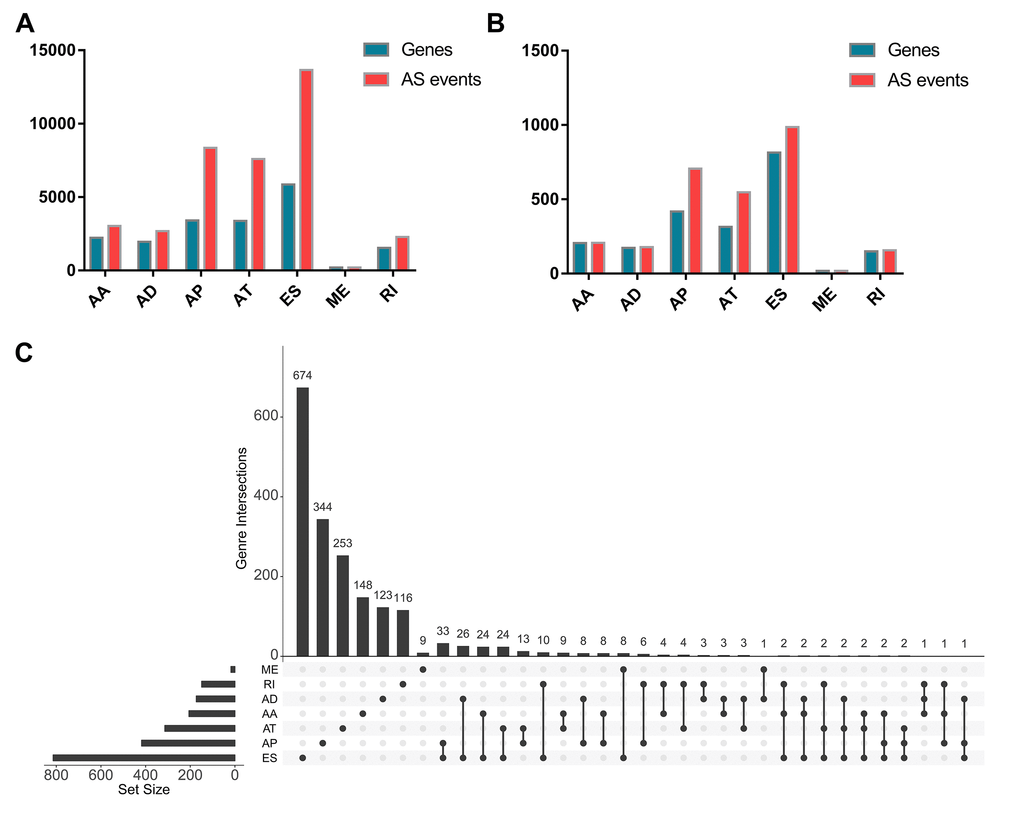
Figure 1. Prognosis-related alternative splicing (AS) events. (A) The number of AS events and corresponding genes included in the present study; (B) The number of prognosis-related AS events and corresponding genes obtained by using univariate COX analysis; (C) UpSet plots in papillary thyroid cancer, showing the interactions among the seven types of AS events. One gene may have up to three types of AS events.
Molecular characteristics of survival-associated AS events
The distributions of AS events significantly correlated with patient survival are displayed in Figure 2A. The 20 most significant prognosis-related AS events are also shown (Figure 2B-H). Among them, there were only 18 prognostic M events. To reveal the molecular characteristics of genes with survival-associated AS events, several bioinformatics analyses were conducted. First, a PPI network was constructed to demonstrate the relationships among these genes. RHOA, SRC, PXN and PTK2 ranked at the core in the network (Figure 3). According to the functional annotations of clusterProfiler, “electron transport chain”, “ribonucleoside triphosphate metabolic process” and “intracellular receptor signaling pathway” were the three most significant biological process terms (Figure 4A). “Focal adhesion”, “cell-substrate junction” and “cell-substrate adherens junction” were the three most significant cellular component terms (Figure 4B). For molecular function, “cadherin binding”, “cell adhesion molecule binding” and “oxidoreductase activity, acting on NAD(P)H, quinone or similar compound as acceptor” were three most enriched categories (Figure 4C). More importantly, we found that the “thermogenesis” pathway was correlated with these genes most significantly (Figure 5).
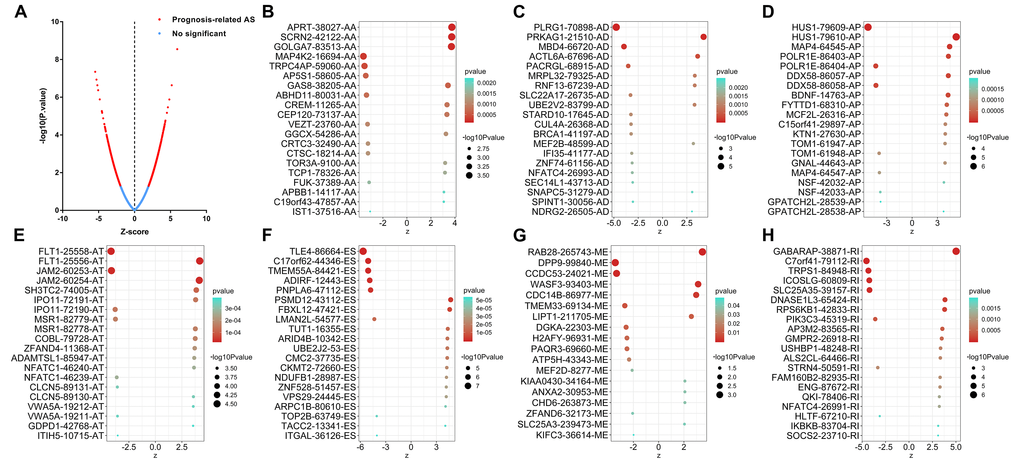
Figure 2. Top 20 most significant alternative splicing (AS) events in papillary thyroid cancer. (A) The red dots represent AS events that are significantly correlated with patient survival. The blue dots represent AS events without correlation. The top 20 AS events correlated with clinical outcome based on acceptor sites (B), alternate donor sites (C), alternate promoters (D), alternate terminators (E), exon skips (F), mutually exclusive exons (G), and retained introns (H).
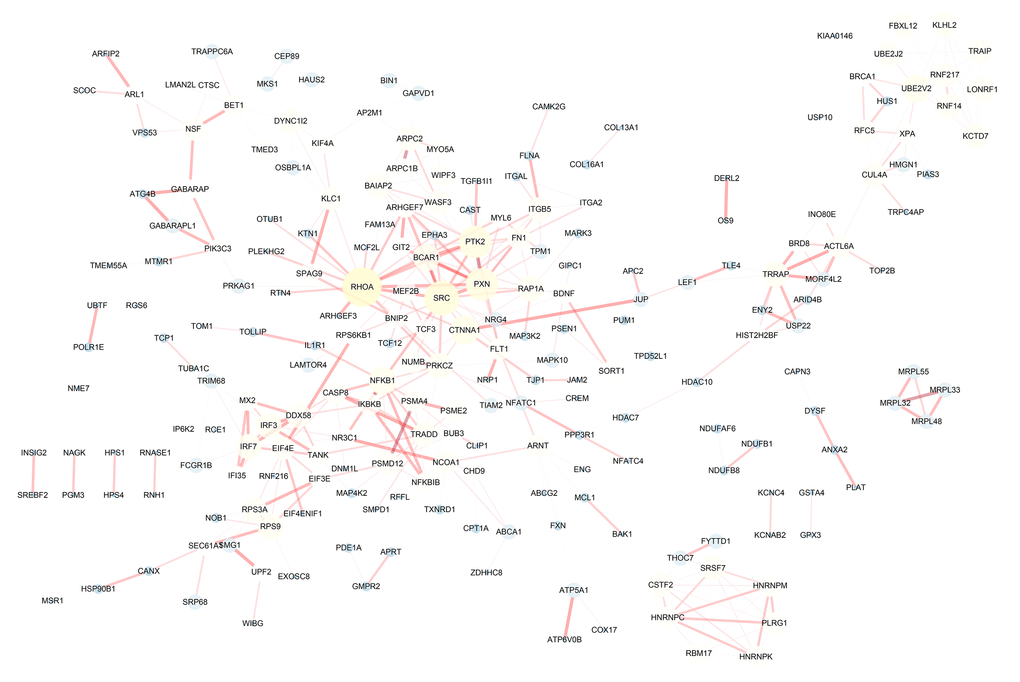
Figure 3. Protein-protein interaction network of genes with survival-associated alternative splicing events in papillary thyroid cancer. The bigger the point in the network, the more important it is.
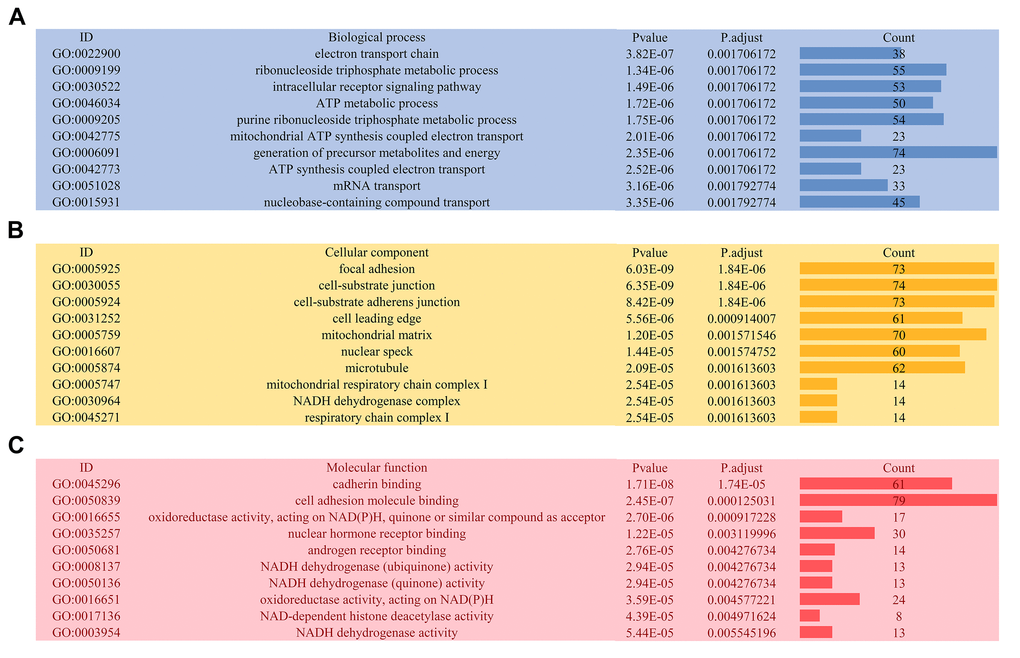
Figure 4. Gene ontology analysis of genes with survival-associated alternative splicing events. (A) Biological process; (B) Cellular component; (C) Molecular function.
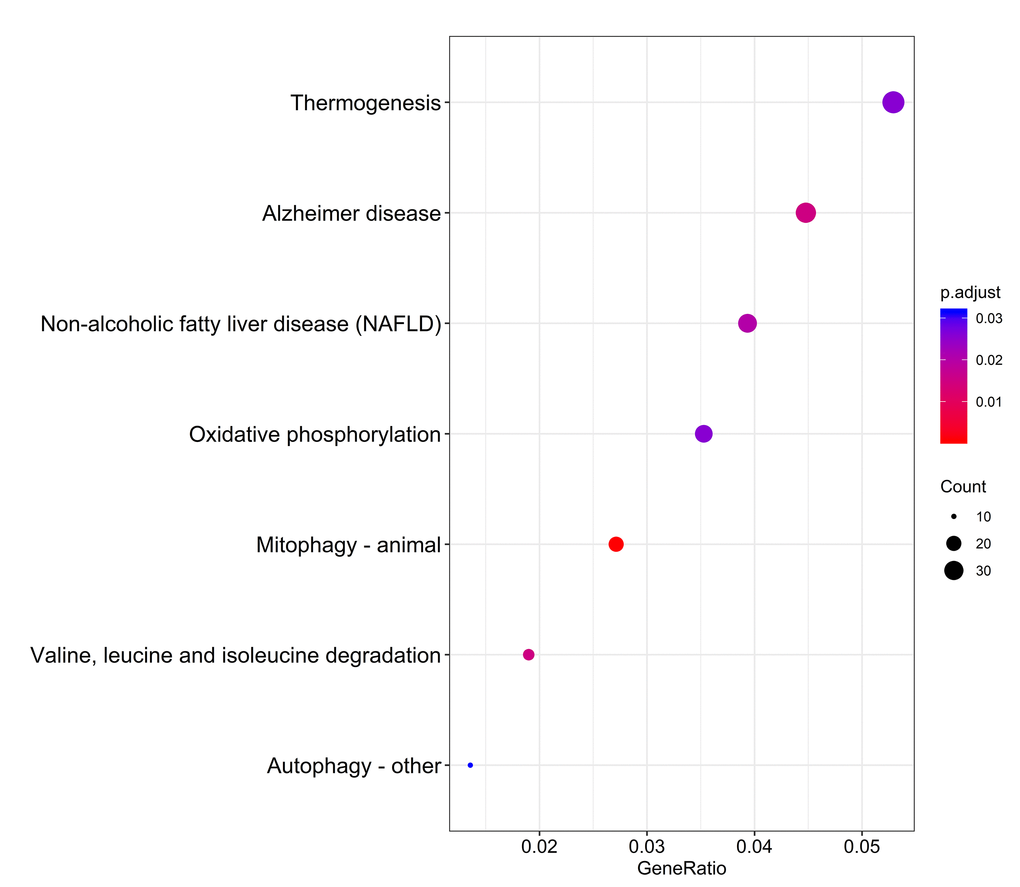
Figure 5. Kyoto Encyclopedia of Genes and Genomes (KEGG) pathway analysis of genes with survival-associated alternative splicing events.
Prognostic signatures for PTC patients
By using the least absolute shrinkage and selection operator (LASSO) Cox analysis following univariate Cox, we developed seven types of prognostic signatures based on AA, AD, AP, AT, ES, ME and RI (Figure 6, Table 2). Furthermore, we selected the top 20 most significant survival-associated AS events in the seven types to construct the final prognostic signature (Table 3). Interestingly, we found that the seven prognostic signatures could predict the clinical outcome of PTC patients (Figure 7). ROC curves validated the performance of prognostic signatures in prognosis prediction (Figure 8). The final prognostic signature was the most ideal predictor (Figure 9A). This signature could distinguish the PTC patients with distinct clinical outcome very well (Figure 9B). After multivariate adjustment by clinical factors, the prognostic signature remained a moderate and independent prognostic indicator (HR=5.809, 95%CI:1.669-20.211, P<0.001; Figure 9C).
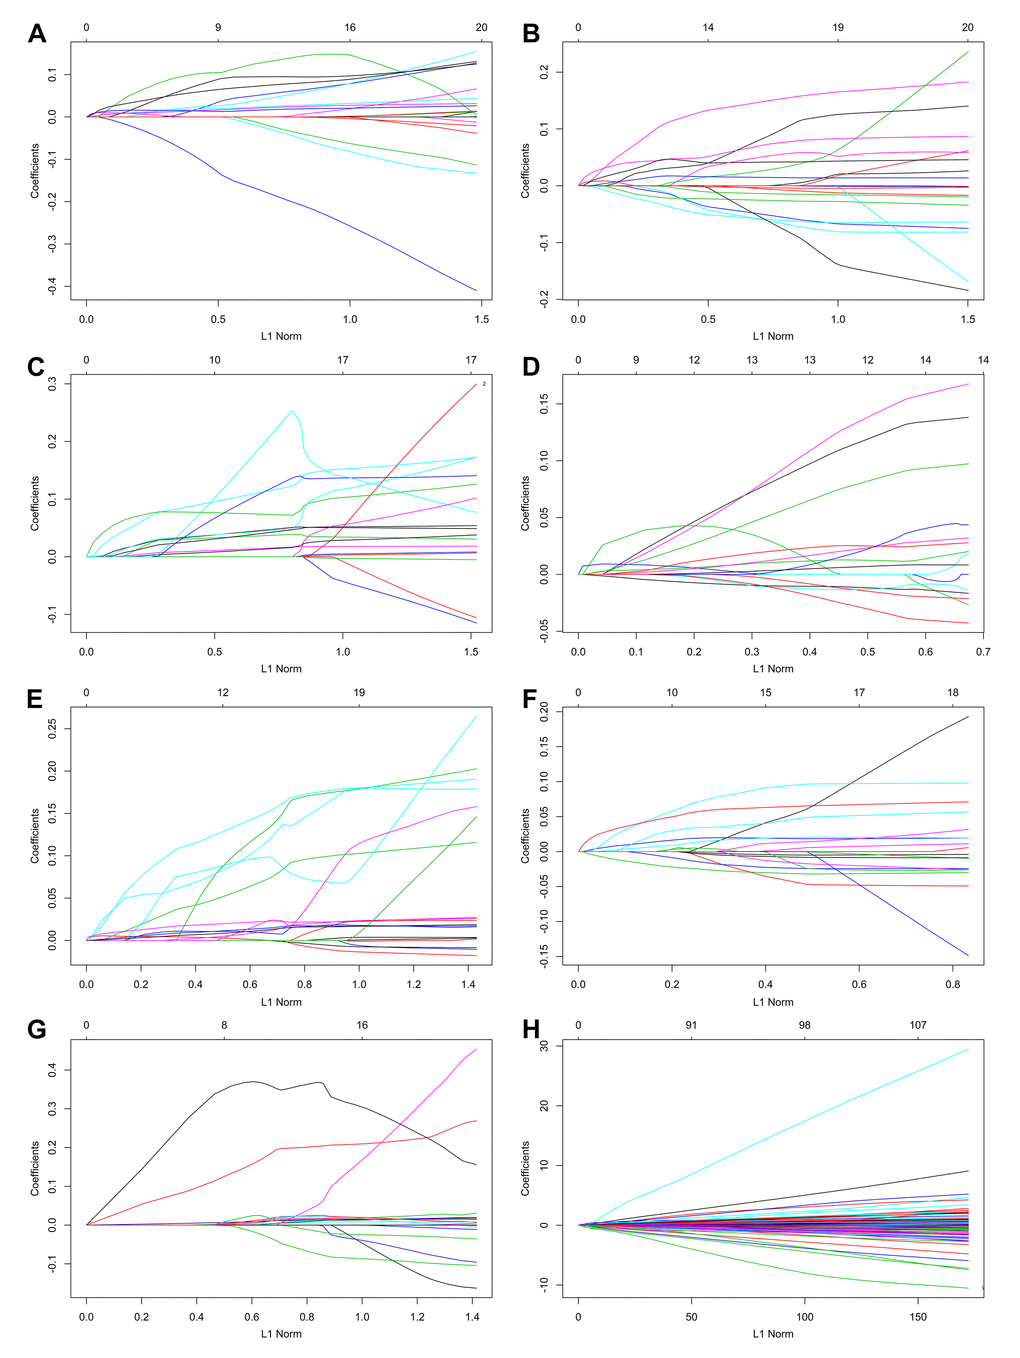
Figure 6. Construction of prognostic signatures based on LASSO COX analysis.
Table 2. Prognostic signatures for papillary thyroid cancer.
| Type | Formula | Hazard ratio (95%CI) | AUC |
| AA | APBB1-14117-AA * 0.104543 + APRT-38027-AA * 0.03133 + C19orf43-47857-AA * 0.025953 + CREM-11265-AA * 0.086061 + FUK-37389-AA * -0.123280 + GAS8-38205-AA * 0.01930 + GGCX-54286-AA * 0.016141 + GOLGA7-83513-AA* 0.063632 + SCRN2-42122-AA * 0.013288 | 5.767 (3.291-10.110) | 0.820 |
| AD | IFI35-41177-AD * (-0.000762) + MBD4-66720-AD * (-0.018721) + MEF2B-48599-AD * 0.062115 + MRPL32-79325-AD * 0.01512 + NDRG2-26505-AD * 0.002702 + PRKAG1-21510-AD * 0.040404 + RNF13-67239-AD * 0.026105 + SLC22A17-26735-AD * (-0.01058) + SNAPC5-31279-AD * 0.009076 | 5.526 (3.155-9.678) | 0.759 |
| AP | BDNF-14763-AP * 0.019345 + DDX58-86057-AP * 0.010935 + FYTTD1-68310-AP * 0.054980 + GNAL-44643-AP * 0.00322 + GPATCH2L-28538-AP * 0.011095 + HUS1-79610-AP * 0.069287 + MAP4-64545-AP *0.019803 + MCF2L-26316-AP * 0.000561 | 4.803 (2.742-8.412) | 0.748 |
| AT | ADAMTSL1-85947-AT * 0.103877 + CLCN5-89130-AT * 0.024612 + COBL-79728-AT * 0.005752 + GDPD1-42768-AT * 0.118004 + IPO11-72190-AT * (-0.01062) + ITIH5-10715-AT * (-0.010241) + JAM2-60254-AT * 0.012414 + MSR1-82778-AT * 0.011844 + MSR1-82779-AT * (-0.013158) + NFATC1-46240-AT * 0.018544 + SH3TC2-74005-AT * 0.005534 + VWA5A-19211-AT * (-0.021799) +ZFAND4-11368-AT * 0.070475 | 6.256 (3.573-10.950) | 0.781 |
| ES | ARID4B-10342-ES * 0.003164 + ARPC1B-80610-ES * 0.079956 + CKMT2-72660-ES * 0.010942 + CMC2-37735-ES * 0.125418 + FBXL12-47421-ES * 0.01949 + NDUFB1-28987-ES * 0.04923 + PSMD12-43112-ES * 0.079472 + TACC2-13341-ES * 0.00426 + TUT1-16355-ES * 0.010645 + UBE2J2-53-ES * 0.086546 + VPS29-24445-ES * 0.000217 + ZNF528-51457-ES * 0.008070 | 7.805 (4.456-13.670) | 0.817 |
| ME | CCDC53-24021-ME * (-0.017563) + CDC14B-86977-ME * 0.012660 + CHD6-263873-ME * 0.019448 + KIFC3-36614-ME * (-0.003343) + LIPT1-211705-ME * 0.043762 + RAB28-265743-ME * 0.042571 + WASF3-93403-ME * 0.006051 | 6.750 (3.852-11.830) | 0.820 |
| RI | ALS2CL-64466-RI * 0.003951 + AP3M2-83565-RI * 0.189298 + C7orf41-79112-RI * -0.036867 + DNASE1L3-65424-RI * 0.011210 + GABARAP-38871-RI * 0.355941 + GMPR2-26918-RI * 0.018861 + IKBKB-83704-RI * 0.016560 + NFATC4-26991-RI * 0.015686 + RPS6KB1-42833-RI * 0.01487 + SOCS2-23710-RI * 0.003253 + USHBP1-48248-RI * 0.011626 | 4.794 (2.730-8.418) | 0.796 |
| All | BDNF-14763-AP * 0.016836 + DDX58-86057-AP * 0.010816 + FYTTD1-68310-AP * 0.050450 + GNAL-44643-AP * 0.002647 + GPATCH2L-28538-AP * 0.008745 + HUS1-79610-AP * 0.04913 + MAP4-64545-AP * 0.017245 + IPO11-72190-AT * -0.001612 + ZFAND4-11368-AT * 0.006298 + CKMT2-72660-ES * 0.004576 + CMC2-37735-ES * 0.069065 + FBXL12-47421-ES * 0.007271 + NDUFB1-28987-ES * 0.019385 + PSMD12-43112-ES * 0.012527 + ZNF528-51457-ES * 0.002064 + AP3M2-83565-RI * 0.015821 + DNASE1L3-65424-RI * 0.001367 + GABARAP-38871-RI * 0.044678 | 9.841 (5.616-17.240) | 0.843 |
Table 3. Prognostic predictors for papillary thyroid cancer patients.
| Gene | As id | Splice type | Exons | Univariate COX | Index | |
| HR | P-value | |||||
| BDNF | 14763 | AP | 1.2:1.3:1.4:1.5 | 1.048 | 2.08E-05 | 0.016836 |
| DDX58 | 86057 | AP | 1 | 1.092 | 1.87E-05 | 0.010816 |
| FYTTD1 | 68310 | AP | 2 | 1.103 | 4.07E-05 | 0.050450 |
| GNAL | 44643 | AP | 4.2:4.3:4.4 | 1.021 | 9.88E-05 | 0.002647 |
| GPATCH2L | 28538 | AP | 2 | 1.061 | 0.000195096 | 0.008745 |
| HUS1 | 79610 | AP | 9.2 | 1.150 | 1.86E-07 | 0.049129 |
| MAP4 | 64545 | AP | 3.1:3.2 | 1.053 | 9.30E-06 | 0.017245 |
| IPO11 | 72190 | AT | 1 | 0.932 | 0.000146324 | -0.001612 |
| ZFAND4 | 11368 | AT | 1.2:1.3:1.4 | 1.124 | 0.000205212 | 0.006298 |
| CKMT2 | 72660 | ES | 1 | 1.025 | 2.37E-05 | 0.004576 |
| CMC2 | 37735 | ES | 3.1 | 1.189 | 1.90E-05 | 0.069065 |
| FBXL12 | 47421 | ES | 2.1 | 1.050 | 4.93E-06 | 0.007271 |
| NDUFB1 | 28987 | ES | 32 | 1.108 | 2.81E-05 | 0.019385 |
| PSMD12 | 43112 | ES | 13 | 1.203 | 2.84E-06 | 0.012527 |
| ZNF528 | 51457 | ES | 3 | 1.037 | 3.10E-05 | 0.002064 |
| AP3M2 | 83565 | RI | 2:03 | 1.280 | 0.00037889 | 0.015821 |
| DNASE1L3 | 65424 | RI | 6 | 1.023 | 0.000124882 | 0.001368 |
| GABARAP | 38871 | RI | 9 | 2.469 | 5.19E-07 | 0.044678 |
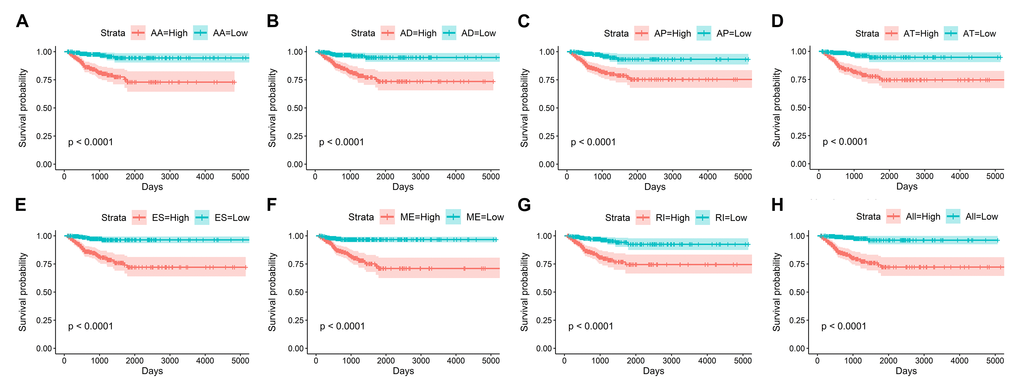
Figure 7. Kaplan-Meier curves of prognostic predictors for papillary thyroid cancer.
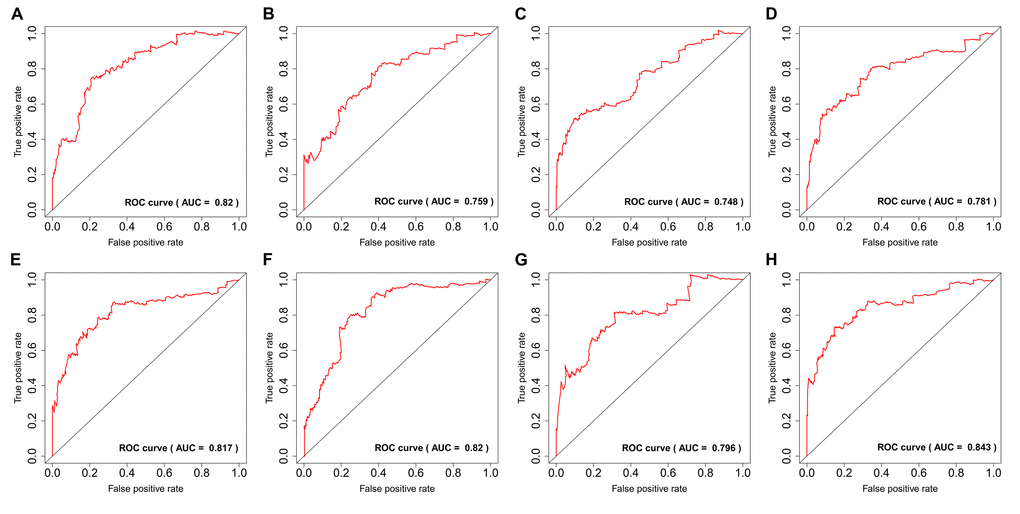
Figure 8. ROC curves of prognostic predictors for papillary thyroid cancer.
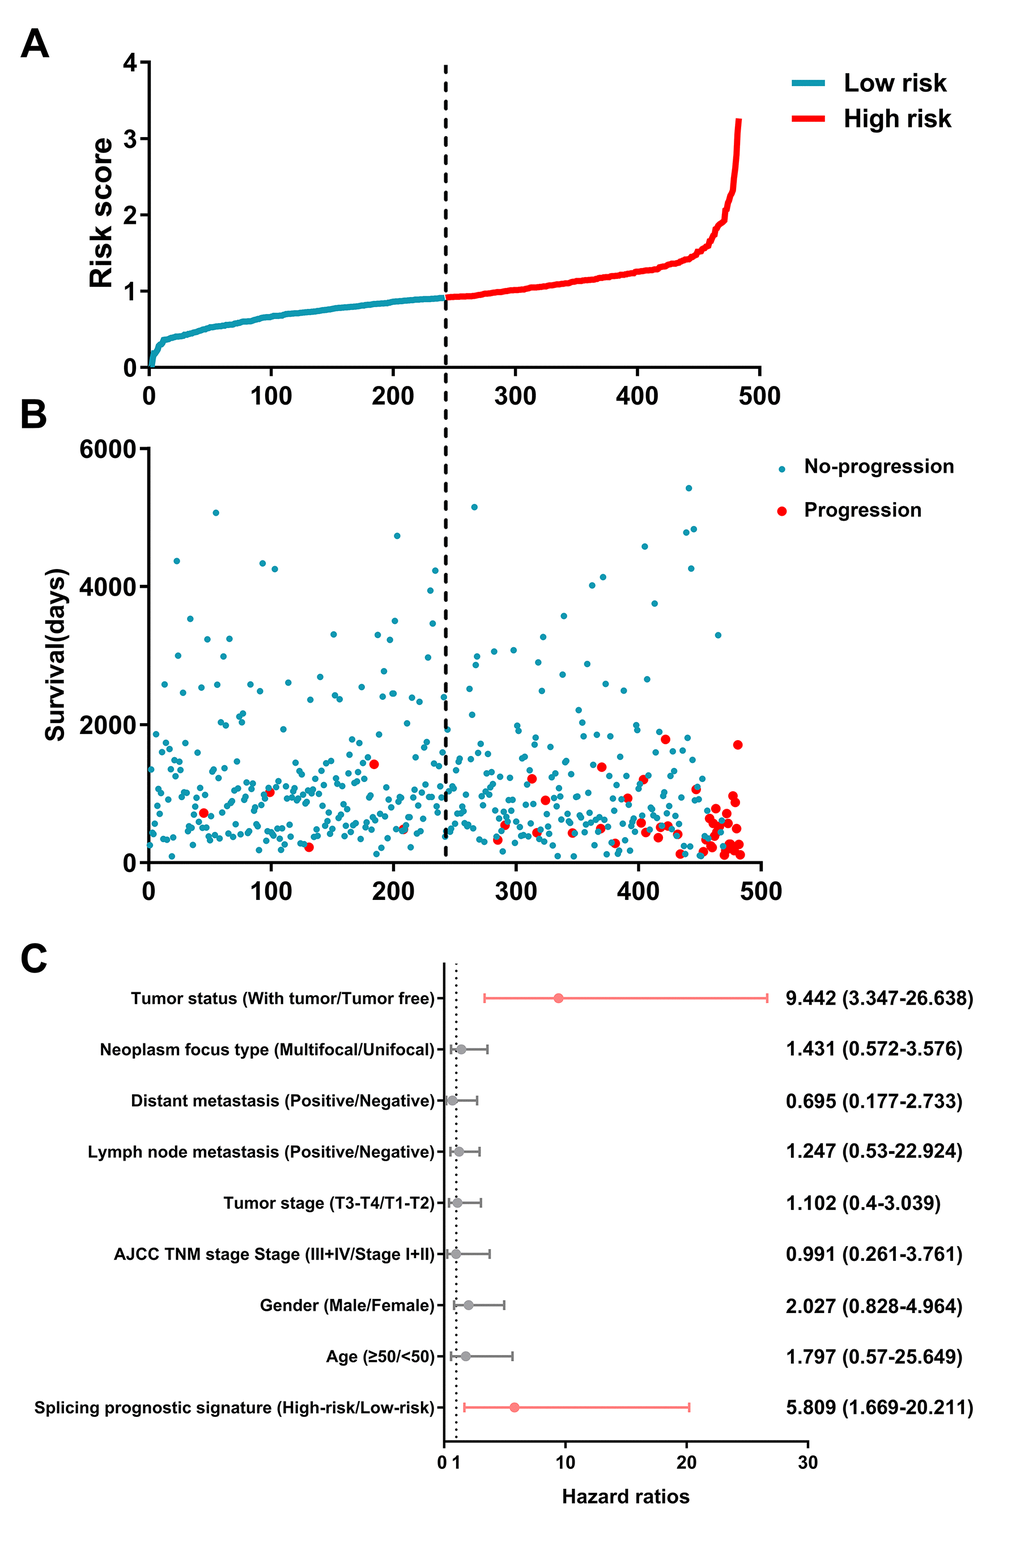
Figure 9. Identification capability of prognostic signature for separating patients into high- and low-risk groups.
Survival-associated SF-AS network
AS events are mainly orchestrated by SFs, which often bind to pre-mRNAs and regulate RNA splicing via influencing exon selection and splicing site. Therefore, exploration of the SF-AS regulatory network is imperative in PTC. Survival analyses based on TCGA data suggested that 12 SFs possess the ability to predict the PFI of PTC patients (Figure 10A). Next, correlation analyses between the expression of SFs and PSI value of the most significant AS events (P<0.0001) were conducted (Figure 10B).
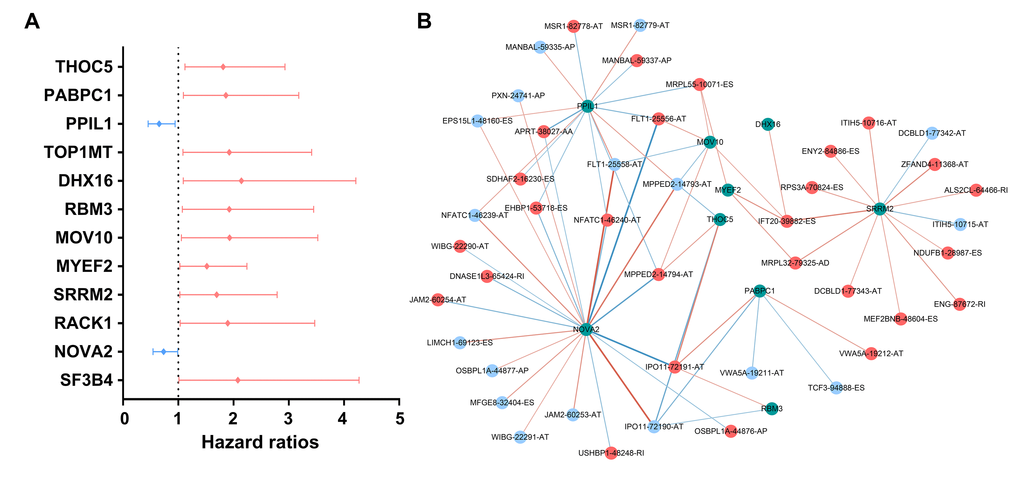
Figure 10. Survival-associated splicing factors and splicing correlation network in papillary thyroid cancer. (A) Survival-associated alternative splicing events; (B) Alternative splicing events whose PSI values were positively/negatively correlated with survival times are represented with red/blue dots. Green dots are survival-associated splicing factors. The positive/negative correlations between expressions of splicing factors and PSI values for alternative splicing are represented with red/blue lines.
Discussion
Currently, scientific research on the role of AS events in PTC still has many unanswered questions owing to the dearth of available large-sample public AS profiles and the paucity of systematic analysis referring to their clinical significance and deep molecular function. These bottlenecks have prevented cancer researchers from effectively recognizing the widespread applicability of AS events in PTC. Exploration of AS patterns broadens our vision and our understanding in traditional transcriptome molecular biomarkers. In this project, we adopted several biomedical computational approaches, which integrate the AS event profiles and clinical information of PTC patients to mine prognosis-related AS and construct splicing prognostic signatures that could stratify PTC patients into subgroups with distinct survival outcomes. Moreover, the SF-AS network could provide further insights into regulatory mechanisms in patients with PTC from the perspective of splicing.
PTC are characterized as an indolent disease, effective biomarkers that predictive the clinical outcome is limited. And the effectiveness prophylactic central compartment lymph node dissection in PTC is still controversial. The prophylactic dissection should be avoided to reduce surgical complications after thyroidectomy [14,15]. Hence, it is imperative to precise prediction instead of potential “overtreatment”. In recent years, next-generation sequencing technology has extensively promoted the investigation of whole-genome analyses, including genome splicing exploration. Previously, several studies conducted SpliceSeq analyses to generate alterative splicing profiles for some types of cancer, as well as to construct prognostic signatures for cancer prognosis monitoring, including non-small cell lung cancer [16], ovarian cancer [17], bladder cancer [18], and gastrointestinal cancer [19]. To the best of our knowledge, we are the first group to integrate splicing profiles and TCGA clinical factors of PTC patients together to comprehensively investigate the prognostic value of AS. This computational bioinformatics pipeline could provide novel insights into the clinical value and potential regulatory mechanisms of AS at the genome-wide level. Previously, several studies have proposed transcriptomic signatures associated with the carcinogenesis and aggressiveness of PTC [20,21]. The present in-depth study further explored alterations of transcriptomes used as prognostic predictors and could broaden our horizons in the clinical significance of transcriptomic signatures.
Given the multitude of AS events impacted by their own pre-mRNAs, the downstream functional impact is partly used to describe the molecular function of AS alteration events. In the PPI network analysis, RHOA, SRC, PXN and PTK2 were the hub genes. Notably, RHOA and SRC have both been identified as important molecules involved in the biological process of PTC. For example, phosphatidylcholine-specific RHOA has been identified as indispensable in the thyrotropin-induced activation of phospholipase D in thyroid cells [22]. Src inhibitors have been proposed to be very useful in suppressing the growth of PTC [23]. Src-mediated inhibition in advanced PTC with BRAF and RAS mutations holds great promise for improving the clinical outcomes [24]. In this topic, we provided a potential novel function that is different from the traditional biological function. These findings also pave the way for future clinical applications. Functional enrichment analyses suggest that, in PTC, genes with prognosis-related AS events are associated with several energy metabolism-related pathways and therefore may provide a selective advantage to cancer cells through reprogramming of the energy metabolism. Tumor cells fuel wild growth that requires adjustments of energy metabolism [25]. The thyroid gland plays an irreplaceable role in body metabolism, owing to the various hormones produced by the thyroid. Multiple studies have reported that serine/glycine, glutamine metabolism-related protein expression is different according to the thyroid cancer subtype [26,27]. Quite surprisingly, precision metabolism target therapies of thyroid cancer have been investigated in recent decades [28–30]. Our findings proposed a panel of AS events that exert their biological functions in metabolic alterations of PTC.
The highlight of the current study was that we proposed prognostic signatures based on AS events for monitoring the prognosis of PTC patients. Owing to the favorable overall survival of PTC patients, PFI was selected as the endpoint. Recently, some multi-molecule-based signatures in PTC have been proposed. Bisarro Dos Reis M et al. generated a prognostic scoring system in well-differentiated thyroid carcinoma 21 DNA methylation probes [31]. Cai WY et al. also developed a prognostic signature by combining two mRNAs and two long noncoding RNAs for predicting the progression and prognosis of PTC [20]. Among patients with PTC, there remains a huge demand for additional tools to improve clinical management. Furthermore, different molecular biomarker-based signatures could provide different perspectives. Here, we used the LASSO Cox regression model to screen out a set of AS events to facilitate clinical transfer. Prognostic signatures we proposed displayed ideal performance in predicting the clinical outcome of patients. However, another independent cohort should be used to validate the efficiency.
An enormous number of AS events in organism cells are orchestrated by limited SFs [32]. The alteration spectrum of AS events that occur in multiple tumor types highlights splicing factors as an important mechanism of splicing deregulation in cancer [33]. Alterations of SFs in PTC are increasingly considered as independent molecules involved in carcinogenesis and progression via various mechanisms [34–36]. Splicing correlation network analysis has also clearly revealed larger regulated nodes, suggesting the prominent positions they hold in the SF-AS network. NOVA1 was highly connected in the network could contribute to the prognosis induced by splicing events. NOVA1 has been reported to play a significant role in carcinogenesis [37–39]. However, the role of NOVA1 in PTC has not been explored. Nevertheless, our algorithm suggested deregulated AS events as a hallmark of PTC. However, several limitations inevitably influenced the results' reliability. First, PTC are characterized by an indolent disease course. As a consequence, a significant proportion of patients considered to be disease-free could develop a disease recurrence in the subsequent follow-up. Second, another independent validation cohort should be used to validate in the future. Third, more in vivo and in vitro functional experiments are clearly needed to further explore the impact of dysregulated AS events and SFs in cancer development.
In summary, the current study established a detailed phenomenon base of prognosis-associated AS events in PTC patients, which is valuable in deciphering the functional contribution of AS events in PTC. These findings should facilitate the ongoing effort in developing novel genomic models for clinical cancer management. Moreover, the further identification of prognostic splicing factors and construction of the SF-AS network will pave the way for further exploration of splicing-related mechanisms.
Materials and Methods
Data acquisition
TCGA SpliceSeq [40] is a data portal that provides AS profiles across 33 tumors based on TCGA RNA-seq data. SpliceSeq evaluates seven types of splice events, including AA, AD, AP, AT, ES, ME, and RI. To quantify AS events, TCGA SpliceSeq processed the percent spliced in (PSI) value for cancer research analysis, which indicates the inclusion of a transcript element divided by the total number of reads for that AS event. Alterations in PSI values range from 0 to 100 (%), which suggests a shift in splicing events. AS events with a PSI value of more than 75% in thyroid carcinoma cohort samples were downloaded from the TCGA SpliceSeq database. The AS events with standard diversion < 1 were removed.
Clinical information of PTC patients was also downloaded and extracted from the pan-cancer atlas database of TCGA [41]. The PFI was used as the endpoint for survival analysis owing to the limited number of events for overall survival. More importantly, PFI records more endpoint events during the follow-up period. Only pathologically confirmed PTC patients with both follow-up and AS event data were included for our analysis. The same TCGA ID was used to integrate clinical information and AS events data.
Survival analysis
In the survival analysis, the follow-up periods ranged from 91 days to 5423 days after removing patients with PFIs of less than 90 days. Univariate Cox analysis was conducted to assess the relationships between the PSI value (from 0 to 100) of each AS event and the PFI of PTC patients (P < 0.05). LASSO method is a popular method for the regression of high-dimensional predictors [42]. LASSO has been extended for use in Cox regression survival analysis and is ideal for high-dimensional data. We selected the LASSO Cox regression model to determine the ideal coefficient for each prognostic feature and to estimate the deviance likelihood via 1-standard error (SE) criteria. The coefficients and partial likelihood deviance were calculated with the “glmnet” package in R.
Functional annotation
Functional annotation for the genes with survival-associated AS events was performed by the bioinformatics tool “clusterProfiler” to comprehensively explore the dysregulated functional relevance of these genes [43]. Gene ontology (GO) and the Kyoto Encyclopedia of Genes and Genomes (KEGG) were used to assess the functional categories. GO and KEGG terms with a P-value and q-value both smaller than 0.05 were considered significant categories.
Prognostic signature construction
The top 20 most significant AS events in univariate Cox analysis were submitted to LASSO regression Cox analysis to develop prognostic signatures based on seven types of AS events. Finally, prognostic signatures for PFI prediction were calculated by multiplying the PSI values of prognostic indictors and the coefficient assigned by LASSO Cox analysis. The evaluation of the splicing-based prognostic signature as an independent predictor was conducted by integrating the following clinical parameters into the multivariable Cox regression analysis: age (≥50 and <50), gender (male or female), AJCC TNM stage (stage III/IV or stage I/II), tumor stage (T3-T4 or T1-T2), lymph node metastasis (positive or negative), distant metastasis (positive or negative), neoplasm focus type (multifocal or unifocal) and tumor status (with tumor or tumor-free).
SF-AS regulatory network
A compendium of 404 splicing factors was obtained from a previous study [44]. The expression profiles of SF genes were curated from the TCGA dataset. The count value of SF level-3 mRNA data was downloaded and converted to log2(count+1) for further univariate Cox analysis. We selected axes between the expression value of SFs and PSI values of prognosis-related AS events to construct the SF-AS regulatory network according to the following conditions: P value less than 0.05 and Pearson correlation coefficient more than 0.3. Then, we built the correlation plots via Cytoscape version 3.6.1.
Acknowledgments
The authors would like to thank the TCGA Spliceseq and TCGA databases for the availability of the data.
Conflicts of Interest
The authors declare that they have no competing interests.
Funding
This study was supported by grants from the Guangxi National Nature Science Foundation (2017GXNSFAA198253).
References
- 1.
ENCODE Project Consortium . A user’s guide to the encyclopedia of DNA elements (ENCODE). PLoS Biol. 2011; 9:e1001046. https://doi.org/10.1371/journal.pbio.1001046 [PubMed] - 2. Djebali S, Davis CA, Merkel A, Dobin A, Lassmann T, Mortazavi A, Tanzer A, Lagarde J, Lin W, Schlesinger F, Xue C, Marinov GK, Khatun J, et al. Landscape of transcription in human cells. Nature. 2012; 489:101–08. https://doi.org/10.1038/nature11233 [PubMed]
- 3. Nilsen TW, Graveley BR. Expansion of the eukaryotic proteome by alternative splicing. Nature. 2010; 463:457–63. https://doi.org/10.1038/nature08909 [PubMed]
- 4. Antonopoulou E, Ladomery M. Targeting splicing in prostate cancer. Int J Mol Sci. 2018; 19:1287. https://doi.org/10.3390/ijms19051287 [PubMed]
- 5. Kim HK, Pham MH, Ko KS, Rhee BD, Han J. Alternative splicing isoforms in health and disease. Pflugers Arch. 2018; 470:995–1016. https://doi.org/10.1007/s00424-018-2136-x [PubMed]
- 6. Martinez-Montiel N, Rosas-Murrieta NH, Anaya Ruiz M, Monjaraz-Guzman E, Martinez-Contreras R. Alternative splicing as a target for cancer treatment. Int J Mol Sci. 2018; 19:545. https://doi.org/10.3390/ijms19020545 [PubMed]
- 7. Suñé-Pou M, Prieto-Sánchez S, Boyero-Corral S, Moreno-Castro C, El Yousfi Y, Suñé-Negre JM, Hernández-Munain C, Suñé C. Targeting splicing in the treatment of human disease. Genes (Basel). 2017; 8:87. https://doi.org/10.3390/genes8030087 [PubMed]
- 8. Kim YJ, Abdel-Wahab O. Therapeutic targeting of RNA splicing in myelodysplasia. Semin Hematol. 2017; 54:167–73. https://doi.org/10.1053/j.seminhematol.2017.06.007 [PubMed]
- 9. Anczuków O, Krainer AR. Splicing-factor alterations in cancers. RNA. 2016; 22:1285–301. https://doi.org/10.1261/rna.057919.116 [PubMed]
- 10. Wang TS, Sosa JA. Thyroid surgery for differentiated thyroid cancer - recent advances and future directions. Nat Rev Endocrinol. 2018; 14:670–83. https://doi.org/10.1038/s41574-018-0080-7 [PubMed]
- 11. Jung CK, Little MP, Lubin JH, Brenner AV, Wells SA
Jr , Sigurdson AJ, Nikiforov YE. The increase in thyroid cancer incidence during the last four decades is accompanied by a high frequency of BRAF mutations and a sharp increase in RAS mutations. J Clin Endocrinol Metab. 2014; 99:E276–85. https://doi.org/10.1210/jc.2013-2503 [PubMed] - 12. Torre LA, Bray F, Siegel RL, Ferlay J, Lortet-Tieulent J, Jemal A. Global cancer statistics, 2012. CA Cancer J Clin. 2015; 65:87–108. https://doi.org/10.3322/caac.21262 [PubMed]
- 13. Teng H, Mao F, Liang J, Xue M, Wei W, Li X, Zhang K, Feng D, Liu B, Sun Z. Transcriptomic signature associated with carcinogenesis and aggressiveness of papillary thyroid carcinoma. Theranostics. 2018; 8:4345–58. https://doi.org/10.7150/thno.26862 [PubMed]
- 14. Calò PG, Conzo G, Raffaelli M, Medas F, Gambardella C, De Crea C, Gordini L, Patrone R, Sessa L, Erdas E, Tartaglia E, Lombardi CP. Total thyroidectomy alone versus ipsilateral versus bilateral prophylactic central neck dissection in clinically node-negative differentiated thyroid carcinoma. A retrospective multicenter study. Eur J Surg Oncol. 2017; 43:126–32. https://doi.org/10.1016/j.ejso.2016.09.017 [PubMed]
- 15. Conzo G, Tartaglia E, Avenia N, Calò PG, de Bellis A, Esposito K, Gambardella C, Iorio S, Pasquali D, Santini L, Sinisi MA, Sinisi AA, Testini M, et al. Role of prophylactic central compartment lymph node dissection in clinically N0 differentiated thyroid cancer patients: analysis of risk factors and review of modern trends. World J Surg Oncol. 2016; 14:149. https://doi.org/10.1186/s12957-016-0879-4 [PubMed]
- 16. Li Y, Sun N, Lu Z, Sun S, Huang J, Chen Z, He J. Prognostic alternative mRNA splicing signature in non-small cell lung cancer. Cancer Lett. 2017; 393:40–51. https://doi.org/10.1016/j.canlet.2017.02.016 [PubMed]
- 17. Zhu J, Chen Z, Yong L. Systematic profiling of alternative splicing signature reveals prognostic predictor for ovarian cancer. Gynecol Oncol. 2018; 148:368–74. https://doi.org/10.1016/j.ygyno.2017.11.028 [PubMed]
- 18. He RQ, Zhou XG, Yi QY, Deng CW, Gao JM, Chen G, Wang QY. Prognostic signature of alternative splicing events in bladder urothelial carcinoma based on spliceseq data from 317 Cases. Cell Physiol Biochem. 2018; 48:1355–68. https://doi.org/10.1159/000492094 [PubMed]
- 19. Lin P, He RQ, Ma FC, Liang L, He Y, Yang H, Dang YW, Chen G. Systematic analysis of survival-associated alternative splicing signatures in gastrointestinal pan-adenocarcinomas. EBioMedicine. 2018; 34:46–60. https://doi.org/10.1016/j.ebiom.2018.07.040 [PubMed]
- 20. Cai WY, Chen X, Chen LP, Li Q, Du XJ, Zhou YY. Role of differentially expressed genes and long non-coding RNAs in papillary thyroid carcinoma diagnosis, progression, and prognosis. J Cell Biochem. 2018; 119:8249–59. https://doi.org/10.1002/jcb.26836 [PubMed]
- 21. Han J, Chen M, Wang Y, Gong B, Zhuang T, Liang L, Qiao H. Identification of biomarkers based on differentially expressed genes in papillary thyroid carcinoma. Sci Rep. 2018; 8:9912. https://doi.org/10.1038/s41598-018-28299-9 [PubMed]
- 22. Kim JH, Kim SW, Jung PJ, Yon C, Kim SC, Han JS. Phosphatidylcholine-specific phospholipase C and RhoA are involved in the thyrotropin-induced activation of phospholipase D in FRTL-5 thyroid cells. Mol Cells. 2002; 14:272–80. [PubMed]
- 23. Henderson YC, Toro-Serra R, Chen Y, Ryu J, Frederick MJ, Zhou G, Gallick GE, Lai SY, Clayman GL. Src inhibitors in suppression of papillary thyroid carcinoma growth. Head Neck. 2014; 36:375–84. https://doi.org/10.1002/hed.23316 [PubMed]
- 24. Beadnell TC, Nassar KW, Rose MM, Clark EG, Danysh BP, Hofmann MC, Pozdeyev N, Schweppe RE. Src-mediated regulation of the PI3K pathway in advanced papillary and anaplastic thyroid cancer. Oncogenesis. 2018; 7:23. https://doi.org/10.1038/s41389-017-0015-5 [PubMed]
- 25. Hanahan D, Weinberg RA. Hallmarks of cancer: the next generation. Cell. 2011; 144:646–74. https://doi.org/10.1016/j.cell.2011.02.013 [PubMed]
- 26. Sun WY, Kim HM, Jung WH, Koo JS. Expression of serine/glycine metabolism-related proteins is different according to the thyroid cancer subtype. J Transl Med. 2016; 14:168. https://doi.org/10.1186/s12967-016-0915-8 [PubMed]
- 27. Kim HM, Lee YK, Koo JS. Expression of glutamine metabolism-related proteins in thyroid cancer. Oncotarget. 2016; 7:53628–41. https://doi.org/10.18632/oncotarget.10682 [PubMed]
- 28. Bikas A, Jensen K, Patel A, Costello J
Jr , McDaniel D, Klubo-Gwiezdzinska J, Larin O, Hoperia V, Burman KD, Boyle L, Wartofsky L, Vasko V. Glucose-deprivation increases thyroid cancer cells sensitivity to metformin. Endocr Relat Cancer. 2015; 22:919–32. https://doi.org/10.1530/ERC-15-0402 [PubMed] - 29. Curry JM, Tuluc M, Whitaker-Menezes D, Ames JA, Anantharaman A, Butera A, Leiby B, Cognetti DM, Sotgia F, Lisanti MP, Martinez-Outschoorn UE. Cancer metabolism, stemness and tumor recurrence: MCT1 and MCT4 are functional biomarkers of metabolic symbiosis in head and neck cancer. Cell Cycle. 2013; 12:1371–84. https://doi.org/10.4161/cc.24092 [PubMed]
- 30. Ciavardelli D, Bellomo M, Consalvo A, Crescimanno C, Vella V. Metabolic Alterations of Thyroid Cancer as Potential Therapeutic Targets. BioMed Res Int. 2017; 2017:2545031. https://doi.org/10.1155/2017/2545031 [PubMed]
- 31. Bisarro Dos Reis M, Barros-Filho MC, Marchi FA, Beltrami CM, Kuasne H, Pinto CA, Ambatipudi S, Herceg Z, Kowalski LP, Rogatto SR. Prognostic classifier based on genome-wide DNA methylation profiling in well-differentiated thyroid tumors. J Clin Endocrinol Metab. 2017; 102:4089–99. https://doi.org/10.1210/jc.2017-00881 [PubMed]
- 32. Lee Y, Rio DC. Mechanisms and regulation of alternative pre-mRNA splicing. Annu Rev Biochem. 2015; 84:291–323. https://doi.org/10.1146/annurev-biochem-060614-034316 [PubMed]
- 33. Zhang J, Manley JL. Misregulation of pre-mRNA alternative splicing in cancer. Cancer Discov. 2013; 3:1228–37. https://doi.org/10.1158/2159-8290.CD-13-0253 [PubMed]
- 34. Thijssen-Timmer DC, Schiphorst MP, Kwakkel J, Emter R, Kralli A, Wiersinga WM, Bakker O. PGC-1alpha regulates the isoform mRNA ratio of the alternatively spliced thyroid hormone receptor alpha transcript. J Mol Endocrinol. 2006; 37:251–57. https://doi.org/10.1677/jme.1.01914 [PubMed]
- 35. Baldini E, Tuccilli C, Arlot-Bonnemains Y, Chesnel F, Sorrenti S, De Vito C, Catania A, D’Armiento E, Antonelli A, Fallahi P, Watutantrige-Fernando S, Tartaglia F, Barollo S, et al. Deregulated expression of VHL mRNA variants in papillary thyroid cancer. Mol Cell Endocrinol. 2017; 443:121–27. https://doi.org/10.1016/j.mce.2017.01.019 [PubMed]
- 36. Anczuków O, Rosenberg AZ, Akerman M, Das S, Zhan L, Karni R, Muthuswamy SK, Krainer AR. The splicing factor SRSF1 regulates apoptosis and proliferation to promote mammary epithelial cell transformation. Nat Struct Mol Biol. 2012; 19:220–28. https://doi.org/10.1038/nsmb.2207 [PubMed]
- 37. Xin Y, Li Z, Zheng H, Ho J, Chan MT, Wu WK. Neuro-oncological ventral antigen 1 (NOVA1): implications in neurological diseases and cancers. Cell Prolif. 2017; 50. https://doi.org/10.1111/cpr.12348 [PubMed]
- 38. Yu X, Zheng H, Chan MT, Wu WK. NOVA1 acts as an oncogene in melanoma via regulating FOXO3a expression. J Cell Mol Med. 2018; 22:2622–30. https://doi.org/10.1111/jcmm.13527 [PubMed]
- 39. Kim EK, Yoon SO, Jung WY, Lee H, Kang Y, Jang YJ, Hong SW, Choi SH, Yang WI. Implications of NOVA1 suppression within the microenvironment of gastric cancer: association with immune cell dysregulation. Gastric Cancer. 2017; 20:438–47. https://doi.org/10.1007/s10120-016-0623-3 [PubMed]
- 40. Ryan M, Wong WC, Brown R, Akbani R, Su X, Broom B, Melott J, Weinstein J. TCGASpliceSeq a compendium of alternative mRNA splicing in cancer. Nucleic Acids Res. 2016; 44:D1018–22. https://doi.org/10.1093/nar/gkv1288 [PubMed]
- 41. Liu J, Lichtenberg T, Hoadley KA, Poisson LM, Lazar AJ, Cherniack AD, Kovatich AJ, Benz CC, Levine DA, Lee AV, Omberg L, Wolf DM, Shriver CD, et al, and Cancer Genome Atlas Research Network. An integrated TCGA pan-cancer clinical data resource to drive high-quality survival outcome analytics. Cell. 2018; 173:400–416.e11. https://doi.org/10.1016/j.cell.2018.02.052 [PubMed]
- 42. Tibshirani R. The lasso method for variable selection in the Cox model. Stat Med. 1997; 16:385–95. https://doi.org/10.1002/(SICI)1097-0258(19970228)16:4<385::AID-SIM380>3.0.CO;2-3 [PubMed]
- 43. Yu G, Wang LG, Han Y, He QY. clusterProfiler: an R package for comparing biological themes among gene clusters. OMICS. 2012; 16:284–87. https://doi.org/10.1089/omi.2011.0118 [PubMed]
- 44. Seiler M, Peng S, Agrawal AA, Palacino J, Teng T, Zhu P, Smith PG, Buonamici S, Yu L, Caesar-Johnson SJ, Demchok JA, Felau I, Kasapi M, et al, and Cancer Genome Atlas Research Network. Somatic mutational landscape of splicing factor genes and their functional consequences across 33 cancer types. Cell Reports. 2018; 23:282–296.e4. https://doi.org/10.1016/j.celrep.2018.01.088 [PubMed]