


Introduction
Tea has been a popular beverage since antiquity, with records referring to consumption dating back to the dynasty of Shen Nong (approximately 2700 BC) in China [1]. Tea is consumed in diverse ways, with brewed tea and products with a tea ingredient extremely prevalent in Asia, especially in China and Japan. It also is more fashionable than ever in western countries. A growing literature has demonstrated that tea intake is beneficial to human health, including mood improvement (e.g., anti-stress) [2–4], risk reduction of cognitive decline [5–8], cardiovascular disease prevention [9], lower cancer incidence [10, 11], reduced mortality [12, 13]. These benefits of tea are derived primarily from the effects of its constituents: catechin, L-theanine, and caffeine. In both animal and human studies [14–16], catechin has been found to be beneficial to cognitive health, showing enhancements in memory recognition and working memory performance compared to the intake of placebo [14]. Kimura et al. discovered that L-theanine plays a positive role in anti-stress by reducing stress-induced heart rate and salivary immunoglobulin A (s-lgA) during a stressed mental arithmetic task [3]. The beneficial effect of caffeine on cognitive functioning was reported at least two decades ago [17] and replicated by recent studies [18, 19]. Although individual constituents of tea have been related to the roles of maintaining cognitive abilities and preventing cognitive decline, a study with behavioural and neurophysiological measures showed that there was a degraded effect or no effect when a constituent was administered alone and a significant effect was observed only when constituents were combined [20]. The superior effect of the constituent combination was also demonstrated in a comparative experiment [21] that suggested that tea itself should be administered instead of tea extracts; a review of tea effects on the prevention of Alzheimer’s disease (AD) [22], found that the neuroprotective role of herbal tea was apparent in eight out of nine studies.
It is worth noting that the majority of studies thus far have evaluated tea effects from the perspective of neurocognitive and neuropsychological measures, with direct measurement of brain structure or function less-well represented in the extant literature (see a recent summary in [23]). In a double-blind, placebo-controlled, crossover study with near-infrared spectroscopy measure, cerebral blood flow in the frontal cortex was reduced by oral tea administration [24]. This change of regional brain activity was also observed by EEG in a study, showing that higher theta, alpha, and beta oscillations were associated with tea consumption in the frontal and medial frontal gyri [25]. These studies focusing on brain regional alterations did not ascertain tea effects on interregional interactions at the level of the entire brain.
Graph theoretical analysis is a suitable and effective tool to gain insights into brain interregional interactions and has been widely utilized in diverse investigations involving both patients and healthy people [26–28]. To date, only two published papers have investigated the association between functional connectivity and tea compounds in only a few task-related regions selected a priori [29, 30], leaving the large-scale networks of the brain unexplored.
In this study, we comprehensively explored brain connectivity with both global and regional metrics derived from structural and functional imaging to unveil putative differential connectivity organizations between tea drinking group and non-tea drinking group. In addition, we focused on interregional connectivity within the default mode network (DMN) because previous studies have suggested that it is predominantly involved in cognitive disease [31] and normal ageing [32]. Moreover, according to our prior investigation of hemispheric asymmetry, leftward asymmetry in structural connectivity is associated with brain ageing [33]. Therefore, hemispheric asymmetries in connectivity were also included to test the effects of tea drinking. We hypothesized that: (1) habitual tea drinking has positive effects on brain organization and gives rise to greater efficiency in functional and structural connectivities; (2) tea intake leads to less leftward asymmetry in structural connectivity; (3) tea drinking is associated with connective strength alterations of functional and structural connectivities in the DMN.
Results
Demographic information, neuropsychological and cognitive measures
Demographic information is listed in Table 1. There was no significant difference between the tea-drinking and the non-tea drinking groups in age (t34=0.92, p>0.05) and years of education (t34=0.95, p>0.05) using a two-tailed, two-sample t-test. A Chi-square test did not demonstrate any significant differences between the groups in the ratio of male to female participants (χ2(1)=1.85, p>0.05), or the ratio of left-handedness to right-handedness (χ2(1)=0.73, p>0.05). Coffee consumption was not significantly different between the groups (t34=-0.48, p>0.05). In the comparisons of neuropsychological and cognitive measures, one out of 12 measures were significantly different between the tea-drinking and the non-tea drinking groups according to the permutation test (see Figure 1). Higher performance was observed for the tea-drinking group in the Block Design test (corrected p=0.042).
Table 1. Demographic information of participants in this study.
| Tea drinking group | Non-tea drinking group | Statistic | Significance | ||||||||||||||||||||||||||||||||||||||||||||||||||||||||||||||||||||||||||||||||||||||||||||||||
| Age (Mean±STD) | 70.27±5.52 | 71.71±3.98 | t(34)=-0.92 | p=0.37a | |||||||||||||||||||||||||||||||||||||||||||||||||||||||||||||||||||||||||||||||||||||||||||||||
| Years of Education (Mean±STD) | 6.00±3.96 | 4.81±3.50 | t(34)=0.95 | p=0.35a | |||||||||||||||||||||||||||||||||||||||||||||||||||||||||||||||||||||||||||||||||||||||||||||||
| Gender (Male/Female) | 4/11 | 2/19 | χ2(1)=1.85 | p=0.17b | |||||||||||||||||||||||||||||||||||||||||||||||||||||||||||||||||||||||||||||||||||||||||||||||
| Handedness (Left/Right) | 0/15 | 1/20 | χ2(1)=0.73 | p=0.39b | |||||||||||||||||||||||||||||||||||||||||||||||||||||||||||||||||||||||||||||||||||||||||||||||
| a Two-tailed two-sample t-test | |||||||||||||||||||||||||||||||||||||||||||||||||||||||||||||||||||||||||||||||||||||||||||||||||||
| b Chi-square test | |||||||||||||||||||||||||||||||||||||||||||||||||||||||||||||||||||||||||||||||||||||||||||||||||||
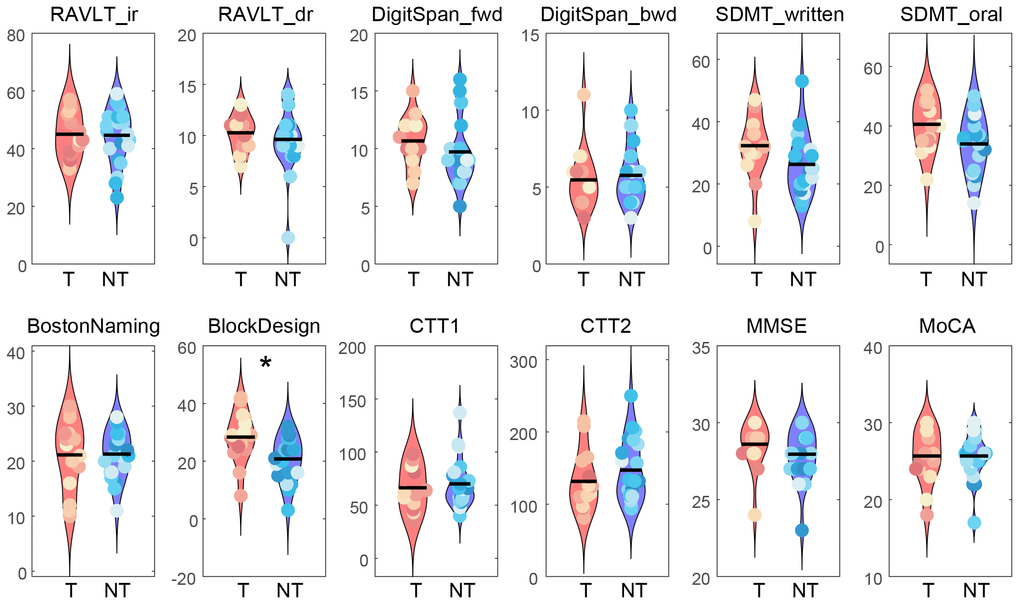
Figure 1. Comparisons of neuropsychological and cognitive measures between the tea drinking group (T) and non-tea drinking group (NT). A non-parametric permutation test was used to evaluate the significance level in group differences by permuting 10,000 times (* corrected p<0.05). Abbreviations: RAVLT_ir, Rey Auditory Verbal Learning Test with immediate recall; RAVLT_dr, Rey Auditory Verbal Learning Test with delayed recall; DigitSpan_fwd, forward Digit Span; DigitSpan_bwd, backward Digit Span; SDMT_written, Symbol Digit Modalities Test by written response; SDMT_oral, Symbol Digit Modalities Test by oral response; BostonNaming, Boston Naming Test; BlockDesign, Block Design tests from the Wechsler Adults Intelligence Scale (WAIS-III); CTT1, Color Trials Test 1; CTT2, Color Trials Test 2; MMSE, Mini-Mental State Examination, MoCA, Montreal Cognitive Assessment.
Graph theoretical analysis
No significant differences were found between the tea-drinking group and the non-tea drinking group in global functional network measures Cw, Lw, Eloc, and Eglob (p>0.05) (see Figure 2). In the structural network, significantly lower Lw (corrected p=0.044) and significantly higher Eglob (corrected p=0.044) were observed in the tea-drinking group, whilst no significant differences were found with Cw and Eloc (p>0.05). Similarly, we did not observe any significant differences in regional measures between the groups in the functional network, but we found 6 regions which were significantly different in the structural network (uncorrected p<0.01): right superior frontal gyrus (dorsal) [SFGdor.R], right middle frontal gyrus [MFG.R], left olfactory [OLF.L], left gyrus rectus [REC.L], left anterior cingulate and paracingulate gyri [ACG.L], and left lingual gyrus [LING.L], which primarily reside in the frontal cortex (see Figure 3).
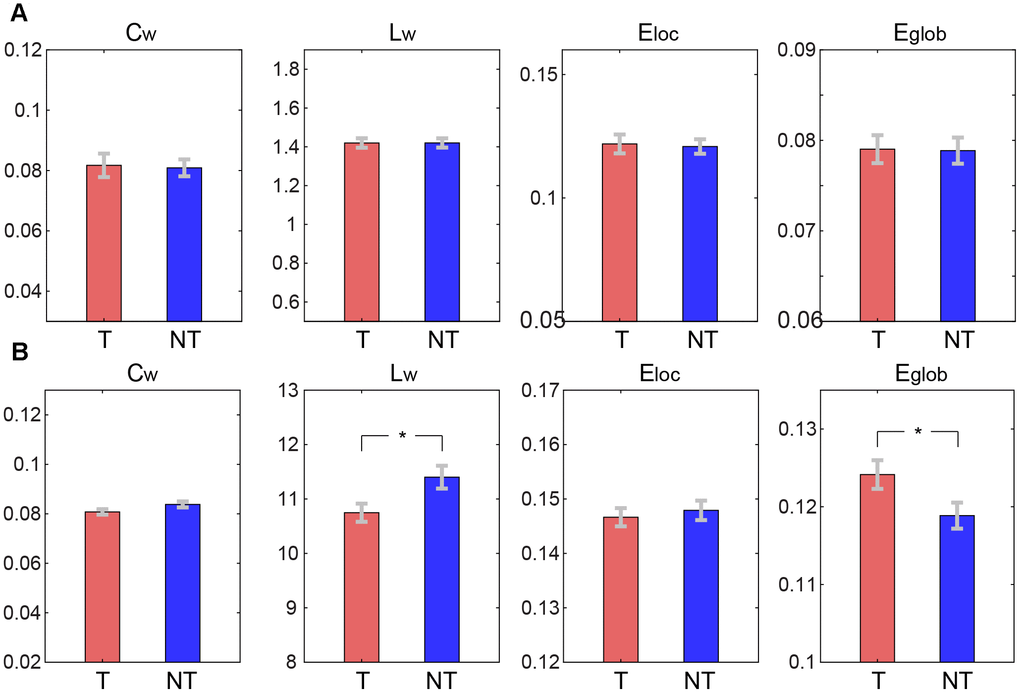
Figure 2. Comparisons of global graph theoretical metrics between tea drinking (T) and non-tea drinking groups (NT). (A) Metrics computed on the functional connectivity network. (B) Metrics calculated on the structural connectivity network. Asterisks represent significance level obtained by permutation test (* corrected p< 0.05).
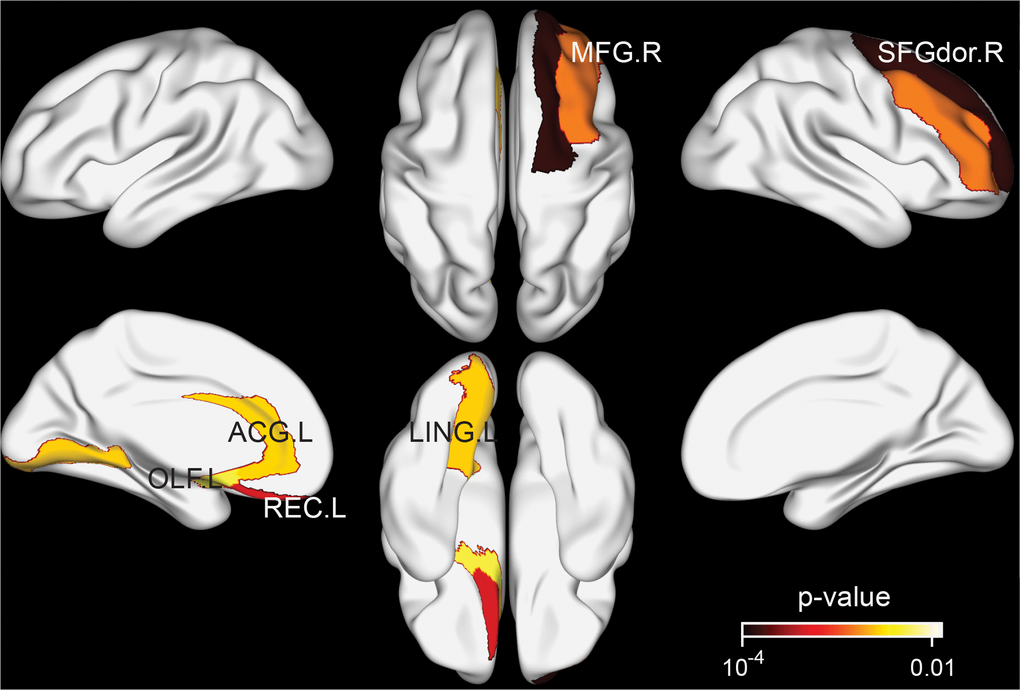
Figure 3. Brain regions exhibiting significant differences in structural nodal efficiency between the tea drinking group and the non-tea drinking group at the significance level of 0.01 (uncorrected) statistical evaluated by a permutation test.
Hemispheric asymmetry
The comparisons of hemispheric asymmetries of global graph theoretical metrics between the tea-drinking group and the non-tea drinking group are illustrated in Figure 4. Hemispheric asymmetries in Cw and Eloc were significantly different between the groups in the structural network (both, corrected p=0.018), exhibiting greater asymmetry between hemispheres in the non-tea drinking group. Both Lw and Eglob in the structural network and all metrics in the functional network were not significant in terms of asymmetry.
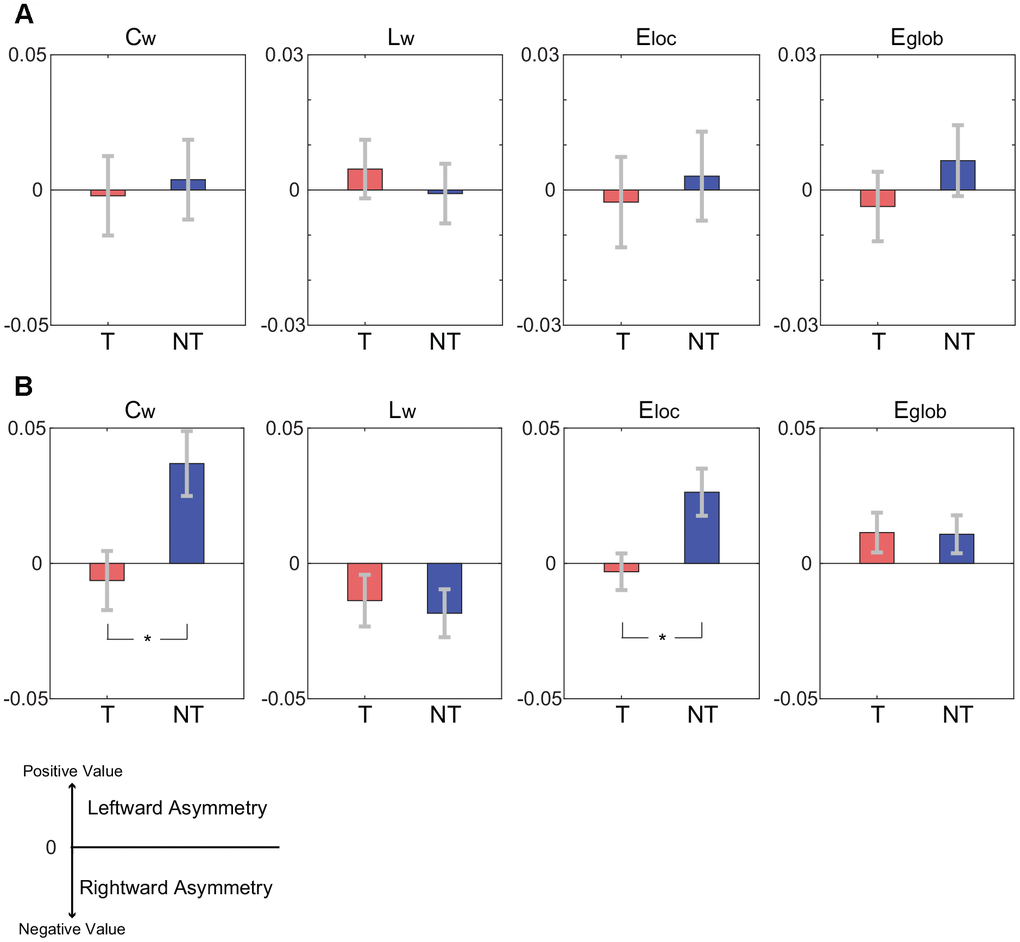
Figure 4. Comparisons of hemispheric asymmetries of global graph theoretical metrics between the tea-drinking group (denoted by T) and the non-tea drinking group (denoted by NT). A positive value in the hemispheric asymmetry indicates the leftward hemispheric asymmetry while a negative value indicates the rightward hemispheric asymmetry. Asterisks represent significance level obtained by permutation test (* corrected p< 0.05). (A) Hemispheric asymmetries of global graph theoretical metrics for functional connectivity network. (B) Hemispheric asymmetries of global graph theoretical metrics for structural connectivity network.
Default mode network
The exploration of strengths of connections within the default mode network revealed consistently increased strength of functional connectivity and the coexistence of increased and decreased strengths for the structural connectivity in the tea drinking group compared to the non-tea drinking group (See Figure 5). Specifically, eleven functional connections exhibited a significant enhancement in strength in the tea drinking group, in which the PCG, PHG, ANG were predominantly involved (see Figure 5A). There was no functional connection with a strength that was significantly decreased for the tea drinking group relative to the non-tea drinking group. Unlike in functional connections, strengths in the structural connections showed a pattern of both increases and decreases (see Figure 5B). The number of structural connections with significantly increased strength was comparable to that of structural connections with significantly decreased strength.
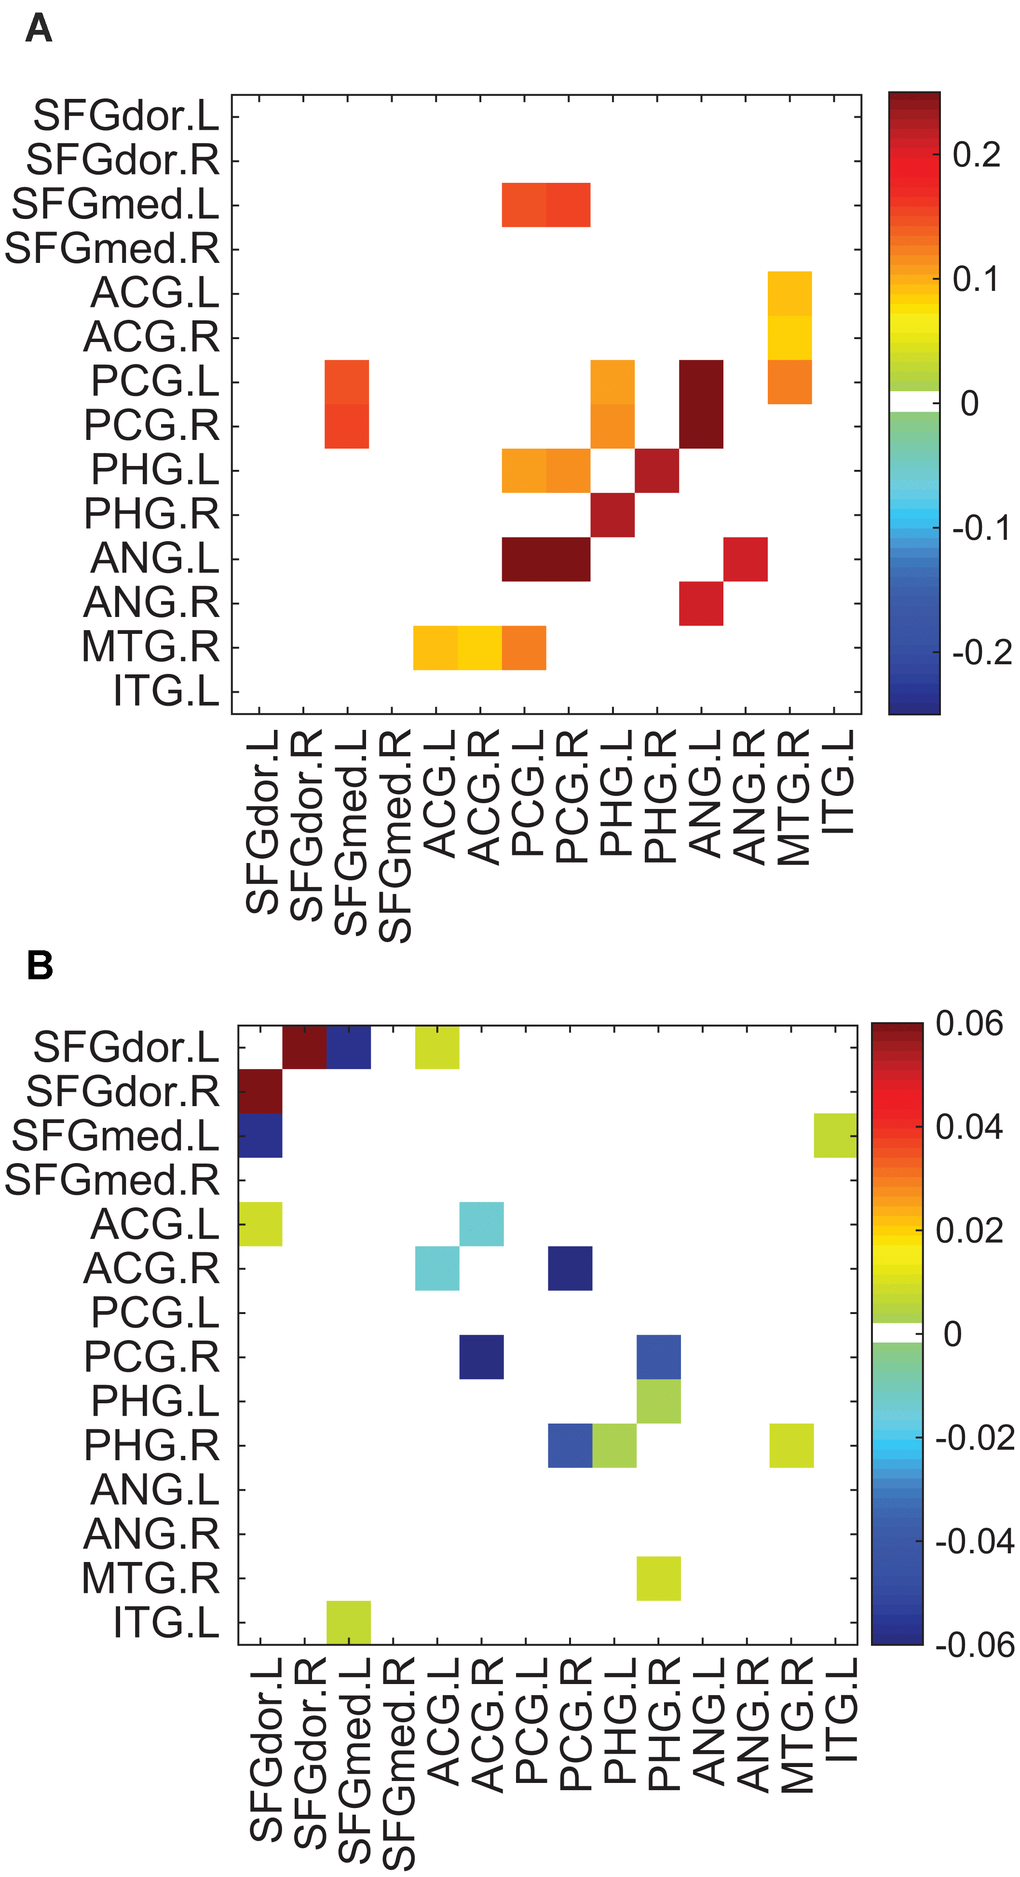
Figure 5. Connections with significantly different strengths between the tea drinking group and the non-tea drinking group within the default mode network. Significance was established by setting uncorrected p<0.05 with the permutation test. (A) Differences of connective strengths between the groups (tea drinking group minus non-tea drinking group) for significant connections in the functional network. (B) Differences of connective strengths between the groups for significant connections in the structural network.
Discussions
In this study, we comprehensively investigated both functional and structural networks from the perspectives of global and regional properties for the effect of habitual tea drinking on the human brain. The observations in this study partially support the hypothesis that tea drinking has positive effects on brain organization and gives rise to greater efficiency in functional and structural connectivities due to increased global network efficiency found in the brain structure of tea drinkers, but no significant enhancement in functional connectivity. As hypothesised, tea drinking leads to less leftward asymmetry in structural connectivity between hemispheres. In addition, we found that functional connectivity within the DMN was higher for the tea drinking group. A coexistence of increasing and decreasing connectivity strengths in the structural DMN was unveiled. These findings are consistent with the hypothesis that there is an association between tea drinking and connective strength alterations.
A large number of studies have suggested that the reduction of interregional connectivity is associated with brain ageing by means of diverse data analytics such as seed-based connectivity, predefined regions interconnections, and tractographic connectivity [34–39], which implies that a slower ageing brain should retain more connections between regions and milder disruption in connectivity resulting in higher efficiency for communications and information exchange between regions. Here, higher structural network efficiency was found in older adults who had habitual tea drinking. Relative to the non-tea drinking group, the tea drinking group had less topological distance between brain regions and more efficient interregional connectivity. This supports the hypothesis that the positive effects of habitual tea drinking are exerted on brain organization by preventing interregional connections from becoming disrupted. In addition to the significant effect of tea drinking on whole brain organization, a regional effect was also observed in this study, showing that tea intake resulted in higher nodal efficiency. The majority of these regions reside in the frontal cortex, which is in agreement with the previous finding that the frontal region is involved in age-related alterations of structural connectivity [34].
In contrast to structural connectivity, functional connectivity did not exhibit any significant difference in both global graph theoretical metrics and regional metrics. Habitual tea drinking did not give rise to observable changes in brain functional connectivity relative to non-tea drinking. If differences in functional connectivity do exist, then they may be masked by the well-known compensatory mechanism [40]. The loss of structural connectivity might be compensated for by greater functional activity so as to preserve equivalent function corresponding to intact structural connectivity [41]. Another possible explanation is that abnormalities in functional connectivity are too subtle to manifest in measures of connectivity efficiency. These two possible explanations are compatible; that is, a subtle change was residual after the compensation counteracting detrimental alterations. However, the effect of compensation is finite [40] and cannot always completely offset the decrement in cognitive performance. This was supported by the results of the neuropsychological measures. Greater visuospatial functioning was observed in older adults with tea drinking compared to older adults without tea drinking based on the test of Block Design, while no significant difference was found in the other measures. Our observation suggests that tea consumption might provide a beneficial effect that cannot be derived from compensation to facilitate the implementation of cognitive tasks.
In the comparison of hemispheric asymmetry between the tea drinking group and non-tea drinking group, the suppression of hemispheric asymmetry in structural connectivity was associated with tea drinking, tending to be more symmetric in structural connectivity. Specifically, the non-tea drinking group exhibited significantly leftward asymmetry in the clustering coefficient and local efficiency, and thus the segregation of connectivity networks was distinct between brain hemispheres. This hemispheric asymmetry in structural connectivity has been associated with brain ageing [42]. Moreover, leftward asymmetry in structural connectivity was found in healthy older adults [33]. Collectively, previous studies have suggested a U-shaped developmental trajectory in hemispheric asymmetry from leftward asymmetry to rightward asymmetry to leftward asymmetry again across the lifespan from childhood to middle age to old age [33, 42–45]. Taken together, the suppression of leftward asymmetry in structural connectivity suggests that tea intake could slow age-related alterations towards leftward asymmetry and retain a pattern more similar to that of the middle age (i.e., rightward asymmetry). In addition, we found six significantly differential regions between the groups, which showed greater efficiency in the tea-drinking group. These regions included MFG, SFGdor, and ACG, which were also found to have an age-related association in a previous study [33]. This suggests that tea plays a beneficial role in the preservation of efficiency between brain regions. The differentiation of hemispheric asymmetry between the tea-drinking group and the non-tea drinking group might underpin significant manifestations between the groups in visuospatial functioning and information processing, as the right hemisphere is more specialized for visuospatial processing [46]. Similar to the results of the whole-cerebrum functional connectivity, global metrics in the hemispheric asymmetry were not significantly affected by tea drinking. This observation was in accordance with a previous finding of less overall alterations in functional connectivity relative to structural connectivity [33]. These results together allow speculation that structural global metrics are more sensitive to subtle alterations in the brain compared to functional global metrics in terms of overall connectivity at the network scale. This might not be the case for individual connections.
The Default mode network (DMN) functional connectivity has been extensively investigated as it related to the neurodegenerative brain [31, 32, 47–49]. A general finding is that suppressed activity and decreased functional connectivity in the DMN during rest is associated with cognitive decline [48–50]. Decreased functional connectivity linked to cognitive decline can be hindered or mitigated by tea intake according to the observation of stronger functional connectivity in the tea-drinking group. As is known, regions in the DMN are consistently found to be active and interconnected during the resting state [51] and engage in the preparation of a task implementation [52]. Stronger functional connectivity between regions of the DMN is related to better preparedness for task implementation. Therefore, the stronger functional connectivity in the DMN observed in the tea-drinking group may reflect the contribution of tea consumption to efficient network organization. Unlike functional connectivity, effects in structural connectivity in the DMN were of differing directions, with increasing connective strengths in some connections, but decreasing strengths for the others. We speculate that the coexistence of increased and decreased structural connectivity might be attributed to new, alternative paths established to replace disruption to existing routes.
Prior to our study, only two studies attempted to discover the relationship between tea intake and functional connectivity [29, 30]. Schmidt and colleagues found a significant increase in the functional connectivity strength between the right superior parietal lobule (SPL) and the right middle frontal gyrus (MFG) due to tea consumption [30]. The increase of functional connectivity strength was also observed in a comparative study [29]. Our study corroborated the previous notion that tea intake enhanced the strengths of specific functional connections and provided further insight that tea intake did not lead to a significant change in overall functional connectivity. In contrast to these two studies that focused on a few task-related brain regions for functional connectivity, our study investigated both global and regional functional connectivity and further elucidated the relationship between structural connectivity and tea drinking. Furthermore, these studies used a within-subject, short-term, tea intervention design [29, 30], whilst the current study performed a cross-sessional investigation to complement their studies.
Although our study was comprehensive and the findings were intriguing, the following limitations and considerations should be noted. The number of participants in our study was almost twice the numbers employed previously [29, 30]. However, the sample size was still limited. This was partially due to strict inclusion criteria which ensured that the participants in the tea drinking group had a habit of frequently drinking tea, while the participants in the non-tea drinking rarely or never drunk any kinds of tea to enhance the confidence of the findings. In our case, we initially recruited 93 participants, but only 15 and 21 participants remained in the tea-drinking group and non-tea drinking group, respectively.
Other substances might interfere with the outcome of the effect of tea drinking on brain connectivity. Coffee is one of the beverages that affect outcomes as it contains caffeine that is also one of the main active constituents of tea. However, coffee consumption between the tea-drinking group and the non-tea drinking group was not significantly different between the groups. Although there were no significant differences in demographic factors, environmental factors could have a confounding effect on brain network properties. For the nature of exploratory purpose, p-values were not corrected in the comparisons of regional properties between the tea drinking and non-tea drinking groups. Therefore, some of detected regions or connections may have occurred by chance. The results of regional properties provide heuristic information for further studies.
In summary, our study comprehensively investigated the effects of tea drinking on brain connectivity at both global and regional scales using multi-modal imaging data (i.e., functional and structural imaging) and provided the first compelling evidence that tea drinking positively contributes to brain structure making network organization more efficient. Our study suggests that tea drinking is effective in preventing (slowing) or ameliorating cognitive decline and that tea drinking might be a simple lifestyle choice that benefits brain health.
Materials and Methods
Participants
Older participants were recruited from residential communities in Singapore by door-to-door visits. Trained research nurses and psychologists assessed participants to exclude those who had one or more conditions including dementia (Clinical Dementia Rating (CDR) global score>0), terminal illness, stroke, aphasia, marked hearing impairment, or any psychiatric or psychological problems. A set of neuropsychological and cognitive measures comprising the Rey Auditory Verbal Learning Test (RAVLT) [53], the Digit Span and Block Design tests from the Wechsler Adults Intelligence Scale (WAIS-III) [54], the Symbol Digit Modalities Test (SDMT) [55], the Boston Naming Test [56], the Color Trials Test 1 & 2 (CTT1 & CTT2) [57], the Singapore modified Mini-Mental State Examination (MMSE) [58, 59], and the Montreal Cognitive Assessment (MoCA) [60] were administered to participants. In this first wave of recruitment, a total of 93 participants attended the assessment and were subsequently recruited to a separate randomized controlled intervention trial in Singapore [61].
Recruited participants were stratified into two groups according to a composite score of tea drinking frequency, resulting in tea drinking and non-tea drinking groups. Drinking frequencies of green tea, oolong tea, black tea, and coffee were collected on a categorical scale ranging from 1 to 6 (see Table 2). Participants were required to recall their tea drinking habits, completing a questionnaire with drinking frequencies at age around 45 years and at present. The frequency scales of the three kinds of tea were first summed up separately for age around 45 years and the present, and then averaged across ages to obtain the composite score. If a participant had the composite score greater than or equal to 8, he/she was assigned to the tea drinking group. For example, a composite scale of 8 means that either two kinds of tea were simultaneously drunk at least 1-3 times a week, or one kind of tea was drunk 4-6 times a week or more, on average. Participants with the composite score of 3 (i.e. rarely or never drunk any kinds of tea) were assigned to the non-tea drinking group. This screening results in 15 participants in the tea drinking group and 21 participants in the non-tea drinking group. Demographic information is shown in Table 1.
Table 2. The scale of tea drinking frequency.
| Scale | Description |
| 1 | Never or rarely |
| 2 | More than once a month but less than once a week |
| 3 | 1-3 times a week |
| 4 | 4-6 times a week |
| 5 | 1-2 times a day |
| 6 | Greater than or equal to 3 times a day |
The protocol was reviewed and approved by the Institutional Review Board of the National University of Singapore. Written, informed consent to participate in the study was provided by participants after they were given detailed information on the study.
MRI data acquisition
MRI data were acquired by a 32-channel head coil on a 3T Prisma Siemens scanner (Siemens, Erlangen, Germany) located at the Clinical Imaging Research Centre (CIRC) of the National University of Singapore. T1-weighted images were acquired using a 3D magnetization-prepared rapid gradient-echo sequence with the parameters: repetition time [TR] = 2300 ms, echo time [TE] = 2.03 ms; field of view [FOV] = 256 × 256 mm2; slice thickness = 1mm, 176 slices, flip angle = 9°; acquisition matrix = 256 × 256; in-plane resolution = 1 × 1 mm2, which were utilized for co-registration, normalization, and cortical parcellation during data preprocessing.
Diffusion encoded images were acquired using a single-shot echo-planar sequence with 63 2-mm thick slices with no gap, TR = 8500 ms, TE = 96 ms, FOV = 192 × 192 mm2, acquisition matrix = 96 × 96; in-plane resolution = 2 × 2 mm2, b-value = [350 650 1000 1300 1600] s/mm2; 1 baseline image with b0 = 0 s/mm2. Each high b-value was acquired from 12 separate nonparallel diffusion directions.
Two hundred and ten (210) fMRI scans were obtained whilst participants rested with their eyes closed using the following echo-planar pulse sequence parameters: TR = 2550 ms, TE = 30 ms, FOV = 192 × 192 mm2, 42 slices, slice thickness = 3 mm, flip angle = 78°, acquisition matrix = 64 × 64, in-plane resolution = 3 × 3 mm2. These data were collected in a single scanning session. During scanning, earplugs were used to reduce the effect of scanner noise on participants and foam pads were used to minimize head motion.
Data processing
Functional MRI was preprocessed by initially excluding the first ten volumes, followed by slice timing correction, head motion correction, local of the parenchyma, signal regression (including regressors of 24 head-motion parameters, and time-series in cerebrospinal fluid and white matter), spatial normalization to the Montreal Neurological Institute (MNI) space using the T1-weighted image, spatial smoothing with a 4.5-mm full width half-maximum Gaussian kernel, and temporal band-pass filtering (0.01 Hz ~ 0.1 Hz) to mitigate the effects of low frequency drift and high frequency physiological noise. To eliminate the interference of large head motions, participants were excluded if the maximal inter-scan motion exceeded 2 mm translation or 2 degrees rotation in any direction or the average frame-wise displacement (FD) exceeded 1 mm in the residual effect of head motion, according to the root mean square of FD [62]. With these criteria, no participant was excluded. Preprocessing was carried out using the statistical parametric mapping (SPM12 http://www.fil.ion.ucl.ac.uk/spm/software/spm12/), resting-state fMRI data analysis toolkit (REST) [63], and data processing assistant for resting-state fMRI (DPARSF) [64].
Diffusion-weighted images were realigned and corrected for head motion and eddy current distortions [62]. A diffusion tensor was fitted to each voxel within the brain parenchyma. A widely used deterministic streamline tracking algorithm was then utilized to identify white matter tracts, with the tracking starting from the deep white matter regions and terminating at a voxel either due to a turning angle >45º or a fractional anisotropy <0.15. The preprocessing of diffusion-weighted images was performed using the functional magnetic resonance imaging of the brain (FMRIB) Software Library in Version 5.0 (FSL, [65]), diffusion toolkit [66], and PANDA [67].
A previously validated Automated Anatomical Labeling (AAL) template [68] was employed to parcellate the cerebrum into 90 regions of interest (ROIs). We applied the same parcellation to both functional and diffusion data to enable direct comparison. Functional connectivity strength between a pair of ROIs was obtained by calculating the Pearson correlation coefficient between time series derived from averaging the time series of each voxel within each ROI. Structural connectivity strength between pairs of ROIs was computed as the number of streamlines normalized by the volumes of the two ROIs to eliminate bias due to different sizes [69]. Connectivity strengths of all possible pairs of ROIs were collected to construct a connectivity network, resulting in one functional connectivity network and one structural connectivity network for each participant.
Data analysis
Graph theoretical analysis is a powerful and quantitative method to evaluate the properties of connectivity networks and has been being widely used in brain imaging studies. In this study, we explored both global and regional properties of functional and structural connectivity networks. The properties of local clustering and integration of connectivity networks were ascertained by the metrics of weighted clustering coefficient (Cw) and characteristic path length (Lw) [70, 71]. Local efficiency (Eloc) and global efficiency (Eglob) were utilized to characterize connectivity network efficiency [72], reflecting the efficiency of brain organization. A regional property was evaluated with the nodal efficiency [73], assessing the information transmission capability of an ROI.
To remove spurious connections from functional networks, a sparsity threshold was applied to only retain the connections with connective strengths above the threshold. Since there is no definitive method to determine the sparsity threshold [73], we calculated each network metric for the entire network (size: 90×90) at a series of thresholds ranging from 0.1 to 0.4 with an incremental step of 0.01, and then took the integral over these values to obtain a final quantity that was tested for between-group differences.
In the exploration of hemispheric asymmetry, inter-hemispheric connections were excluded and intra-hemispheric connections were divided into two connectivity sub-networks (size: 45×45) corresponding to the left and right hemispheres. The metrics were separately computed for the two sub-networks, X(L) and X®, for left and right hemispheres respectively [33] and the hemispheric asymmetry of a metric was then obtained by: [X(L) – X®] / [X(L) + X®], and then compared between groups. A positive value in the hemispheric asymmetry indicates the leftward hemispheric asymmetry while a negative value indicates the rightward hemispheric asymmetry.
We selected AAL atlas-based regions which belong to the default mode network (DMN), identified by previous work [74]: SFGdor.L, SFGdor.R, SFGmed.L, SFGmed.R, ACG.L, ACG.R, PCG.L, PCG.R, PHG.L, PHG.R, ANG.L, ANG.R, MTG.R, and ITG.L. Full names of the regions can be found in the Supplementary Table 1. Connectivity strengths amongst these selected regions were compared between the tea drinking and non-tea drinking groups.
All statistical evaluations in this study were performed by non-parametric permutation tests [75] unless otherwise stated. Specifically, the null hypothesis was that there was no difference in a variable between the tea-drinking group and the non-tea drinking group. P-values were obtained from null distributions estimated from 10,000 permutations of group labels. The threshold for significance was set a p<0.05 after the false discovery rate (FDR) correction (adopted the Benjamini and Hochberg procedure [76]) for the comparisons of global properties and neuropsychological measures. P-values were not corrected in the comparisons of regional properties for the exploratory purposes.
Supplementary Materials
Acknowledgments
This work was supported by grants from the National Natural Science Foundation of China (Grant No. 61806149) awarded to JL; the National Medical Research Council of Singapore (grant number NMRC/TA/0053/2016) and the National Innovation Challenge on Active and Confident Ageing Programme, Ministry of Health of Singapore (grant number MOH/NIC/COG06/2017) awarded to LF; RRG was supported by the Guarantors of Brain.
Conflicts of Interest
We declare that the funders had no role in study design, implementation and data analysis, decision to publish, or preparation for the manuscript. The protocol was reviewed and approved by the Institutional Review Board of the National University of Singapore. Written, informed consent to participate in the study was provided by participants after they were given detailed information on the study. All authors have no conflict of interest to report.
References
- 1. Hoffmann F, Manning M. Herbal Medicine and Botanical Medical Fads. ed. New York: Haworth Press; 2002. 202 pp.
- 2. Yoto A, Motoki M, Murao S, Yokogoshi H. Effects of L-theanine or caffeine intake on changes in blood pressure under physical and psychological stresses. J Physiol Anthropol. 2012; 31:28. https://doi.org/10.1186/1880-6805-31-28 [PubMed]
- 3. Kimura K, Ozeki M, Juneja LR, Ohira H. L-Theanine reduces psychological and physiological stress responses. Biol Psychol. 2007; 74:39–45. https://doi.org/10.1016/j.biopsycho.2006.06.006 [PubMed]
- 4. Feng L, Li J, Kua EH, Lee TS, Yap KB, John Rush A, Ng TP. Association between tea consumption and depressive symptoms in older Chinese adults. J Am Geriatr Soc. 2012; 60:2358–60. https://doi.org/10.1111/jgs.12011 [PubMed]
- 5. Ng TP, Feng L, Niti M, Kua EH, Yap KB. Tea consumption and cognitive impairment and decline in older Chinese adults. Am J Clin Nutr. 2008; 88:224–31. https://doi.org/10.1093/ajcn/88.1.224 [PubMed]
- 6. Chin AV, Robinson DJ, O’Connell H, Hamilton F, Bruce I, Coen R, Walsh B, Coakley D, Molloy A, Scott J, Lawlor BA, Cunningham CJ. Vascular biomarkers of cognitive performance in a community-based elderly population: the Dublin Healthy Ageing study. Age Ageing. 2008; 37:559–64. https://doi.org/10.1093/ageing/afn144 [PubMed]
- 7. Kuriyama S, Hozawa A, Ohmori K, Shimazu T, Matsui T, Ebihara S, Awata S, Nagatomi R, Arai H, Tsuji I. Green tea consumption and cognitive function: a cross-sectional study from the Tsurugaya Project 1. Am J Clin Nutr. 2006; 83:355–61. https://doi.org/10.1093/ajcn/83.2.355 [PubMed]
- 8. Feng L, Chong MS, Lim WS, Gao Q, Nyunt MS, Lee TS, Collinson SL, Tsoi T, Kua EH, Ng TP. Tea consumption reduces the incidence of neurocognitive disorders: findings from the Singapore longitudinal aging study. J Nutr Health Aging. 2016; 20:1002–09. https://doi.org/10.1007/s12603-016-0687-0 [PubMed]
- 9. Cheng TO. All teas are not created equal: the Chinese green tea and cardiovascular health. Int J Cardiol. 2006; 108:301–08. https://doi.org/10.1016/j.ijcard.2005.05.038 [PubMed]
- 10. Imai K, Suga K, Nakachi K. Cancer-preventive effects of drinking green tea among a Japanese population. Prev Med. 1997; 26:769–75. https://doi.org/10.1006/pmed.1997.0242 [PubMed]
- 11. Cao Y, Cao R. Angiogenesis inhibited by drinking tea. Nature. 1999; 398:381. https://doi.org/10.1038/18793 [PubMed]
- 12. Mukamal KJ, Maclure M, Muller JE, Sherwood JB, Mittleman MA. Tea consumption and mortality after acute myocardial infarction. Circulation. 2002; 105:2476–81. https://doi.org/10.1161/01.CIR.0000017201.88994.F7 [PubMed]
- 13. Ruan R, Feng L, Li J, Ng TP, Zeng Y. Tea consumption and mortality in the oldest-old Chinese. J Am Geriatr Soc. 2013; 61:1937–42. https://doi.org/10.1111/jgs.12498 [PubMed]
- 14. De la Torre R, De Sola S, Pons M, Duchon A, de Lagran MM, Farré M, Fitó M, Benejam B, Langohr K, Rodriguez J, Pujadas M, Bizot JC, Cuenca A, et al. Epigallocatechin-3-gallate, a DYRK1A inhibitor, rescues cognitive deficits in Down syndrome mouse models and in humans. Mol Nutr Food Res. 2014; 58:278–88. https://doi.org/10.1002/mnfr.201300325 [PubMed]
- 15. Xicota L, Rodriguez-Morato J, Dierssen M, de la Torre R. Potential Role of (-)-Epigallocatechin-3-Gallate (EGCG) in the Secondary Prevention of Alzheimer Disease. Curr Drug Targets. 2017; 18:174–95. https://doi.org/10.2174/1389450116666150825113655 [PubMed]
- 16. Liu Y, Fly AD, Wang Z, Klaunig JE. The Effects of Green Tea Extract on Working Memory in Healthy Women. J Nutr Health Aging. 2018; 22:446–50. https://doi.org/10.1007/s12603-017-0962-8 [PubMed]
- 17. Jarvis MJ. Does caffeine intake enhance absolute levels of cognitive performance? Psychopharmacology (Berl). 1993; 110:45–52. https://doi.org/10.1007/BF02246949 [PubMed]
- 18. Cao C, Loewenstein DA, Lin X, Zhang C, Wang L, Duara R, Wu Y, Giannini A, Bai G, Cai J, Greig M, Schofield E, Ashok R, et al. High Blood caffeine levels in MCI linked to lack of progression to dementia. J Alzheimers Dis. 2012; 30:559–72. https://doi.org/10.3233/JAD-2012-111781 [PubMed]
- 19. West RK, Ravona-Springer R, Livny A, Heymann A, Shahar D, Leroith D, Preiss R, Zukran R, Silverman JM, Schnaider-Beeri M. Age Modulates the Association of Caffeine Intake With Cognition and With Gray Matter in Elderly Diabetics. J Gerontol A Biol Sci Med Sci. 2018; 74:683–88. https://doi.org/10.1093/gerona/gly090 [PubMed]
- 20. Kelly SP, Gomez-Ramirez M, Montesi JL, Foxe JJ. L-theanine and caffeine in combination affect human cognition as evidenced by oscillatory alpha-band activity and attention task performance. J Nutr. 2008; 138:1572S–77S. https://doi.org/10.1093/jn/138.8.1572S [PubMed]
- 21. Haskell CF, Kennedy DO, Milne AL, Wesnes KA, Scholey AB. The effects of L-theanine, caffeine and their combination on cognition and mood. Biol Psychol. 2008; 77:113–22. https://doi.org/10.1016/j.biopsycho.2007.09.008 [PubMed]
- 22. Feng L, Chong MS, Lim WS, Lee TS, Kua EH, Ng TP. Tea for Alzheimer Prevention. J Prev Alzheimers Dis. 2015; 2:136–41. https://doi.org/10.14283/jpad.2015.57 [PubMed]
- 23. Mancini E, Beglinger C, Drewe J, Zanchi D, Lang UE, Borgwardt S. Green tea effects on cognition, mood and human brain function: A systematic review. Phytomedicine. 2017; 34:26–37. https://doi.org/10.1016/j.phymed.2017.07.008 [PubMed]
- 24. Wightman EL, Haskell CF, Forster JS, Veasey RC, Kennedy DO. Epigallocatechin gallate, cerebral blood flow parameters, cognitive performance and mood in healthy humans: a double-blind, placebo-controlled, crossover investigation. Hum Psychopharmacol. 2012; 27:177–86. https://doi.org/10.1002/hup.1263 [PubMed]
- 25. Scholey A, Downey LA, Ciorciari J, Pipingas A, Nolidin K, Finn M, Wines M, Catchlove S, Terrens A, Barlow E, Gordon L, Stough C. Acute neurocognitive effects of epigallocatechin gallate (EGCG). Appetite. 2012; 58:767–70. https://doi.org/10.1016/j.appet.2011.11.016 [PubMed]
- 26. Li J, Lim J, Chen Y, Wong K, Thakor N, Bezerianos A, Sun Y. Mid-Task Break Improves Global Integration of Functional Connectivity in Lower Alpha Band. Front Hum Neurosci. 2016; 10:304. https://doi.org/10.3389/fnhum.2016.00304 [PubMed]
- 27. Ferreira LK, Busatto GF. Resting-state functional connectivity in normal brain aging. Neurosci Biobehav Rev. 2013; 37:384–400. https://doi.org/10.1016/j.neubiorev.2013.01.017 [PubMed]
- 28. Bassett DS, Bullmore E, Verchinski BA, Mattay VS, Weinberger DR, Meyer-Lindenberg A. Hierarchical organization of human cortical networks in health and schizophrenia. J Neurosci. 2008; 28:9239–48. https://doi.org/10.1523/JNEUROSCI.1929-08.2008 [PubMed]
- 29. Carmichael OT, Pillai S, Shankapal P, McLellan A, Kay DG, Gold BT, Keller JN. A Combination of Essential Fatty Acids, Panax Ginseng Extract, and Green Tea Catechins Modifies Brain fMRI Signals in Healthy Older Adults. J Nutr Health Aging. 2018; 22:837–46. https://doi.org/10.1007/s12603-018-1028-2 [PubMed]
- 30. Schmidt A, Hammann F, Wölnerhanssen B, Meyer-Gerspach AC, Drewe J, Beglinger C, Borgwardt S. Green tea extract enhances parieto-frontal connectivity during working memory processing. Psychopharmacology (Berl). 2014; 231:3879–88. https://doi.org/10.1007/s00213-014-3526-1 [PubMed]
- 31. Baggio HC, Segura B, Sala-Llonch R, Marti MJ, Valldeoriola F, Compta Y, Tolosa E, Junqué C. Cognitive impairment and resting-state network connectivity in Parkinson’s disease. Hum Brain Mapp. 2015; 36:199–212. https://doi.org/10.1002/hbm.22622 [PubMed]
- 32. Damoiseaux JS, Beckmann CF, Arigita EJ, Barkhof F, Scheltens P, Stam CJ, Smith SM, Rombouts SA. Reduced resting-state brain activity in the “default network” in normal aging. Cereb Cortex. 2008; 18:1856–64. https://doi.org/10.1093/cercor/bhm207 [PubMed]
- 33. Sun Y, Li J, Suckling J, Feng L. Asymmetry of hemispheric network topology reveals dissociable processes between functional and structural brain connectome in community-living elders. Front Aging Neurosci. 2017; 9:361. https://doi.org/10.3389/fnagi.2017.00361 [PubMed]
- 34. Zhao T, Cao M, Niu H, Zuo XN, Evans A, He Y, Dong Q, Shu N. Age-related changes in the topological organization of the white matter structural connectome across the human lifespan. Hum Brain Mapp. 2015; 36:3777–92. https://doi.org/10.1002/hbm.22877 [PubMed]
- 35. Geerligs L, Renken RJ, Saliasi E, Maurits NM, Lorist MM. A Brain-Wide Study of Age-Related Changes in Functional Connectivity. Cereb Cortex. 2015; 25:1987–99. https://doi.org/10.1093/cercor/bhu012 [PubMed]
- 36. Andrews-Hanna JR, Snyder AZ, Vincent JL, Lustig C, Head D, Raichle ME, Buckner RL. Disruption of large-scale brain systems in advanced aging. Neuron. 2007; 56:924–35. https://doi.org/10.1016/j.neuron.2007.10.038 [PubMed]
- 37. Wang L, Laviolette P, O’Keefe K, Putcha D, Bakkour A, Van Dijk KR, Pihlajamäki M, Dickerson BC, Sperling RA. Intrinsic connectivity between the hippocampus and posteromedial cortex predicts memory performance in cognitively intact older individuals. Neuroimage. 2010; 51:910–17. https://doi.org/10.1016/j.neuroimage.2010.02.046 [PubMed]
- 38. Gong G, Rosa-Neto P, Carbonell F, Chen ZJ, He Y, Evans AC. Age- and gender-related differences in the cortical anatomical network. J Neurosci. 2009; 29:15684–93. https://doi.org/10.1523/JNEUROSCI.2308-09.2009 [PubMed]
- 39. Onoda K, Ishihara M, Yamaguchi S. Decreased functional connectivity by aging is associated with cognitive decline. J Cogn Neurosci. 2012; 24:2186–98. https://doi.org/10.1162/jocn_a_00269 [PubMed]
- 40. Reuter-Lorenz PA, Cappell KA. Neurocognitive Aging and the Compensation Hypothesis. Curr Dir Psychol Sci. 2008; 17:177–82. https://doi.org/10.1111/j.1467-8721.2008.00570.x
- 41. Daselaar SM, Iyengar V, Davis SW, Eklund K, Hayes SM, Cabeza RE. Less wiring, more firing: low-performing older adults compensate for impaired white matter with greater neural activity. Cereb Cortex. 2015; 25:983–90. https://doi.org/10.1093/cercor/bht289 [PubMed]
- 42. Caeyenberghs K, Leemans A. Hemispheric lateralization of topological organization in structural brain networks. Hum Brain Mapp. 2014; 35:4944–57. https://doi.org/10.1002/hbm.22524 [PubMed]
- 43. Iturria-Medina Y, Pérez Fernández A, Morris DM, Canales-Rodríguez EJ, Haroon HA, García Pentón L, Augath M, Galán García L, Logothetis N, Parker GJ, Melie-García L. Brain hemispheric structural efficiency and interconnectivity rightward asymmetry in human and nonhuman primates. Cereb Cortex. 2011; 21:56–67. https://doi.org/10.1093/cercor/bhq058 [PubMed]
- 44. Zhong S, He Y, Shu H, Gong G. Developmental changes in topological asymmetry between hemispheric brain white matter networks from adolescence to young adulthood. Cereb Cortex. 2017; 27:2560–70. https://doi.org/10.1093/cercor/bhw109 [PubMed]
- 45. Ratnarajah N, Rifkin-Graboi A, Fortier MV, Chong YS, Kwek K, Saw SM, Godfrey KM, Gluckman PD, Meaney MJ, Qiu A. Structural connectivity asymmetry in the neonatal brain. Neuroimage. 2013; 75:187–94. https://doi.org/10.1016/j.neuroimage.2013.02.052 [PubMed]
- 46. Halligan PW, Fink GR, Marshall JC, Vallar G. Spatial cognition: evidence from visual neglect. Trends Cogn Sci. 2003; 7:125–33. https://doi.org/10.1016/S1364-6613(03)00032-9 [PubMed]
- 47. Petrella JR, Sheldon FC, Prince SE, Calhoun VD, Doraiswamy PM. Default mode network connectivity in stable vs progressive mild cognitive impairment. Neurology. 2011; 76:511–17. https://doi.org/10.1212/WNL.0b013e31820af94e [PubMed]
- 48. Greicius MD, Srivastava G, Reiss AL, Menon V. Default-mode network activity distinguishes Alzheimer’s disease from healthy aging: evidence from functional MRI. Proc Natl Acad Sci USA. 2004; 101:4637–42. https://doi.org/10.1073/pnas.0308627101 [PubMed]
- 49. Rombouts SA, Barkhof F, Goekoop R, Stam CJ, Scheltens P. Altered resting state networks in mild cognitive impairment and mild Alzheimer’s disease: an fMRI study. Hum Brain Mapp. 2005; 26:231–39. https://doi.org/10.1002/hbm.20160 [PubMed]
- 50. van den Heuvel MP, Hulshoff Pol HE. Exploring the brain network: a review on resting-state fMRI functional connectivity. Eur Neuropsychopharmacol. 2010; 20:519–34. https://doi.org/10.1016/j.euroneuro.2010.03.008 [PubMed]
- 51. Greicius MD, Krasnow B, Reiss AL, Menon V. Functional connectivity in the resting brain: a network analysis of the default mode hypothesis. Proc Natl Acad Sci USA. 2003; 100:253–58. https://doi.org/10.1073/pnas.0135058100 [PubMed]
- 52. Koshino H, Minamoto T, Yaoi K, Osaka M, Osaka N. Coactivation of the Default Mode Network regions and Working Memory Network regions during task preparation. Sci Rep. 2014; 4:5954. https://doi.org/10.1038/srep05954 [PubMed]
- 53. Rey A. L’examen Clinique en Psychologie. ed. Paris: Presses universitaires de France; 1964. [Internet], Available from http://www.worldcat.org/title/%0Aexamen-clinique-en-psychologie/oclc/53546324.
- 54. Wechsler D. Wechsler Memory Scale-Third Edition (WMS-III). San Antonio: TX: The Psychological Corporation. 1997. https://doi.org/10.1037/t49755-000
- 55. Smith A. Symbol Digit Modalities Test: Manual [Internet]. 2013. Available from: https://www.parinc.com/Products/Pkey/395.
- 56. Kaplan E, Goodglass H, Weintraub S. Boston Naming Test. Philadelphia (PA): Lea and Febiger; 1983.
- 57. D’Elia LF, Satz P, Uchiyama CL, White T. Color Trails Test. Odessa: Psychological Assessment Resources (PAR); 1996.
- 58. Feng L, Chong MS, Lim WS, Ng TP. The Modified Mini-Mental State Examination test: normative data for Singapore Chinese older adults and its performance in detecting early cognitive impairment. Singapore Med J. 2012; 53:458–62. [PubMed]
- 59. Folstein MF, Folstein SE, McHugh PR. “Mini-mental state”. A practical method for grading the cognitive state of patients for the clinician. J Psychiatr Res. 1975; 12:189–98. https://doi.org/10.1016/0022-3956(75)90026-6 [PubMed]
- 60. Nasreddine ZS, Phillips NA, Bédirian V, Charbonneau S, Whitehead V, Collin I, Cummings JL, Chertkow H. The Montreal Cognitive Assessment, MoCA: a brief screening tool for mild cognitive impairment. J Am Geriatr Soc. 2005; 53:695–99. https://doi.org/10.1111/j.1532-5415.2005.53221.x [PubMed]
- 61. Tan J, Tsakok FH, Ow EK, Lanskey B, Lim KS, Goh LG, Tan CH, Cheah IK, Larbi A, Foo R, Loh M, Wong CK, Suckling J, et al. Study Protocol for a Randomized Controlled Trial of Choral Singing Intervention to Prevent Cognitive Decline in At-Risk Older Adults Living in the Community. Front Aging Neurosci. 2018; 10:195. https://doi.org/10.3389/fnagi.2018.00195 [PubMed]
- 62. Jenkinson M, Bannister P, Brady M, Smith S. Improved optimization for the robust and accurate linear registration and motion correction of brain images. Neuroimage. 2002; 17:825–41. https://doi.org/10.1006/nimg.2002.1132 [PubMed]
- 63. Song XW, Dong ZY, Long XY, Li SF, Zuo XN, Zhu CZ, He Y, Yan CG, Zang YF. REST: a toolkit for resting-state functional magnetic resonance imaging data processing. PLoS One. 2011; 6:e25031. https://doi.org/10.1371/journal.pone.0025031 [PubMed]
- 64. Chao-Gan Y, Yu-Feng Z. DPARSF: a MATLAB toolbox for “pipeline” data analysis of resting-state fMRI. Front Syst Neurosci. 2010; 4:13. https://doi.org/10.3389/fnsys.2010.00013 [PubMed]
- 65. Smith SM, Jenkinson M, Woolrich MW, Beckmann CF, Behrens TE, Johansen-Berg H, Bannister PR, De Luca M, Drobnjak I, Flitney DE, Niazy RK, Saunders J, Vickers J, et al. Advances in functional and structural MR image analysis and implementation as FSL. Neuroimage. 2004 (Suppl 1); 23:S208–19. https://doi.org/10.1016/j.neuroimage.2004.07.051 [PubMed]
- 66. Wang R, Benner T, Sorensen A, Wedeen V. Diffusion Toolkit : A Software Package for Diffusion Imaging Data Processing and Tractography. Proc Intl Soc Magn Reson Med Sci Meet Exhib. 2007; 15:3720.
- 67. Cui Z, Zhong S, Xu P, He Y, Gong G. PANDA: a pipeline toolbox for analyzing brain diffusion images. Front Hum Neurosci. 2013; 7:42. https://doi.org/10.3389/fnhum.2013.00042 [PubMed]
- 68. Tzourio-Mazoyer N, Landeau B, Papathanassiou D, Crivello F, Etard O, Delcroix N, Mazoyer B, Joliot M. Automated anatomical labeling of activations in SPM using a macroscopic anatomical parcellation of the MNI MRI single-subject brain. Neuroimage. 2002; 15:273–89. https://doi.org/10.1006/nimg.2001.0978 [PubMed]
- 69. Buchanan CR, Pernet CR, Gorgolewski KJ, Storkey AJ, Bastin ME. Test-retest reliability of structural brain networks from diffusion MRI. Neuroimage. 2014; 86:231–43. https://doi.org/10.1016/j.neuroimage.2013.09.054 [PubMed]
- 70. Watts DJ, Strogatz SH. Collective dynamics of ‘small-world’ networks. Nature. 1998; 393:440–2. https://doi.org/10.1038/30918. [PubMed]
- 71. Rubinov M, Sporns O. Complex network measures of brain connectivity: uses and interpretations. Neuroimage. 2010; 52:1059–69. https://doi.org/10.1016/j.neuroimage.2009.10.003 [PubMed]
- 72. Latora V, Marchiori M. Efficient behavior of small-world networks. Phys Rev Lett. 2001; 87:198701. https://doi.org/10.1103/PhysRevLett.87.198701 [PubMed]
- 73. Achard S, Bullmore E. Efficiency and cost of economical brain functional networks. PLOS Comput Biol. 2007; 3:e17. https://doi.org/10.1371/journal.pcbi.0030017 [PubMed]
- 74. Wang Z, Liu J, Zhong N, Qin Y, Zhou H, Li K. Changes in the brain intrinsic organization in both on-task state and post-task resting state. Neuroimage. 2012; 62:394–407. https://doi.org/10.1016/j.neuroimage.2012.04.051 [PubMed]
- 75. Nichols T, Holmes A. Nonparametric Permutation Tests for Functional Neuroimaging. Hum Brain Funct Second Ed. 2003; 25:887–910. https://doi.org/10.1016/B978-012264841-0/50048-2
- 76. Benjamini Y, Hochberg Y. Controlling the False Discovery Rate: A Practical and Powerful Approach to Multiple Testing. J R Stat Soc. 1995; 57:289–300. https://doi.org/10.1111/j.2517-6161.1995.tb02031.x