Association between low T3 syndrome and HT
Baseline levels of total T3 and free T3 were significantly lower in patients with HT than without HT (1.1 mmol/l vs.1.4 mmol/l, P < 0.001; 4.1 mmol/l vs. 4.3 mmol/l, P < 0.001, respectively; Table 1). More patients with HT exhibited low T3 syndrome after ischemic stroke on admission than did those without HT (66.8% vs. 32.7%; chi-square test P <0.001; Table 1). As for the radiological status of HT, baseline levels of total and free T3 were also much lower in the subjects with PH than in those with HI (both P < 0.001; Table 2). Additionally, when compared to patients with HI, low T3 syndrome was more frequently detected in those with PH (P = 0.034; Table 2). Similar results were obtained upon comparison between patients with sHT and asHT . Figure 1 shows that T3 levels decreased in patients with HT as the condition worsened (P < 0.001 by ANOVA test).
Table 2. Comparison of the baseline characteristics according to the subcategorized groups of HT.
| Variables | Radiological HT | | Clinical category |
| HI N = 114 | PH N = 94 | P-value* | asHT N = 125 | sHT N = 83 | P-value* |
| Demographic parameters | | | | | | | |
| Age (years) | 67.9 ± 11.5 | 69.7 ± 11.7 | 0.286 | | 68.7 ± 13.0 | 68.7 ± 9.3 | 0.999 |
| Male, n (%) | 80 (70.2%) | 71 (75.5%) | 0.389 | | 91 (72.8%) | 60 (72.3%) | 0.936 |
| BMI (kg/m2) | 23.1 ± 2.7 | 22.9 ± 3.9 | 0.868 | | 23.2 ± 3.0 | 22.8 ± 3.5 | 0.561 |
| Marital status | | | | | | | |
| Married, n (%) | 111 (97.4%) | 88 (93.6%) | 0.305 | | 119 (95.2%) | 80 (96.4%) | 0.681 |
| Vascular risk factors | | | | | | | |
| History of atrial fibrillation, n (%) | 32 (28.1%) | 41 (43.6%) | 0.019 | | 35 (28.0%) | 38 (45.8%) | 0.009 |
| History of hypertension, n (%) | 80 (70.2%) | 60 (63.8%) | 0.332 | | 81 (64.8%) | 59 (71.1%) | 0.344 |
| History of diabetes, n (%) | 30 (26.3%) | 28 (29.8%) | 0.578 | | 35 (28.0%) | 23 (27.7%) | 0.964 |
| History of dyslipidemia, n (%) | 11 (9.6%) | 5 (5.4%) | 0.252 | | 12 (9.7%) | 4 (4.8%) | 0.200 |
| Current smoking, n (%) | 52 (46.0%) | 45 (48.9%) | 0.680 | | 62 (50.4%) | 46 (56.1%) | 0.424 |
| Current drinking, n (%) | 43 (38.1%) | 41 (44.6%) | 0.346 | | 75 (61.0%) | 46 (56.1%) | 0.487 |
| Biochemistry and vital signs on admission | | | | | | | |
| Baseline SBP (mmHg) | 151.3 ± 21.4 | 147.4 ± 22.7 | 0.200 | | 149.2 ± 22.0 | 150.1 ± 22.1 | 0.771 |
| Baseline DBP (mmHg) | 84.0 ± 12.5 | 82.5 ± 15.5 | 0.456 | | 82.2 ± 14.1 | 84.9 ± 13.7 | 0.172 |
| Leukocyte counts (×109/L) | 8.3 ± 3.3 | 9.0 ± 3.1 | 0.118 | | 8.2 ± 2.5 | 9.2 ± 4.0 | 0.022 |
| Platelets (×109/L) | 212.9 ± 64.5 | 187.6 ± 64.7 | 0.005 | | 204.1 ± 66.9 | 197.5 ± 64.1 | 0.484 |
| Hgb (g/L) | 137.4 ± 14.4 | 137.5 ± 16.7 | 0.953 | | 135.7 ± 15.3 | 140.0 ± 15.3 | 0.044 |
| Fibrinogen (g/L) | 4.1 ± 1.3 | 4.1 ± 1.5 | 0.973 | | 4.1 ± 1.4 | 4.0 ± 1.3 | 0.697 |
| Glucose levels (mmol/L) | 6.2 ± 2.4 | 6.9 ± 3.2 | 0.065 | | 6.4 ± 2.7 | 6.8 ± 2.9 | 0.326 |
| Total cholesterol (mmol/L) | 3.9 ± 1.6 | 3.5 ± 1.8 | 0.080 | | 3.7 ± 1.7 | 3.8 ± 1.8 | 0.656 |
| TSH (mIU/L) | 1.9 ± 2.9 | 1.4 ± 0.9 | 0.079 | | 1.7 ± 2.8 | 1.6 ± 1.1 | 0.747 |
| T4 (nmol/L) | 110.5 ± 22.7 | 106.1 ± 19.5 | 0.144 | | 111.6 ± 22.2 | 103.6 ± 19.2 | 0.008 |
| T3 (nmol/L) | 1.3 ± 0.3 | 1.0 ± 0.3 | <0.001 | | 1.2 ± 0.4 | 1.0 ± 0.2 | <0.001 |
| Free T4 (pmol//L) | 12.4 ± 3.3 | 12.0 ± 2.2 | 0.393 | | 12.2 ± 3.3 | 12.1 ± 2.1 | 0.798 |
| Free T3 (pmol/L) | 4.3 ± 0.7 | 3.8 ± 0.7 | <0.001 | | 4.2 ± 0.8 | 3.9 ± 0.6 | 0.005 |
| Low T3 syndrome, n (%) | 69 (60.5%) | 70 (74.5%) | 0.034 | | 72 (57.6%) | 67 (80.7%) | <0.001 |
| NIHSS on admission, median (IQR) | 4.5 (2.0–9.8) | 6.0 (3.0–11.0) | 0.114 | | 4.0 (2.0–11.0) | 6.0 (3.0–9.5) | 0.882 |
| Stroke mechanisms | | | 0.471 | | | | 0.538 |
| Atherosclerotic, n (%) | 90 (78.9%) | 68 (72.3%) | | | 98 (78.4%) | 60 (72.3%) | |
| Cardioembolic, n (%) | 22 (19.3%) | 24 (25.5%) | | | 24 (19.2%) | 22 (26.5%) | |
| Lacunar, n (%) | 1 (0.9%) | 0 | | | 1 (0.8%) | 0 | |
| Other causes, n (%) | 1 (0.9%) | 2 (2.2%) | | | 2 (1.6%) | 1 (1.2%) | |
| Initial treatment before HT | | | | | | | |
| Antiplatelets, n (%) | 64 (56.1%) | 51 (54.3%) | 0.786 | | 72 (57.6%) | 43 (51.8%) | 0.411 |
| Anticoagulants, n (%) | 24 (21.1%) | 29 (30.9%) | 0.107 | | 31 (24.8%) | 22 (26.5%) | 0.782 |
| Lipid-lowering agents, n (%) | 102 (89.5%) | 81 (86.2%) | 0.466 | | 111 (88.8%) | 72 (86.7%) | 0.656 |
| NOTE. asHT, asymptomatic hemorrhagic transformation; BMI, body mass index; DBP, diastolic blood pressure; Hgb, hemoglobin; HI, hemorrhagic infarct; HT: hemorrhagic transformation; NIHSS, National Institutes of Health Stroke Scale; PH: parenchymal hematoma; SBP, systolic blood pressure; sHT: symptomatic hemorrhagic transformation; T3, triiodothyronine; T4, total thyroxine; T-C, total cholesterol; TSH: thyroid stimulating hormone. *Continuous variables were compared between the groups by the Student’s t-test or the Mann–Whitney test. The chi-square test was used for categorical variables. |
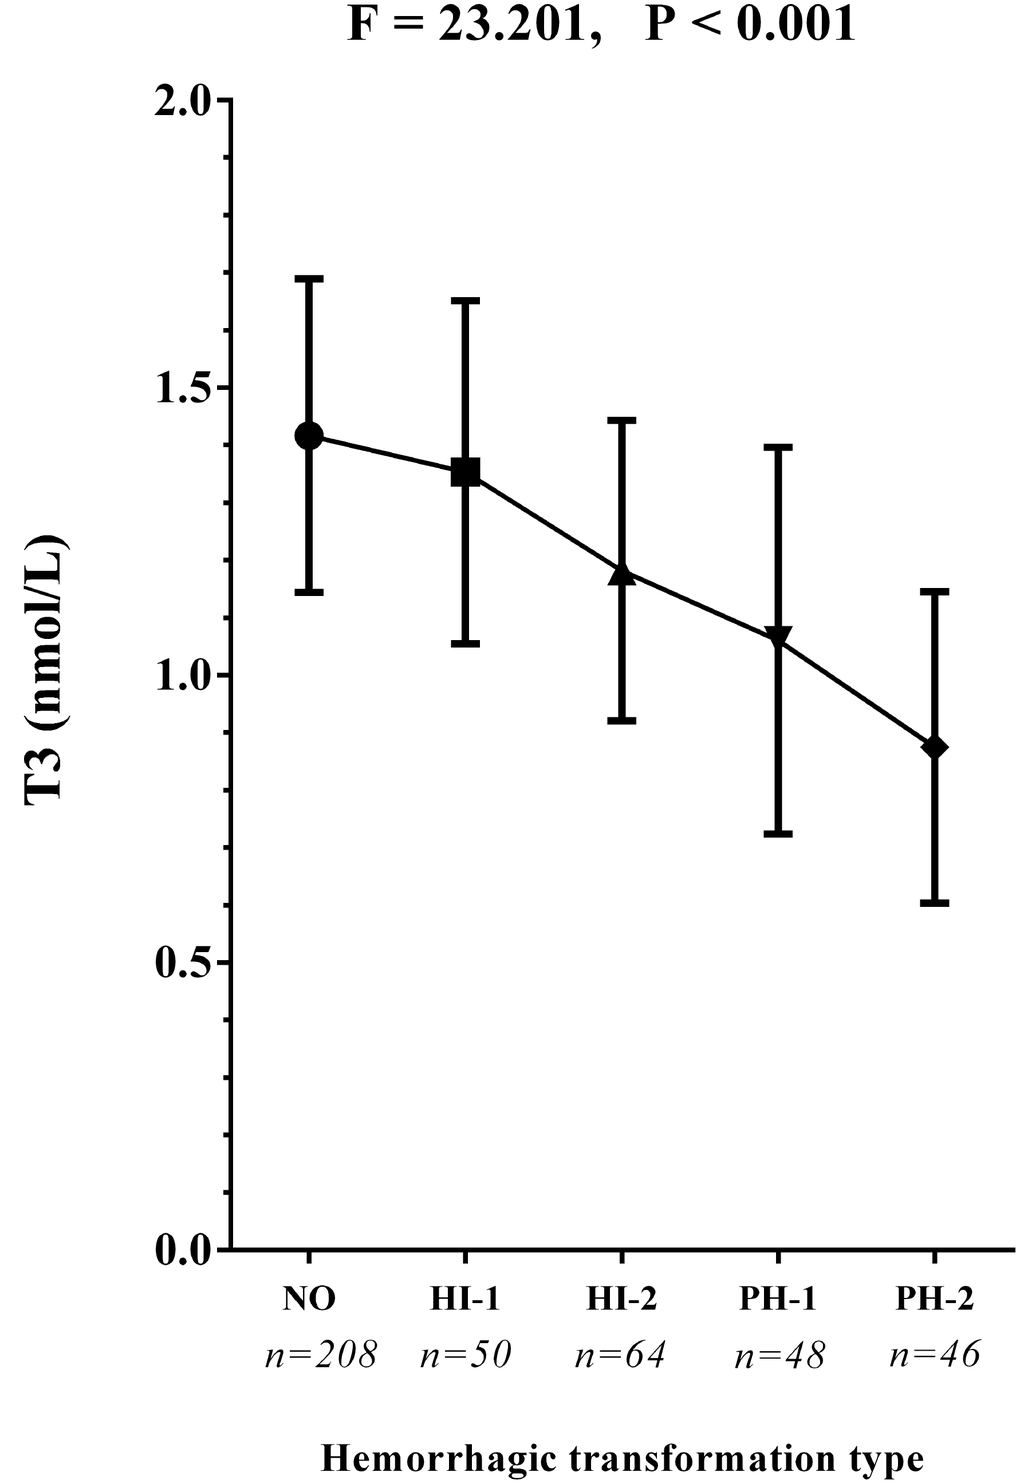
Figure 1. The T3 concentrations in the subcategorized groups of HT. Each data point and error bar correspond to the mean and standard deviation of T3 concentration by the subcategorized groups of HT. The line chart shows a gradual decease of T3 concentrations as the HT became more severe. HI-1, hemorrhagic infarct type 1; HI-2, hemorrhagic infarct type 2; PH-1, parenchymal hematoma type 1; PH-2, parenchymal hematoma type 2.
Among the patients with low T3 syndrome, 68 (32.7%) did not have HT and were analyzed further. In the Supplementary Table 1, the baseline characteristics of AIS patients exhibiting low T3 syndrome with and without HT are compared. The results showed that the T3 levels in patients without HT were significantly higher than in those with HT (1.1 ± 0.1 nmol/L vs. 1.0 ± 0.2 nmol/L; P < 0.001). In addition, compared to patients with HT, those without HT were less likely to have atrial fibrillation, and they presented lower leukocyte counts; lower hemoglobin, glucose, T4, and total cholesterol levels; and lower initial NIHSS scores. Thus, the results from this subgroup were largely similar to those from the patient population as a whole (Table 1), with several exceptions, including current drinking, hemoglobin, total cholesterol, T4 and free T4.
In univariate analyses, low T3 syndrome at baseline was always significantly associated with radiological and clinical HT (OR = 4.147, 95% CI = 2.755–6.243, P < 0.001; OR = 3.082, 95% CI = 1.608–5.908, P = 0.001, respectively; Figure 2), and with a higher risk of PH (OR = 3.939, 95% CI = 2.357–6.582, P < 0.001; Figure 2) than HI (OR = 1.822, 95% CI = 1.175–2.825, P = 0.007; Figure 2). Atrial fibrillation, baseline NIHSS score, systolic blood pressure (SBP), smoking and drinking status, baseline leukocyte counts, fibrinogen, total cholesterol, and use of anticoagulant, antiplatelet or lipid-lowering agents were also significantly associated with HT.
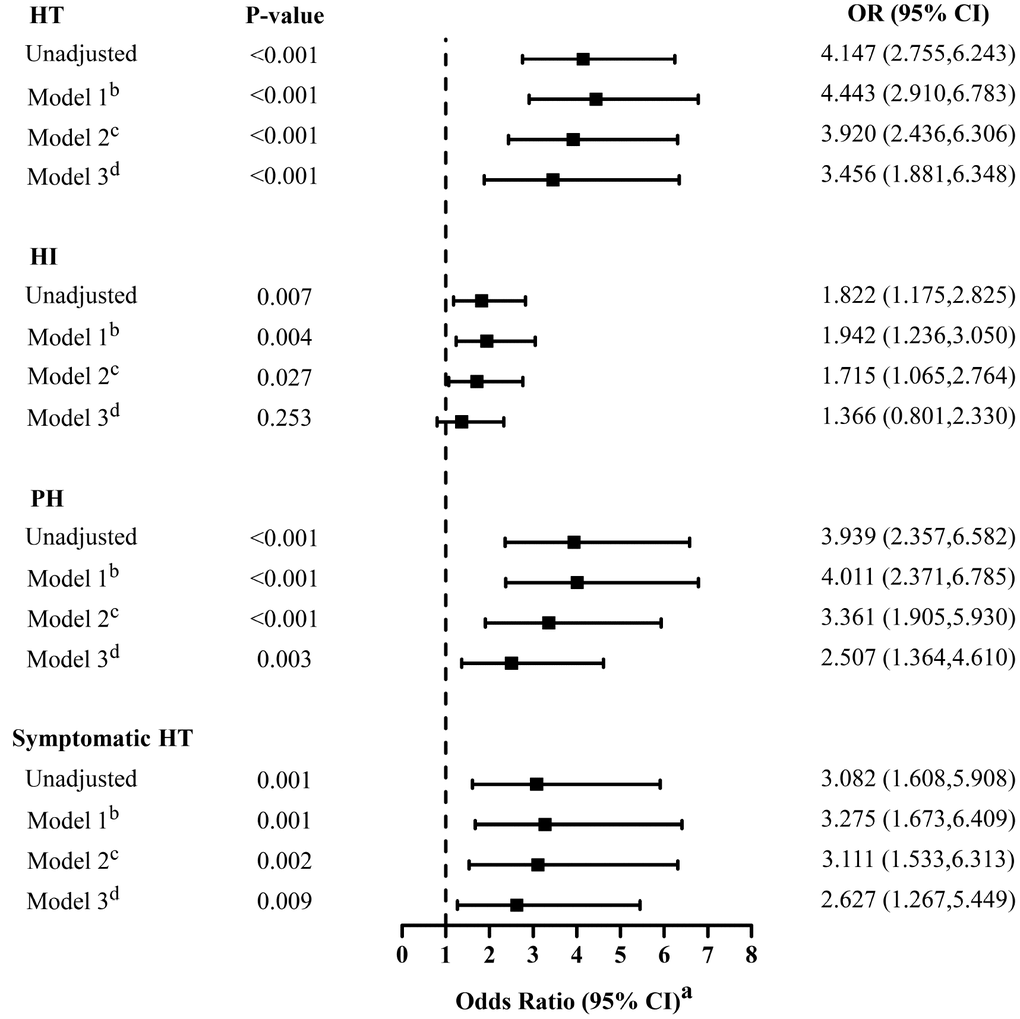
Figure 2. Multivariate adjusted odds ratios for the association between low T3 syndrome and the subcategorized groups of HT (including HT, HI, PH and symptomatic HT respectively). OR, odds radio; CI, confidence level; HI-1, hemorrhagic infarct type 1; HI-2, hemorrhagic infarct type 2; HT: hemorrhagic transformation; PH-1, parenchymal hematoma type 1; PH-2, parenchymal hematoma type 2. aReference OR (1.000) is the absence of low T3 syndrome for outcome. bModel 1: adjusted for age, sex. cModel 2: adjusted for covariates from Model 1 and further adjusted for identified risk factors for HT (systolic blood pressure, baseline NIHSS score, atrial fibrillation, Current smoking and current alcohol drinking). dModel 3: adjusted for covariates from Model 2 and further adjusted for baseline leukocyte counts, fibrinogen, total cholesterol, the therapy of anticoagulant, antiplatelet and lipid-lowering.
A distinction was made between the three adjusted multivariable models, and for each dependent variable, the covariates for each model were the same (Figure 2). After initial adjustment for age and gender, it was found that the occurrence of low T3 syndrome was independently associated with HT (Model 1: OR = 4.443; 95% CI = 2.910–6.783, P < 0.001). The OR of HT for low T3 syndrome did not substantially change after further adjustment for factors already identified as risk factors for HT (Model 2: adjusting for age, gender, SBP, baseline NIHSS score, atrial fibrillation, smoke and drink status; OR = 3.920; 95% CI, 2.436–6.306; P < 0.001). In addition, the association was also apparent after adjusting for additional factors that significantly differed between patients with and without HT in the univariate analysis (Model 3: adjusting for covariates from Model 2 plus baseline leukocyte counts, fibrinogen, total cholesterol, anticoagulant, antiplatelet and lipid-lowering therapy; OR = 3.456, 95% CI = 1.881–6.348; P < 0.001). This result is similar to that obtained for patients with low T3 syndrome and sHT (Model 1: OR = 3.275, 95%CI = 1.673–6.409, P = 0.001; Model 2: OR = 3.111, 95%CI = 1.533–6.313, P = 0.002; Model 3: OR = 2.627, 95%CI = 1.267–5.449, P = 0.009).
In addition, low T3 syndrome was also a significant and independent predictor of the HT classification (PH or HI) after adjusting for the same potential confounders analyzed above. However, the statistical effect of low T3 syndrome on risk of HI was generally less than the risk of PH, and in Model 3, there was no significant association between low T3 syndrome and HI (OR = 1.366; 95% CI = 0.801–2.330; P = 0.253; Figure 2).