


Introduction
Breast cancer is the most common cancer in females worldwide and is also the leading cause of cancer-related deaths in the female population [1]. Surgical removal of the cancer is the standard therapy. Whether adjuvant systemic treatment is performed or not depends on the individual risk situation. The histological grade, tumor size and presence of lymph node metastasis are basic parameters to assess the prognosis of individual patients. Additional molecular analyses are increasingly employed but still not sufficient to reliably determine tumor aggressiveness [2, 3]. The analysis of further molecular properties could eventually improve the reliability of prediction of tumor aggressiveness.
Previous studies have described activation of lipid biosynthesis and lipid remodeling to occur commonly in cancer cells [4]. The phospholipid biosynthesis/remodeling enzyme lysophosphatidylcholine acyltransferase 1 (LPCAT1) is a key enzyme in the lipid-remodeling pathway known as Lands cycle [5]. LPCAT1 has a physiological role in the lung where it generates the dipalmitoyl phosphatidylcholine component of pulmonary surfactant [6, 7], in non-inflammatory platelet-activation factor remodeling pathway [8] and in retinal photoreceptor homeostasis [9]. Overexpression of LPCAT1 was recently described in colorectal cancer [10], prostate cancer [11], lung cancer [12] and clear cell renal cell carcinomas [13]. LPCAT1 overexpression led to a significant growth advantage in cultured colorectal cancer cells [10].
A recent study on a cohort of 80 patients has suggested that up-regulation of LPCAT1 in breast cancer may contribute to tumor progression and predict early tumor recurrence [14]. To broaden our knowledge on LPCAT1 as a biomarker in breast cancer we tested 2,197 breast cancer samples for LPCAT1 expression and analyzed associations with histologically and molecularly defined cancer subgroups as well as follow-up information. Our data identify and validate high LPCAT1 expression as a strong prognostic biomarker for early tumor recurrence in breast cancer.
Results
Technical issues
A total of 1,774 (80.7%) of 2,197 tumor samples were interpretable in our TMA analysis. Non-informative cases (473 spots; 19.3%) were due to missing tissue samples or the absence of unequivocal cancer tissue in the TMA spot.
LPCAT1 expression in normal breast tissue and breast cancer
Normal breast tissues showed moderate to strong LPCAT1 expression in luminal cells under the selected experimental conditions. In cancer, detectable LPCAT1 immunostaining was seen in 1,619 of our 1,774 (91.3%) tumors and was considered weak in 48.1%, moderate in 28.7% and strong in 14.4% of tumors. A fraction of 8.7% showed no detectable LPCAT1 staining and was classified as negative. Representative images of LPCAT1 immunostainings are shown in Figure 1. LPCAT1 expression varied between histological breast cancer subtypes (Table 1). Strong LPCAT staining was for example more often seen in papillary (18.5%) and NST (16.2%) than in lobular carcinomas (5.7%; p<0.0001 for lobular vs. NST cancers). Strong LPCAT staining was also seen in some rare breast cancer subtypes including carcinoma with apocrine differentiation (5 of 12 strongly positive), carcinoma with medullary features (11 of 60) and glycogen-rich clear cell type (3 of 13).
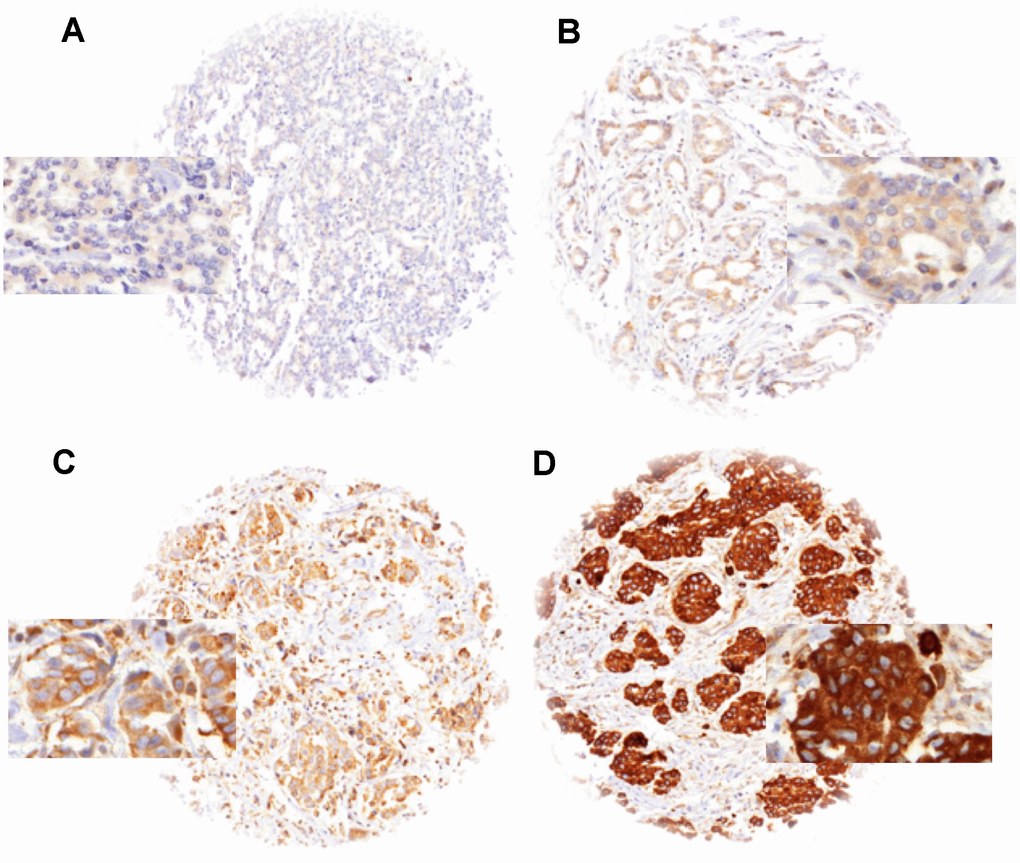
Figure 1. LPCAT1 staining in breast cancer with (A) negative, (B) weak, (C) moderate and (D) strong staining.
Table 1. LPCAT1 immunostaining and breast cancer phenotype.
| LPCAT1 IHC result (%) | P | ||||||||||||||||||||||||||||||||||||||||||||||||||||||||||||||||||||||||||||||||||||||||||||||||||
| N | Negative | Weak | Moderate | Strong | |||||||||||||||||||||||||||||||||||||||||||||||||||||||||||||||||||||||||||||||||||||||||||||||
| All cancers | 1774 | 8.7 | 48.1 | 28.7 | 14.4 | ||||||||||||||||||||||||||||||||||||||||||||||||||||||||||||||||||||||||||||||||||||||||||||||
| Histology | <0.0001 | ||||||||||||||||||||||||||||||||||||||||||||||||||||||||||||||||||||||||||||||||||||||||||||||||||
| No special type (NST) | 1277 | 7.8 | 46.0 | 30.0 | 16.2 | ||||||||||||||||||||||||||||||||||||||||||||||||||||||||||||||||||||||||||||||||||||||||||||||
| Lobular carcinoma | 228 | 11.4 | 62.7 | 20.2 | 5.7 | ||||||||||||||||||||||||||||||||||||||||||||||||||||||||||||||||||||||||||||||||||||||||||||||
| Medullary carcinoma | 60 | 6.7 | 35.0 | 40.0 | 18.3 | ||||||||||||||||||||||||||||||||||||||||||||||||||||||||||||||||||||||||||||||||||||||||||||||
| Cribriform carcinoma | 53 | 22.6 | 50.9 | 18.9 | 7.5 | ||||||||||||||||||||||||||||||||||||||||||||||||||||||||||||||||||||||||||||||||||||||||||||||
| Tubular carcinoma | 38 | 18.4 | 57.9 | 23.7 | 0.0 | ||||||||||||||||||||||||||||||||||||||||||||||||||||||||||||||||||||||||||||||||||||||||||||||
| Papillary carcinoma | 27 | 11.1 | 37.0 | 33.3 | 18.5 | ||||||||||||||||||||||||||||||||||||||||||||||||||||||||||||||||||||||||||||||||||||||||||||||
| Mucinous carcinoma | 50 | 2.0 | 54.0 | 34.0 | 10.0 | ||||||||||||||||||||||||||||||||||||||||||||||||||||||||||||||||||||||||||||||||||||||||||||||
| Other and rare types* | 41 | 4.9 | 39.0 | 29.3 | 26.8 | ||||||||||||||||||||||||||||||||||||||||||||||||||||||||||||||||||||||||||||||||||||||||||||||
| Tumor stage | 0.0176 | ||||||||||||||||||||||||||||||||||||||||||||||||||||||||||||||||||||||||||||||||||||||||||||||||||
| pT1 | 638 | 9.2 | 52.2 | 27.9 | 10.7 | ||||||||||||||||||||||||||||||||||||||||||||||||||||||||||||||||||||||||||||||||||||||||||||||
| pT2 | 856 | 7.9 | 46.6 | 28.6 | 16.8 | ||||||||||||||||||||||||||||||||||||||||||||||||||||||||||||||||||||||||||||||||||||||||||||||
| pT3 | 101 | 10.9 | 47.5 | 22.8 | 18.8 | ||||||||||||||||||||||||||||||||||||||||||||||||||||||||||||||||||||||||||||||||||||||||||||||
| pT4 | 202 | 8.4 | 42.6 | 34.2 | 14.9 | ||||||||||||||||||||||||||||||||||||||||||||||||||||||||||||||||||||||||||||||||||||||||||||||
| Nodal status | 0.2865 | ||||||||||||||||||||||||||||||||||||||||||||||||||||||||||||||||||||||||||||||||||||||||||||||||||
| pN0 | 768 | 9.0 | 50.0 | 28.0 | 13.0 | ||||||||||||||||||||||||||||||||||||||||||||||||||||||||||||||||||||||||||||||||||||||||||||||
| pN1 | 656 | 8.2 | 47.7 | 29.3 | 14.8 | ||||||||||||||||||||||||||||||||||||||||||||||||||||||||||||||||||||||||||||||||||||||||||||||
| pN2 | 102 | 9.8 | 37.3 | 33.3 | 19.6 | ||||||||||||||||||||||||||||||||||||||||||||||||||||||||||||||||||||||||||||||||||||||||||||||
| BRE grade | <0.0001 | ||||||||||||||||||||||||||||||||||||||||||||||||||||||||||||||||||||||||||||||||||||||||||||||||||
| 1 | 415 | 14.5 | 59.8 | 22.2 | 3.6 | ||||||||||||||||||||||||||||||||||||||||||||||||||||||||||||||||||||||||||||||||||||||||||||||
| 2 | 668 | 7.8 | 54.2 | 27.4 | 10.6 | ||||||||||||||||||||||||||||||||||||||||||||||||||||||||||||||||||||||||||||||||||||||||||||||
| 3 | 570 | 4.7 | 35.4 | 34.4 | 25.4 | ||||||||||||||||||||||||||||||||||||||||||||||||||||||||||||||||||||||||||||||||||||||||||||||
| ER status | <0.0001 | ||||||||||||||||||||||||||||||||||||||||||||||||||||||||||||||||||||||||||||||||||||||||||||||||||
| Negative | 406 | 5.9 | 32.0 | 33.3 | 28.8 | ||||||||||||||||||||||||||||||||||||||||||||||||||||||||||||||||||||||||||||||||||||||||||||||
| Positive | 1289 | 9.7 | 52.8 | 27.2 | 10.3 | ||||||||||||||||||||||||||||||||||||||||||||||||||||||||||||||||||||||||||||||||||||||||||||||
| PR status | <0.0001 | ||||||||||||||||||||||||||||||||||||||||||||||||||||||||||||||||||||||||||||||||||||||||||||||||||
| Negative | 1056 | 8.7 | 45.9 | 27.7 | 17.7 | ||||||||||||||||||||||||||||||||||||||||||||||||||||||||||||||||||||||||||||||||||||||||||||||
| Positive | 567 | 9.2 | 52.2 | 29.5 | 9.2 | ||||||||||||||||||||||||||||||||||||||||||||||||||||||||||||||||||||||||||||||||||||||||||||||
| HER2 status | <0.0001 | ||||||||||||||||||||||||||||||||||||||||||||||||||||||||||||||||||||||||||||||||||||||||||||||||||
| Normal | 1153 | 9.1 | 51.2 | 28.4 | 11.3 | ||||||||||||||||||||||||||||||||||||||||||||||||||||||||||||||||||||||||||||||||||||||||||||||
| Amplified | 245 | 5.7 | 31.4 | 29.0 | 33.9 | ||||||||||||||||||||||||||||||||||||||||||||||||||||||||||||||||||||||||||||||||||||||||||||||
| *including carcinoma with apocrine differentiation and metaplastic carcinoma of no special type. | |||||||||||||||||||||||||||||||||||||||||||||||||||||||||||||||||||||||||||||||||||||||||||||||||||
Association with tumor phenotype and molecular features
High levels of LPCAT1 immunostaining were significantly linked to unfavorable tumor features including high pT stage, high BRE grade, estrogen and progesterone receptor negativity, and HER2 amplification (p<0.0001 each). This was also seen for the subgroup of NST carcinomas (Table 1). The comparison of LPCAT1 expression with previously described other genomic alterations such as c-MYC- amplification [15] as well as deletions of PTEN [16–18] and CDKNA2 [19, 20] revealed significant associations with LPCAT1 up-regulation (p<0.02; Table 2). LPCAT1 expression was unrelated to MDM2 amplifications (p=0.67).
Table 2. LPCAT1 staining and genomic alterations.
| LPCAT1 IHC (%) | P | |||||
| Negative | Weak | Moderate | Strong | |||
| PTEN | Normal (n=906) | 9.1 | 49.6 | 28.8 | 12.6 | |
| Deleted (n=220) | 5.9 | 35.5 | 29.1 | 29.5 | ≤0.0001 | |
| c-MYC | Normal (n=992) | 9.9 | 48.4 | 28.7 | 13.0 | |
| Gain (n=258) | 6.6 | 42.2 | 31.0 | 20.2 | ||
| Amplification (n=64) | 3.1 | 42.2 | 31.3 | 23.4 | 0.0066 | |
| CDKN2A | Normal (n=832) | 8.8 | 47.1 | 29.1 | 15.0 | |
| Deleted (n=151) | 7.3 | 37.1 | 30.5 | 25.2 | 0.0151 | |
| MDM2 | Normal (n=1469) | 8.5 | 47.9 | 28.9 | 14.8 | |
| Amplified (n=94) | 9.6 | 43.6 | 27.7 | 19.1 | 0.6727 | |
Association with tumor cell proliferation
Data on tumor cell proliferation as evaluated by KI67 immunohistochemistry were available from a previous study [19]. These were correlated with the present LPCAT1 staining. The mean Ki67LI increased from 23.5 ±1.2 for LPCAT1 negative cancers to 37.3 ±1.0 for cancers with strong LPCAT1 expression (p<0.0001; Table 3). This association was also seen in all tumor subsets with identical pT stage, nodal, ER, PR and HER2 status, BRE grade (only in grade 2 and 3).
Table 3. LPCAT1 expression and Ki67-labeling index.
| LPCAT1 | N | Ki67LI | LPCAT1 | N | Ki67LI | |||||||
| All cancers p<0.0001 | Negative | 135 | 23.5 | ± | 1.2 | BRE grade 2 p<0.0001 | Negative | 46 | 22.7 | ± | 1.1 | |
| Weak | 717 | 24.7 | ± | 0.5 | Weak | 304 | 23.1 | ± | 0.7 | |||
| Moderate | 432 | 30.0 | ± | 0.7 | Moderate | 157 | 24.6 | ± | 0.8 | |||
| Strong | 219 | 37.3 | ± | 1.0 | Strong | 61 | 30.6 | ± | 0.8 | |||
| pT1 p<0.0001 | Negative | 50 | 20.7 | ± | 1.8 | BRE grade 3 p<0.0001 | Negative | 25 | 35.2 | ± | 2.9 | |
| Weak | 258 | 21.1 | ± | 0.8 | Weak | 170 | 34.8 | ± | 1.1 | |||
| Moderate | 148 | 25.9 | ± | 1.1 | Moderate | 158 | 40.2 | ± | 1.2 | |||
| Strong | 56 | 34.9 | ± | 1.7 | Strong | 124 | 42.6 | ± | 1.3 | |||
| pT2 p<0.0001 | Negative | 57 | 23.8 | ± | 2.0 | ER neg. p<0.0001 | Negative | 22 | 34.0 | ± | 3.4 | |
| Weak | 340 | 27.1 | ± | 0.8 | Weak | 116 | 32.1 | ± | 1.5 | |||
| Moderate | 200 | 32.8 | ± | 1.1 | Moderate | 115 | 38.8 | ± | 1.5 | |||
| Strong | 120 | 38.4 | ± | 1.4 | Strong | 103 | 43.3 | ± | 1.6 | |||
| pT3 p=0.0253 | Negative | 10 | 23.1 | ± | 5.2 | ER pos. p<0.0001 | Negative | 110 | 21.7 | ± | 1.2 | |
| Weak | 41 | 27.1 | ± | 2.5 | Weak | 568 | 23.6 | ± | 0.5 | |||
| Moderate | 19 | 33.7 | ± | 3.7 | Moderate | 303 | 26.7 | ± | 0.7 | |||
| Strong | 18 | 39.3 | ± | 3.8 | Strong | 110 | 31.7 | ± | 1.2 | |||
| pT4 p=0.0035 | Negative | 17 | 30.2 | ± | 3.2 | PR neg. p<0.0001 | Negative | 82 | 24.2 | ± | 1.6 | |
| Weak | 76 | 25.2 | ± | 1.5 | Weak | 431 | 25.2 | ± | 0.7 | |||
| Moderate | 60 | 29.7 | ± | 1.7 | Moderate | 252 | 32.2 | ± | 0.9 | |||
| Strong | 25 | 36.4 | ± | 2.7 | Strong | 168 | 39.9 | ± | 1.2 | |||
| pN0 p<0.0001 | Negative | 56 | 20.6 | ± | 1.9 | PR pos. p=0.0435 | Negative | 48 | 22.4 | ± | 1.9 | |
| Weak | 311 | 23.9 | ± | 0.8 | Weak | 243 | 24.4 | ± | 0.8 | |||
| Moderate | 183 | 29.5 | ± | 1.1 | Moderate | 152 | 27.5 | ± | 1.0 | |||
| Strong | 88 | 37.6 | ± | 1.5 | Strong | 41 | 27.9 | ± | 2.0 | |||
| pN+ p<0.0001 | Negative | 58 | 24.6 | ± | 1.9 | HER2 norm. p<0.0001 | Negative | 89 | 24.2 | ± | 1.5 | |
| Weak | 297 | 25.8 | ± | 0.8 | Weak | 497 | 24.6 | ± | 0.6 | |||
| Moderate | 186 | 30.9 | ± | 1.1 | Moderate | 277 | 29.5 | ± | 0.9 | |||
| Strong | 97 | 37.0 | ± | 1.5 | Strong | 110 | 36.8 | ± | 1.4 | |||
| BRE Grade 1 p=0.1291 | Negative | 50 | 18.5 | ± | 1.5 | HER2 amp. p=0.0072 | Negative | 14 | 30.4 | ± | 3.6 | |
| Weak | 201 | 17.8 | ± | 0.7 | Weak | 63 | 33.1 | ± | 1.7 | |||
| Moderate | 78 | 20.7 | ± | 1.2 | Moderate | 61 | 36.2 | ± | 1.7 | |||
| Strong | 12 | 22.2 | ± | 3.0 | Strong | 73 | 40.1 | ± | 1.6 | |||
Prognostic significance of LPCAT1 expression
Raw survival data were available for 1,774 cancers with interpretable IHC results. Strong LPCAT1 expression was closely associated with shortened overall survival (p=0.0043; Figure 2A). The association between strong LPCAT1 expression and poor prognosis was even more pronounced in the subgroup of NST cancers (p=0.0006; Figure 2B) and in the nodal positive subset (p=0.0022; Figure 2C) but was not seen in nodal negative cancers (p=0.1716; Figure 2D). Multivariate analysis for NST cancers including pT stage, nodal status, BRE grade and hormone receptors did not identify LPCAT1 expression as an independent prognosticator of survival (Table 4).
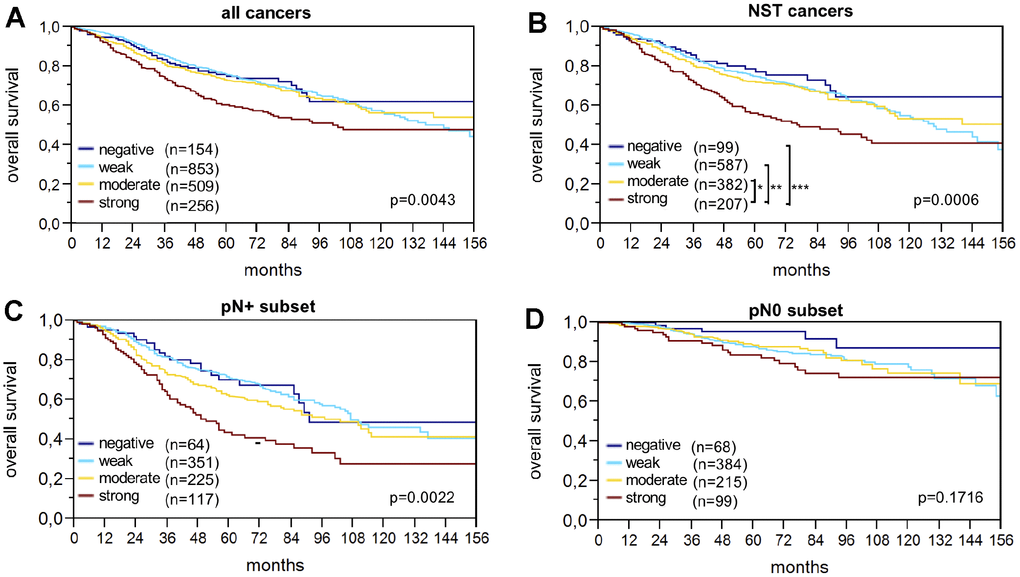
Figure 2. LPCAT1 staining and overall survival in (A) all cancers, (B) the no special type (NST) cancer subset, (C) nodal positive, and (D) nodal negative cancers.
Table 4. Cox proportional hazards for survival of established prognostic parameter in breast cancers of no special type.
| Variable | Subset | N | HR (95% CI) | P | |||||||||||||||||||||||||||||||||||||||||||||||||||||||||||||||||||||||||||||||||||||||||||||||
| ER | Negative vs. positive | 1998 | 1.5 (1.2-2.0) | ≤0.0001 | |||||||||||||||||||||||||||||||||||||||||||||||||||||||||||||||||||||||||||||||||||||||||||||||
| PR | Negative vs. positive | 1907 | 1.2 (1.0-1.6) | 0.1158 | |||||||||||||||||||||||||||||||||||||||||||||||||||||||||||||||||||||||||||||||||||||||||||||||
| HER2 IHC | 3 vs. 0 | 1984 | 1.2 (0.8-1.5) | 0.4753 | |||||||||||||||||||||||||||||||||||||||||||||||||||||||||||||||||||||||||||||||||||||||||||||||
| BRE grade | 3 vs. 1 | 2008 | 2.1 (1.5-2-9) | ≤0.0001 | |||||||||||||||||||||||||||||||||||||||||||||||||||||||||||||||||||||||||||||||||||||||||||||||
| pT stage | 4 vs. 1 | 2161 | 2.3 (1.7-3.3) | ≤0.0001 | |||||||||||||||||||||||||||||||||||||||||||||||||||||||||||||||||||||||||||||||||||||||||||||||
| pN stage | 2 vs. 0 | 1820 | 5.6 (3.9-8.0) | ≤0.0001 | |||||||||||||||||||||||||||||||||||||||||||||||||||||||||||||||||||||||||||||||||||||||||||||||
| LPCAT1 expression | Strong vs. neg./weak/mod. | 1772 | 1.2 (0.8-1.4) | 0.7550 | |||||||||||||||||||||||||||||||||||||||||||||||||||||||||||||||||||||||||||||||||||||||||||||||
| “N” gives the total number of all cases with survival data in each category. Hazard ratios (HR), confidence intervals (CI) and P-values correspond to the indicated subsets. | |||||||||||||||||||||||||||||||||||||||||||||||||||||||||||||||||||||||||||||||||||||||||||||||||||
| ER (estrogen receptor); PR (progesterone receptor); HR (hazard ratio); CI (confidence interval). | |||||||||||||||||||||||||||||||||||||||||||||||||||||||||||||||||||||||||||||||||||||||||||||||||||
Discussion
Our immunohistochemical analysis showed positive LPCAT1 staining in 91.2% of tumors, including 14.4% with strong staining and 76.8% with weak to moderate staining. Since the staining intensity of LPCAT1 in normal breast glands was usually moderate, these data suggest that LPCAT1 is overexpressed in about 15% of breast cancers. Our data are consistent with a previous study by Abdelzaher and Mostafa comparing LPCAT1 expression in 80 breast cancers of NST and 30 non-neoplastic epithelial breast tissues [14]. In this study, LPCAT1 immunostaining was found to be higher in tumor tissue than in non-neoplastic epithelial breast tissue.
Significant differences between the individual breast cancer subtypes fit well with the recognized biological differences between tumor entities. However, the most striking result of our study is the strong association of LPCAT1 expression with an unfavorable histological phenotype and clinical outcome. These data are also confirmed by the results of Abdelzaher and Mostafa [14], which describe links between LPCAT1 immunostaining and high-grade, advanced TNM stage, T stage and lymph node stage in their series of 80 breast cancer patients. It is noteworthy that the 12% of cancers classified as “strong LPCAT1 expressers” behaved significantly worse than the other cancers, especially when the clinical outcome (overall survival) was taken into account. A striking correlation between strong LPCAT1 expression and unfavorable clinical outcome was also found in more homogeneous cancer subtypes, such as 1,277 cancers of no special type and 758 nodal-positive cancers, suggesting possible clinical applicability of LPCAT1 measurement for prognostic evaluation. That LPCAT1 overexpression is also observed in aggressive forms of a broad variety of other cancer types [21–23] suggests a general role of this protein during tumor progression. Based on its molecular function as a key enzyme of lipid synthesis in the Land’s cycle it is believed that LPCAT1 up-regulation reflects a consequence of the increased demand for lipid-depending cellular structures such as membranes and fatty acids in rapidly proliferating tumor cells (reviewed in [24]). This is also supported by work demonstrating that inhibition of enzymes of the Land’s cycle limits the growth of cancer cells and reduces tumorigenesis in various tumor cell models [25].
The molecular database attached to our TMA enabled us to study the relationship of LPCAT1 expression with molecular features that had earlier been analyzed on the same TMA. According to our study, expression levels of LPCAT1 were strongly associated with amplifications of HER2 and MYC, negative ER and PR status and PTEN deletions, which are all linked to adverse tumor features and poor patient outcome. Virtually all of these molecules are implicated in the regulation of processes depending on sufficient supply of lipids and fatty acids, such as cell growth and proliferation, and some of them are known to directly contribute to rate limiting steps of lipid metabolism. For example, there is emerging evidence that PTEN controls lipid biosynthesis via its downstream target Maf1 [26]. MYC has been shown to cooperate with sterol regulatory element-binding protein 1 (SREBP1), a transcription factor involved in regulating lipid homeostasis that was shown to promote epithelial-mesenchymal transition in colon cancers [27] and ER regulates expression of at least 20 genes involved in fatty acid metabolism in breast cancer [28].
Activation of lipid metabolism in tumor cell proliferation is widely accepted. This fits well with the strong correlation of Ki67 expression level with high LPCAT1 expression seen in this study. That this relationship retained high statistical significance in various analyzed cancer subgroups defined by an identical status of morphologic or molecular parameters argues for a particular strong role of LPCAT1 for tumor growth. Apart from the need of producing lipids for dividing cells, LPCAT1 expression could also impact tumor cell proliferation by the production of metabolic intermediates for synthesis of cellular signaling molecules [29]. Moreover, Lipid metabolism has been associated with cellular proliferation and energy storage (reviewed in [30], similar to the prominent Warburg effect [29]. It has been suggested that increased lipid metabolism is either needed to support the growth of rapidly dividing cells, or to maintain elevated glycolysis (the Warburg effect). Various tumors undergo exacerbated endogenous lipid metabolism irrespective of the levels of extracellular lipids [31].
It is a limitation of our study that no data on therapy are available. The rate of LPCAT1 positivity may be higher in case of heterogeneity since we had only one 0.6 mm spot per cancer analyzed. Many data were taken from previous analyses of the same TMA, some of which have been performed more than 10 years ago. This study is an excellent example for how the TMA technology facilitates the development of molecular databases that can be used for every new study.
In summary, our data identify LPCAT1 expression as a prognostic biomarker with potential clinical utility in breast cancer. It appears well possible, that LPCAT1 measurement, either alone or in combination, may be utilized for better clinical decision-making in the future. The findings also highlight the potentially important role of lipid metabolism in breast cancer as a parameter for tumor aggressiveness.
Materials and Methods
Patients
A preexisting tissue microarray (TMA) with 2,197 human breast cancer samples from paraffin-embedded tissue specimens fixed in 4% neutral buffered formalin was used [19]. The samples were consecutively collected between 1984 and 2000. The median patient’s age was 63 years (range 25–101). Raw survival data were available from 1,982 patients. The mean follow-up time was 63 months (range 1–176). The TMA was produced as describe earlier in detail [32]. In short, one 0.6 mm core was taken from a representative cancer tissue block from each patient. The samples were distributed across 6 TMA blocks. A control area containing 20 samples of normal breast tissue was present on each TMA block. Four μm sections of the TMA blocks were transferred to an adhesive coated slide system (Instrumedics Inc., Hackensack, New Jersey) for IHC analysis. The TMA was annotated with data from previous FISH studies for HER2, MYC, CCND1, p53, PTEN, CDKN2A and MDM2 as well as IHC studies on estrogen receptor (ER), progesterone receptor (PR) expression and Ki67-labeling index (Ki67LI) [19, 20, 33, 34].
Immunohistochemistry
Freshly cut TMA sections were immunostained in a single experiment. Slides were deparaffinized and exposed to heat-induced antigen retrieval (5 min, 121°C in Tris-EDTA-citrate buffer at pH 7.8). Primary antibody specific for LPCAT1 (rabbit, Protein Tech; at 1/1350 dilution was applied at 37°C for 60 minutes. Bound antibody was then visualized using the EnVision Kit (Dako, Glostrup, Denmark) according to the manufacturer´s directions. LPCAT1 staining was found on the membrane and in the cytoplasm of positive cells. Evaluation of the immunohistochemical staining was performed as previously described [35]. In brief, tumors with complete absence of staining were scored as “negative”. Cancers with a staining intensity of 1+ in up to 70 %, or 2+ in ≤ 30 % of the tumor cells were scored as “weak”. A “moderate” score was given to cancers with a staining intensity of 1+ > 70 %, 2+ in up to 70 %, or 3+ in ≤30 % of tumor cells. The score was considered “strong” if staining intensity was 2+ in >70 % of tumor cells or 3+ in > 30 % of tumor cells.
Statistics
Contingency tables and chi-square test were calculated to find associations between LPCAT1 expression and clinico-pathological variables. Anova and F-test was applied for associations between LPCAT1 expression and Ki67LI. Kaplan-Meier curves and the log-rank tests were applied to test for differences between stratified survival functions. Cox proportional hazards regression analysis was performed to test for independence and significance between pathological and molecular variables. JMP 12.0 software (SAS Institute Inc., NC, USA) was used.
Ethics approval
The Ethics Committee of the Ärztekammer Hamburg approved the study protocol (WF-049/09). According to local laws (HmbKHG §12a), patient informed consent was not required. Patient records/information were anonymized and de-identified prior to analysis. All procedures have been performed in compliance with the principles outlined in the Helsinki Declaration.
Acknowledgments
We thank Mrs. Janett Lütgens, Mrs. Sünje Seekamp and Mrs. Inge Brandt (Institute of Pathology, University Medical Center Hamburg-Eppendorf, Germany) for excellent technical assistance.
Conflicts of Interest
The authors declare that there is no conflicts of interest.
References
- 1. Torre LA, Bray F, Siegel RL, Ferlay J, Lortet-Tieulent J, Jemal A. Global cancer statistics, 2012. CA Cancer J Clin. 2015; 65:87–108. https://doi.org/10.3322/caac.21262 [PubMed]
- 2. Paik S, Shak S, Tang G, Kim C, Baker J, Cronin M, Baehner FL, Walker MG, Watson D, Park T, Hiller W, Fisher ER, Wickerham DL, et al. A multigene assay to predict recurrence of tamoxifen-treated, node-negative breast cancer. N Engl J Med. 2004; 351:2817–26. https://doi.org/10.1056/NEJMoa041588 [PubMed]
- 3. Müller BM, Kronenwett R, Hennig G, Euting H, Weber K, Bohmann K, Weichert W, Altmann G, Roth C, Winzer KJ, Kristiansen G, Petry C, Dietel M, Denkert C. Quantitative determination of estrogen receptor, progesterone receptor, and HER2 mRNA in formalin-fixed paraffin-embedded tissue—a new option for predictive biomarker assessment in breast cancer. Diagn Mol Pathol. 2011; 20:1–10. https://doi.org/10.1097/PDM.0b013e3181e3630c [PubMed]
- 4. Santos CR, Schulze A. Lipid metabolism in cancer. FEBS J. 2012; 279:2610–23. https://doi.org/10.1111/j.1742-4658.2012.08644.x [PubMed]
- 5. Kent C. Regulatory enzymes of phosphatidylcholine biosynthesis: a personal perspective. Biochim Biophys Acta. 2005; 1733:53–66. https://doi.org/10.1016/j.bbalip.2004.12.008 [PubMed]
- 6. Bridges JP, Ikegami M, Brilli LL, Chen X, Mason RJ, Shannon JM. LPCAT1 regulates surfactant phospholipid synthesis and is required for transitioning to air breathing in mice. J Clin Invest. 2010; 120:1736–48. https://doi.org/10.1172/JCI38061 [PubMed]
- 7. Nakanishi H, Shindou H, Hishikawa D, Harayama T, Ogasawara R, Suwabe A, Taguchi R, Shimizu T. Cloning and characterization of mouse lung-type acyl-CoA:lysophosphatidylcholine acyltransferase 1 (LPCAT1). Expression in alveolar type II cells and possible involvement in surfactant production. J Biol Chem. 2006; 281:20140–47. https://doi.org/10.1074/jbc.M600225200 [PubMed]
- 8. Harayama T, Shindou H, Ogasawara R, Suwabe A, Shimizu T. Identification of a novel noninflammatory biosynthetic pathway of platelet-activating factor. J Biol Chem. 2008; 283:11097–106. https://doi.org/10.1074/jbc.M708909200 [PubMed]
- 9. Cheng L, Han X, Shi Y. A regulatory role of LPCAT1 in the synthesis of inflammatory lipids, PAF and LPC, in the retina of diabetic mice. Am J Physiol Endocrinol Metab. 2009; 297:E1276–82. https://doi.org/10.1152/ajpendo.00475.2009 [PubMed]
- 10. Mansilla F, da Costa KA, Wang S, Kruhøffer M, Lewin TM, Orntoft TF, Coleman RA, Birkenkamp-Demtröder K. Lysophosphatidylcholine acyltransferase 1 (LPCAT1) overexpression in human colorectal cancer. J Mol Med (Berl). 2009; 87:85–97. https://doi.org/10.1007/s00109-008-0409-0 [PubMed]
- 11. Zhou X, Lawrence TJ, He Z, Pound CR, Mao J, Bigler SA. The expression level of lysophosphatidylcholine acyltransferase 1 (LPCAT1) correlates to the progression of prostate cancer. Exp Mol Pathol. 2012; 92:105–10. https://doi.org/10.1016/j.yexmp.2011.11.001 [PubMed]
- 12. Fennell DA, Myrand SP, Nguyen TS, Ferry D, Kerr KM, Maxwell P, Moore SD, Visseren-Grul C, Das M, Nicolson MC. Association between gene expression profiles and clinical outcome of pemetrexed-based treatment in patients with advanced non-squamous non-small cell lung cancer: exploratory results from a phase II study. PLoS One. 2014; 9:e107455. https://doi.org/10.1371/journal.pone.0107455 [PubMed]
- 13. Du Y, Wang Q, Zhang X, Wang X, Qin C, Sheng Z, Yin H, Jiang C, Li J, Xu T. Lysophosphatidylcholine acyltransferase 1 upregulation and concomitant phospholipid alterations in clear cell renal cell carcinoma. J Exp Clin Cancer Res. 2017; 36:66. https://doi.org/10.1186/s13046-017-0525-1 [PubMed]
- 14. Abdelzaher E, Mostafa MF. Lysophosphatidylcholine acyltransferase 1 (LPCAT1) upregulation in breast carcinoma contributes to tumor progression and predicts early tumor recurrence. Tumour Biol. 2015; 36:5473–83. https://doi.org/10.1007/s13277-015-3214-8 [PubMed]
- 15. Al-Kuraya K, Schraml P, Torhorst J, Tapia C, Zaharieva B, Novotny H, Spichtin H, Maurer R, Mirlacher M, Köchli O, Zuber M, Dieterich H, Mross F, et al. Prognostic relevance of gene amplifications and coamplifications in breast cancer. Cancer Res. 2004; 64:8534–40. https://doi.org/10.1158/0008-5472.CAN-04-1945 [PubMed]
- 16. Burandt E, Grünert M, Lebeau A, Choschzick M, Quaas A, Jänicke F, Müller V, Scholz U, Bokemeyer C, Petersen C, Geist S, Paluchowski P, Wilke C, et al. Cyclin D1 gene amplification is highly homogeneous in breast cancer. Breast Cancer. 2016; 23:111–19. https://doi.org/10.1007/s12282-014-0538-y [PubMed]
- 17. Choschzick M, Heilenkötter U, Lebeau A, Jaenicke F, Terracciano L, Bokemeyer C, Sauter G, Simon R. MDM2 amplification is an independent prognostic feature of node-negative, estrogen receptor-positive early-stage breast cancer. Cancer Biomark. 2010-2011; 8:53–60. https://doi.org/10.3233/DMA-2011-0806 [PubMed]
- 18. Lebok P, Mittenzwei A, Kluth M, Özden C, Taskin B, Hussein K, Möller K, Hartmann A, Lebeau A, Witzel I, Mahner S, Wölber L, Jänicke F, et al. 8p deletion is strongly linked to poor prognosis in breast cancer. Cancer Biol Ther. 2015; 16:1080–87. https://doi.org/10.1080/15384047.2015.1046025 [PubMed]
- 19. Ruiz C, Seibt S, Al Kuraya K, Siraj AK, Mirlacher M, Schraml P, Maurer R, Spichtin H, Torhorst J, Popovska S, Simon R, Sauter G. Tissue microarrays for comparing molecular features with proliferation activity in breast cancer. Int J Cancer. 2006; 118:2190–94. https://doi.org/10.1002/ijc.21581 [PubMed]
- 20. Lebok P, Kopperschmidt V, Kluth M, Hube-Magg C, Özden C, B T, Hussein K, Mittenzwei A, Lebeau A, Witzel I, Wölber L, Mahner S, Jänicke F, et al. Partial PTEN deletion is linked to poor prognosis in breast cancer. BMC Cancer. 2015; 15:963. https://doi.org/10.1186/s12885-015-1770-3 [PubMed]
- 21. Uehara T, Kikuchi H, Miyazaki S, Iino I, Setoguchi T, Hiramatsu Y, Ohta M, Kamiya K, Morita Y, Tanaka H, Baba S, Hayasaka T, Setou M, Konno H. Overexpression of Lysophosphatidylcholine Acyltransferase 1 and Concomitant Lipid Alterations in Gastric Cancer. Ann Surg Oncol. 2016 (Suppl 2); 23:S206–13. https://doi.org/10.1245/s10434-015-4459-6 [PubMed]
- 22. Shida-Sakazume T, Endo-Sakamoto Y, Unozawa M, Fukumoto C, Shimada K, Kasamatsu A, Ogawara K, Yokoe H, Shiiba M, Tanzawa H, Uzawa K. Lysophosphatidylcholine acyltransferase1 overexpression promotes oral squamous cell carcinoma progression via enhanced biosynthesis of platelet-activating factor. PLoS One. 2015; 10:e0120143. https://doi.org/10.1371/journal.pone.0120143 [PubMed]
- 23. Diefenbach CS, Soslow RA, Iasonos A, Linkov I, Hedvat C, Bonham L, Singer J, Barakat RR, Aghajanian C, Dupont J. Lysophosphatidic acid acyltransferase-beta (LPAAT-beta) is highly expressed in advanced ovarian cancer and is associated with aggressive histology and poor survival. Cancer. 2006; 107:1511–19. https://doi.org/10.1002/cncr.22184 [PubMed]
- 24. Currie E, Schulze A, Zechner R, Walther TC, Farese RV
Jr . Cellular fatty acid metabolism and cancer. Cell Metab. 2013; 18:153–61. https://doi.org/10.1016/j.cmet.2013.05.017 [PubMed] - 25. Flavin R, Peluso S, Nguyen PL, Loda M. Fatty acid synthase as a potential therapeutic target in cancer. Future Oncol. 2010; 6:551–62. https://doi.org/10.2217/fon.10.11 [PubMed]
- 26. Johnson DL, Stiles BL. Maf1, A New PTEN Target Linking RNA and Lipid Metabolism. Trends Endocrinol Metab. 2016; 27:742–50. https://doi.org/10.1016/j.tem.2016.04.016 [PubMed]
- 27. Zhai D, Cui C, Xie L, Cai L, Yu J. Sterol regulatory element-binding protein 1 cooperates with c-Myc to promote epithelial-mesenchymal transition in colorectal cancer. Oncol Lett. 2018; 15:5959–65. https://doi.org/10.3892/ol.2018.8058 [PubMed]
- 28. Monaco ME. Fatty acid metabolism in breast cancer subtypes. Oncotarget. 2017; 8:29487–500. https://doi.org/10.18632/oncotarget.15494 [PubMed]
- 29. Hanahan D, Weinberg RA. Hallmarks of cancer: the next generation. Cell. 2011; 144:646–74. https://doi.org/10.1016/j.cell.2011.02.013 [PubMed]
- 30. Baenke F, Peck B, Miess H, Schulze A. Hooked on fat: the role of lipid synthesis in cancer metabolism and tumour development. Dis Model Mech. 2013; 6:1353–63. https://doi.org/10.1242/dmm.011338 [PubMed]
- 31. Kuhajda FP. Fatty-acid synthase and human cancer: new perspectives on its role in tumor biology. Nutrition. 2000; 16:202–08. https://doi.org/10.1016/S0899-9007(99)00266-X [PubMed]
- 32. Mirlacher M, Simon R. Recipient block TMA technique. Methods Mol Biol. 2010; 664:37–44. https://doi.org/10.1007/978-1-60761-806-5_4 [PubMed]
- 33. Al Kuraya K, Simon R, Sauter G. Tissue microarrays for high-throughput molecular pathology. Ann Saudi Med. 2004; 24:169–74. https://doi.org/10.5144/0256-4947.2004.169 [PubMed]
- 34. Lebok P, Roming M, Kluth M, Koop C, Özden C, Taskin B, Hussein K, Lebeau A, Witzel I, Wölber L, Geist S, Paluchowski P, Wilke C, et al. p16 overexpression and 9p21 deletion are linked to unfavorable tumor phenotype in breast cancer. Oncotarget. 2016; 7:81322–31. https://doi.org/10.18632/oncotarget.13227 [PubMed]
- 35. Weischenfeldt J, Simon R, Feuerbach L, Schlangen K, Weichenhan D, Minner S, Wuttig D, Warnatz HJ, Stehr H, Rausch T, Jäger N, Gu L, Bogatyrova O, et al. Integrative genomic analyses reveal an androgen-driven somatic alteration landscape in early-onset prostate cancer. Cancer Cell. 2013; 23:159–70. https://doi.org/10.1016/j.ccr.2013.01.002 [PubMed]