Patient characteristics
The general characteristics of the development and validation cohorts are detailed in Table 1. Of the 398 patients in the development cohort, 185 developed HT, and we matched them to 213 LAA patients without HT. Members of the HT group had an average age of 67.9 years, an average systolic blood pressure (SBP) of 150.4mmHg, an average of National Institute of Health Stroke Scale (NIHSS) of 6.6, and an average N/L of 5.9; In the non-HT group, the average age was 63.7 years, the average SBP was 156.6mmHg, the average NIHSS was 2.4, and the average N/L was 2.7.
Table 1. The general characteristics of the development and validation cohorts.
| Development cohort | | Validation cohort |
| Group | no-HT | HT | P-value* | Group | no-HT | HT | P-value* |
| N | 213 | 185 | | | N | 104 | 98 | |
| Age | 63.75 ± 10.58 | 67.91 ± 12.46 | <0.001 | | Age | 63.32 ± 10.45 | 69.19 ± 11.21 | <0.001 |
| BMI | 23.85 ± 3.35 | 23.11 ± 3.24 | 0.051 | | BMI | 23.90 ± 3.11 | 22.88 ± 3.53 | 0.045 |
| SBP | 156.59 ± 21.13 | 150.38 ± 22.35 | 0.011 | | SBP | 153.71 ± 21.85 | 151.53 ± 23.18 | 0.669 |
| DBP | 83.68 ± 13.37 | 82.16 ± 13.66 | 0.214 | | DBP | 82.89 ± 14.00 | 83.58 ± 15.08 | 0.84 |
| TG | 1.80 ± 1.05 | 1.69 ± 0.95 | 0.085 | | TG | 1.77 ± 1.07 | 1.59 ± 0.76 | 0.161 |
| HDL | 1.14 ± 0.31 | 1.16 ± 0.33 | 0.49 | | HDL | 1.14 ± 0.32 | 1.17 ± 0.26 | 0.428 |
| TC | 4.84 ± 1.17 | 4.79 ± 1.18 | 0.555 | | TC | 4.80 ± 1.21 | 4.81 ± 1.13 | 0.826 |
| LDL | 2.92 ± 1.05 | 2.78 ± 0.91 | 0.306 | | LDL | 2.82 ± 1.02 | 2.83 ± 0.87 | 0.735 |
| HCY | 8.61 ± 5.19 | 8.78 ± 5.65 | 0.722 | | HCY | 8.71 ± 5.99 | 8.93 ± 5.67 | 0.393 |
| Neutrophil | 0.61 ± 0.09 | 0.70 ± 0.11 | <0.001 | | Neutrophil | 0.62 ± 0.10 | 0.71 ± 0.12 | <0.001 |
| Lymphocyte | 0.28 ± 0.09 | 0.20 ± 0.12 | <0.001 | | Lymphocyte | 0.28 ± 0.10 | 0.19 ± 0.14 | <0.001 |
| N/L | 2.71 ± 2.55 | 5.89 ± 6.89 | <0.001 | | N/L | 2.72 ± 1.86 | 6.03 ± 5.24 | <0.001 |
| N+L | 0.89 ± 0.07 | 0.90 ± 0.09 | 0.017 | | N+L | 0.89 ± 0.07 | 0.90 ± 0.11 | 0.423 |
| AST | 23.82 ± 12.61 | 31.11 ± 17.10 | <0.001 | | AST | 23.70 ± 13.98 | 30.26 ± 12.41 | <0.001 |
| BUN | 5.41 ± 1.92 | 5.48 ± 1.79 | 0.728 | | BUN | 5.25 ± 2.19 | 5.48 ± 1.84 | 0.264 |
| CR | 74.09 ± 19.52 | 86.86 ± 44.16 | 0.438 | | CR | 75.23 ± 19.19 | 84.84 ± 40.72 | 0.864 |
| GH | 6.28 ± 1.45 | 6.05 ± 2.33 | 0.043 | | GH | 6.21 ± 1.52 | 5.87 ± 1.95 | 0.175 |
| TB | 12.66 ± 7.96 | 14.51 ± 6.84 | <0.001 | | TB | 12.29 ± 6.39 | 15.53 ± 7.05 | <0.001 |
| Albumin | 35.10 ± 1.98 | 37.91 ± 6.45 | 0.269 | | Albumin | 35.10 ± 1.98 | 38.06 ± 6.03 | 0.286 |
| ALT | 23.79 ± 19.14 | 27.32 ± 24.10 | 0.318 | | ALT | 23.85 ± 20.95 | 26.85 ± 22.56 | 0.712 |
| Platelet | 209.76 ± 62.58 | 206.34 ± 69.92 | 0.184 | | Platelet | 208.41 ± 59.88 | 201.61 ± 68.76 | 0.151 |
| NIHSS | 2.38 ± 2.59 | 6.55 ± 4.99 | <0.001 | | NIHSS | 2.45 ± 2.79 | 6.60 ± 4.88 | <0.001 |
| Sex | | | 0.907 | | Sex | | | 0.838 |
| male | 152 (71.36%) | 133 (71.89%) | | | male | 74 (71.15%) | 71 (72.45%) | |
| female | 61 (28.64%) | 52 (28.11%) | | | female | 30 (28.85%) | 27 (27.55%) | |
| Smoke | | | 0.086 | | Smoke | | | 0.379 |
| smoking now | 99 (46.70%) | 72 (39.78%) | | | smoking now | 48 (46.15%) | 35 (36.46%) | |
| quit smoking | 33 (15.57%) | 21 (11.60%) | | | quit smoking | 17 (16.35%) | 19 (19.79%) | |
| no smoking | 80 (37.74%) | 88 (48.62%) | | | no smoking | 39 (37.50%) | 42 (43.75%) | |
| Drink | | | <0.001 | | Drink | | | <0.001 |
| drinking now | 170 (84.58%) | 66 (36.46%) | | | drinking now | 84 (84.00%) | 39 (40.62%) | |
| quit drinking | 16 (7.96%) | 13 (7.18%) | | | quit drinking | 8 (8.00%) | 10 (10.42%) | |
| no drinking | 15 (7.46%) | 102 (56.35%) | | | no drinking | 8 (8.00%) | 47 (48.96%) | |
| Stroke history | | | 0.013 | | Stroke history | | | 0.02 |
| no | 193 (91.90%) | 155 (83.78%) | | | no | 97 (93.27%) | 81 (82.65%) | |
| yes | 17 (8.10%) | 30 (16.22%) | | | yes | 7 (6.73%) | 17 (17.35%) | |
| HP | | | 0.459 | | HP | | | 0.728 |
| no | 63 (29.86%) | 61 (33.33%) | | | no | 36 (34.62%) | 31 (32.29%) | |
| yes | 148 (70.14%) | 122 (66.67%) | | | yes | 68 (65.38%) | 65 (67.71%) | |
| DM | | | 0.696 | | DM | | | 0.67 |
| no | 153 (72.86%) | 138 (74.59%) | | | no | 78 (75.00%) | 76 (77.55%) | |
| yes | 57 (27.14%) | 47 (25.41%) | | | yes | 26 (25.00%) | 22 (22.45%) | |
| AF | | | 0.211 | | AF | | | 0.241 |
| no | 206 (97.17%) | 175 (94.59%) | | | no | 100 (96.15%) | 90 (91.84%) | |
| yes | 6 (2.83%) | 10 (5.41%) | | | yes | 4 (3.85%) | 8 (8.16%) | |
| Note: In the Development cohort, univariate analysis found that Age, Neutrophil, Lymphocyte, N/L, N+L, AST, TB, GH and NHISS in patients with HT had statistically significant differences in patients who did not develop HT. |
| Abbreviation: BMI: Body Mass Index; SBP: Systolic blood pressure; DBP: Diastolic blood pressure; TG: Triglyceride; TC: Total cholesterol; HDL: High density lipoprotein; LDL: Low density lipoprotein; HCY: Homocysteine; N/L: Neutrophil/ Lymphocyte; N+L: Neutrophil + Lymphocyte; AST: Aspartate aminotransferase; ALT: Alanine aminotransferase; CR: Creatinine; BUN: Blood urea nitrogen; GH: Glycated hemoglobin; TB: Total bilirubin; HP: Hypertension; DM: Diabetes mellitus; AF: Atrial fibrillation. |
Univariate and multivariate were used to identify factors potentially prognostic factors of HT, we used logistic regression to this end. The two groups differed significantly in terms of age, SBP, and NIHSS (Table 2). On this basis, we have constructed three models, Model 1 contained these parameters, and models 2 and 3 contained neutrophil and lymphocyte counts and the N/L, respectively. Through comparison, we will select the best model to build nomogram.
Table 2. Univariate analyses for the potential factors associated with hemorrhagic transformation by Logistic regression.
| Model1 | | Model2 | | Model3 |
| P | OR | 95% CI | | P | OR | 95% CI | | P | OR | 95% CI |
| Age | <0.01 | 1.04 | 1.018-1.066 | Age | <0.01 | 1.04 | 1.02-1.07 | Age | <0.01 | 1.04 | 1.02-1.07 |
| SBP | <0.01 | 0.97 | 0.961-0.986 | SBP | <0.01 | 0.97 | 0.96-0.99 | SBP | <0.01 | 0.97 | 0.96-0.98 |
| TB | 0.05 | 1.03 | 0.999-1.069 | TB | 0.06 | 1.03 | 1.00-1.07 | TB | 0.28 | 1.02 | 0.98-1.06 |
| AST | 0.49 | 1.02 | 1.000-1.041 | AST | 0.05 | 1.02 | 1.00-1.04 | AST | 0.12 | 1.02 | 1.00-1.04 |
| GH | 0.54 | 0.95 | 0.808-1.119 | GH | 0.55 | 0.95 | 0.81-1.12 | GH | 0.81 | 0.98 | 0.82-1.16 |
| NIHSS | <0.01 | 11.92 | 5.198-27.356 | NIHSS | <0.01 | 11.82 | 5.14-27.22 | NIHSS | <0.01 | 1.32 | 1.22-1.44 |
| | | | N+L | 0.81 | 1.73 | 0.02-157.94 | N/L | 0.03 | 1.12 | 1.01-1.25 |
| Note: Logistic regression analysis found that patients’ Age, SBP, and HIHSS are independent risk factors for HT. On this basis, we have established three models, and Model 2 and Model 3 add two variables, N+L and N/L, respectively. |
| Abbreviation: SBP: Systolic blood pressure; N/L: Neutrophil/ Lymphocyte; N+L: Neutrophil + Lymphocyte; AST: Aspartate aminotransferase; GH: Glycated hemoglobin; TB: Total bilirubin. |
In order to explore the best connection between neutrophil, lymphocyte and HT, we have produced three prediction models for this purpose. Model 1 includes age, SBP, NIHSS; model 2 includes age, SBP, NIHSS, neutrophil+lymphocyte (N+L); and model 3 includes age, SBP, NIHSS, N/L. Receiver operating characteristic (ROC) curves are shown in Figure 1, and the three AUCs were 0.812, 0.813 and 0.832, respectively. We performed Decision Curve Analyses (DCAs) for the three models. Figure 2 shows that all three DCA curves correctly diagnosed HT, but the net benefit afforded by model 3 was the highest.
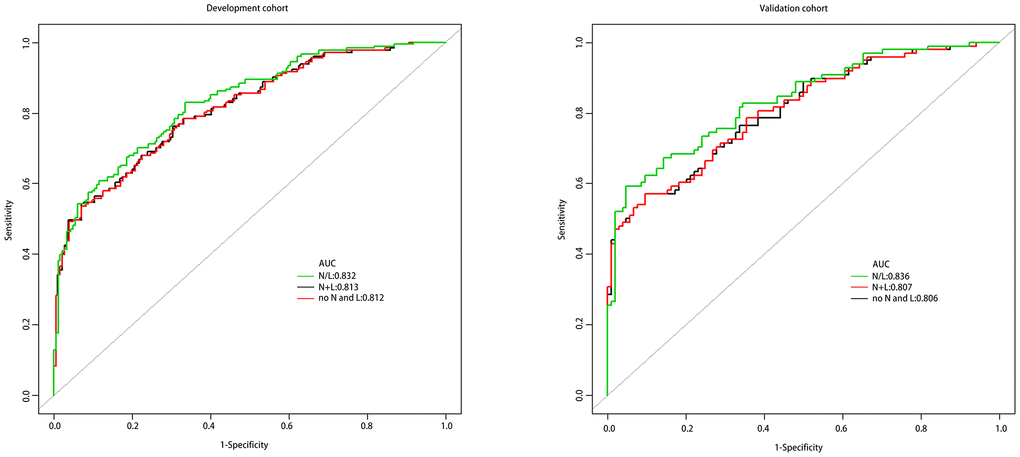
Figure 1. The ROC curves of the three models.
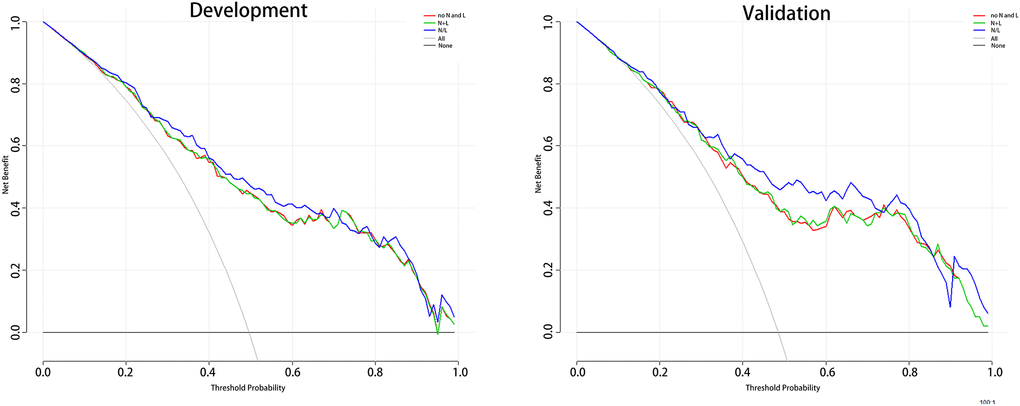
Figure 2. The DCA for 3 models to predict the correct diagnosis of HT patients. Abbreviation: DCA: Decision Curve Analysis; HT: hemorrhagic transformation. Note: The net benefit value of model3 is higher than the other two groups.
The ROC and DCA curves showed that the predictive accuracies of model 2 and model 3 were higher than that of model 1. In order to compare the differences in predictive performance between model 2 and model 3, we calculated Net Reclassification Indexs (NRIs) and Integrated Discrimination Improvements (IDIs), as shown in Figure 3. The IDI approach showed that the predictive ability of model 3 was significantly better than that of model 2 for both the development cohort (IDI = 0.01, P = 0.03) and the validation cohort (IDI = 0.02, P = 0.01). The NRI showed that the predictive capacities of the two models for both groups were good, but model 3 was better. The NRIs for the development and validation cohorts were 0.02(-0.13–0.10) and 0.06(-0.15–0.25), respectively (Figure 3). Thus, we selected model 3 to establish a nomogram for patients with LAA-type HT (Figure 4). Multivariate logistic regression indicated that age, SBP, NIHSS and N/L were all useful predictors. The model evidenced good predictive power (AUC:0.832, 95%CI:0.791–0.872). In the validation cohort, the model also predicted HT well (AUC:0.836, 95%CI:0.781–0.891).
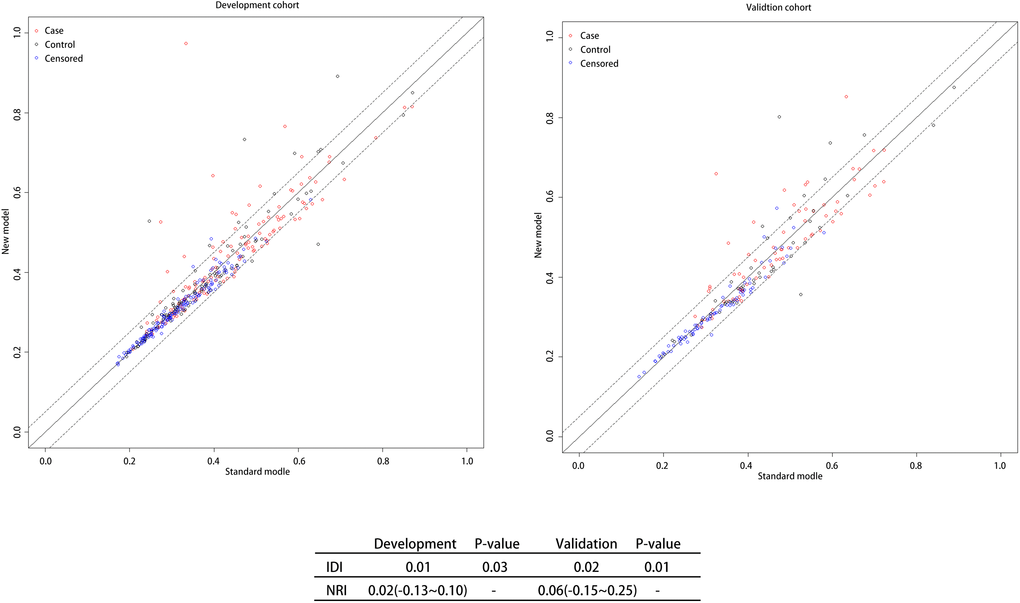
Figure 3. NRI and IDI between N/L and N+L groups. Note: Both NRI and IDI show that Model3 has a higher predictive power than Model2. Abbreviation: NRI: Net reclassification index; IDI: Integrated Discrimination Improvement; N/L: Neutrophil/ Lymphocyte; N+L: Neutrophil + Lymphocyte.
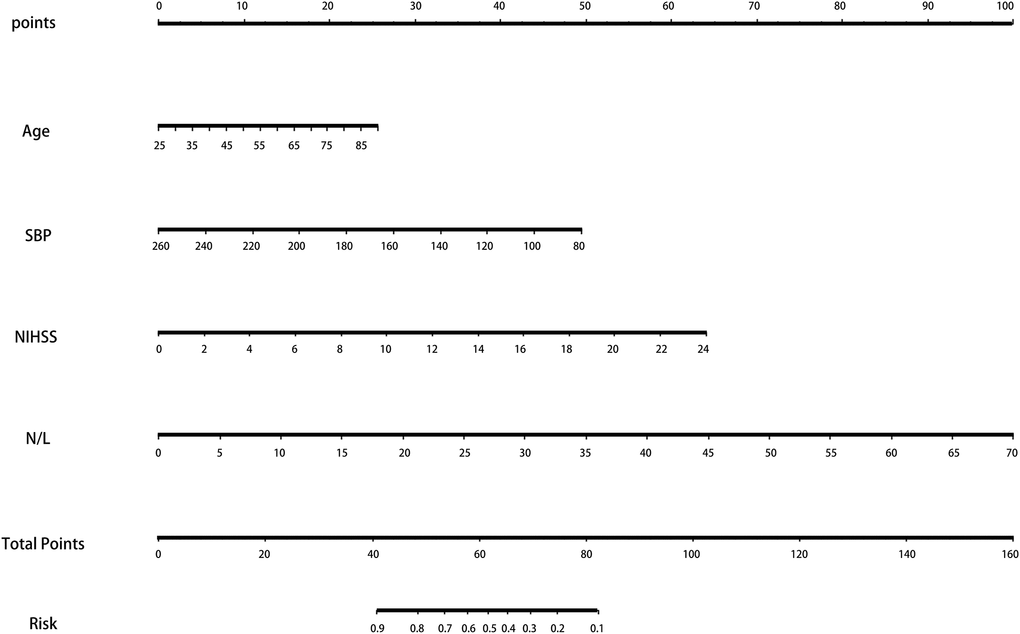
Figure 4. The nomogram for patients with LAA-type HT. Note: To use the nomogram, an individual patient’s value is located on each variable axis, and a line is drawn upward to determine the number of points received for each variable value. The sum of these numbers is located on the Total Points axis, and a line is drawn downward to the survival axes to determine the likelihood of HT. Abbreviation: LAA: large artery atherosclerosis; HT: hemorrhagic transformation.
According to the recommendations of the European Cooperative Acute Stroke Study (ECASS) [11], HT is divided into HI and PH, and the patient's baseline data are shown in Table 3. The HI group had an average age of 68.9 years, an average SBP of 152.7mmHg, an average NIHSS of 7.63, and an average N/L of 5.42. The PH group had an average age of 66.3 years, an average SBP of 146.7mmHg, an average of NIHSS of 5.9, and an average N/L of 6.67.
Table 3. The patient's baseline data of PH and HI.
| HT | HI | PH | P-value |
| N | 114 | 71 | |
| Age | 68.90 ± 12.11 | 66.31 ± 12.94 | 0.249 |
| BMI | 23.15 ± 2.71 | 23.00 ± 4.23 | - |
| SBP | 152.66 ± 21.19 | 146.73 ± 23.79 | 0.063 |
| TC | 4.75 ± 1.13 | 4.87 ± 1.26 | - |
| TG | 1.60 ± 0.81 | 1.85 ± 1.13 | - |
| HDL | 1.14 ± 0.29 | 1.19 ± 0.38 | - |
| DBP | 82.72 ± 13.59 | 81.27 ± 13.80 | - |
| LDL | 2.81 ± 0.98 | 2.73 ± 0.78 | - |
| HCY | 9.61 ± 5.95 | 7.27 ± 4.78 | - |
| Neutrophil | 0.69 ± 0.11 | 0.72 ± 0.11 | 0.065 |
| Lymphocyte | 0.20 ± 0.10 | 0.19 ± 0.15 | 0.063 |
| N/L | 5.42 ± 7.20 | 6.67 ± 6.31 | 0.076 |
| N+L | 0.89 ± 0.05 | 0.91 ± 0.12 | 0.784 |
| TB | 13.91 ± 6.65 | 15.48 ± 7.08 | - |
| Albumin | 36.94 ± 4.42 | 39.51 ± 8.65 | - |
| ALT | 26.81 ± 23.38 | 28.14 ± 25.38 | - |
| AST | 30.93 ± 17.25 | 31.41 ± 16.98 | - |
| BUN | 5.59 ± 1.88 | 5.29 ± 1.60 | - |
| CR | 84.49 ± 42.64 | 90.81 ± 46.66 | - |
| GH | 6.00 ± 1.82 | 6.13 ± 3.03 | - |
| Platelet | 214.59 ± 73.57 | 192.90 ± 61.71 | - |
| NIHSS | 5.90 ± 5.03 | 7.63 ± 4.78 | 0.01 |
| Sex | | | - |
| male | 79 (69.30%) | 54 (76.06%) | |
| female | 35 (30.70%) | 17 (23.94%) | |
| Smoke | | | - |
| smoking now | 43 (38.39%) | 29 (42.03%) | |
| quit smoking | 13 (11.61%) | 8 (11.59%) | |
| no smoking | 56 (50.00%) | 32 (46.38%) | |
| Drink | | | - |
| drinking now | 38 (33.93%) | 28 (40.58%) | |
| quit drinking | 9 (8.04%) | 4 (5.80%) | |
| no drinking | 65 (58.04%) | 37 (53.62%) | |
| Stroke history | | | - |
| no | 94 (82.46%) | 61 (85.92%) | |
| yes | 20 (17.54%) | 10 (14.08%) | |
| HP | | | - |
| no | 33 (29.46%) | 28 (39.44%) | |
| yes | 79 (70.54%) | 43 (60.56%) | |
| DM | | | - |
| no | 83 (72.81%) | 55 (77.46%) | |
| yes | 31 (27.19%) | 16 (22.54%) | |
| AF | | | - |
| no | 107 (93.86%) | 68 (95.77%) | |
| yes | 7 (6.14%) | 3 (4.23%) | |
| Abbreviation: BMI: Body Mass Index; SBP: Systolic blood pressure; DBP: Diastolic blood pressure; TG: Triglyceride; TC: Total cholesterol; HDL: High density lipoprotein; LDL: Low density lipoprotein; HCY: Homocysteine; N/L: Neutrophil/ Lymphocyte; N+L: Neutrophil + Lymphocyte; AST: Aspartate aminotransferase; ALT: Alanine aminotransferase; CR: Creatinine; BUN: Blood urea nitrogen; GH: Glycated hemoglobin; TB: Total bilirubin; HP: Hypertension; DM: Diabetes mellitus; AF: Atrial fibrillation. |
Table 3 shows no differences in age, SBP, NIHSS, and N/L between the two groups. Therefore, we used these four predictors to create a nomogram predicting the probability of HI and PH in LAA patients (Figure 5). For the HI group, the AUC was 0.821(95%CI: 0.773–0.867); for the PH group, the AUC was 0.896(95%CI: 0.844–0.931). In the validation cohort, their AUCs are 0.794 and 0.882, respectively, which also indicated good model repeatability and very good predictive power in both populations. DCA in both groups revealed a good net benefit (Figure 6).
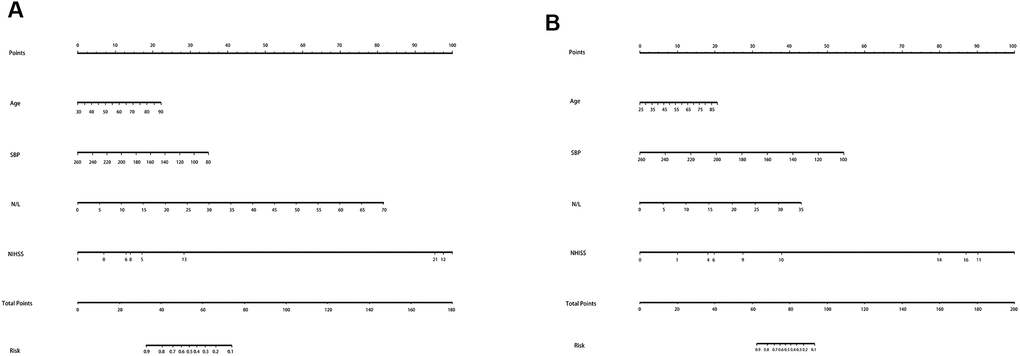
Figure 5. The nomogram for HI and PH in LAA patients. Abbreviation: LAA: large artery atherosclerosis.
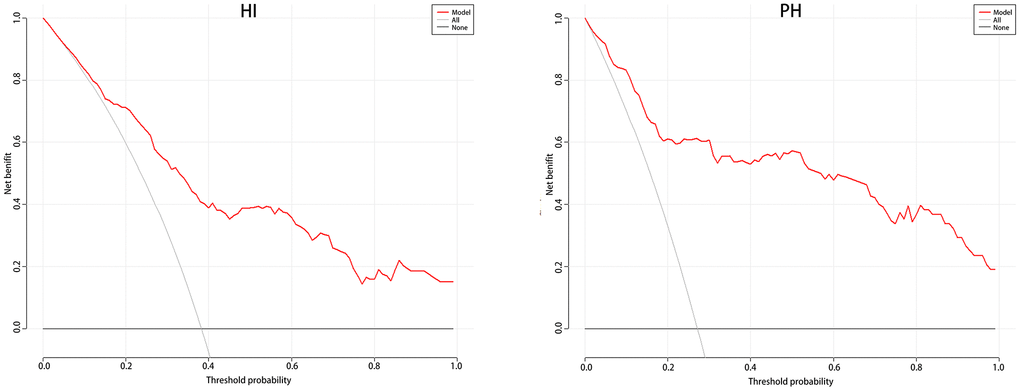
Figure 6. The DCA for HI and PH in LAA patients. Abbreviation: DCA: Decision Curve Analysis; LAA: large artery atherosclerosis.