IVW results
Figure 2 contains the forest plot of estimates and 95% CIs representing the effect of each SNP of Set 3 on T2DM. The combined effect of all 23 SNPs on T2DM, as generated with the use of the IVW method, are shown in Table 2. The Beta value of elevated LDL-C associated with T2DM was 0.25 (95%CI 0.105~0.395, P-value=0.001). Similar Beta values were obtained using penalized IVW (Beta value 0.25; 95%CI 0.105~0.395; P-value=0.001), robust IVW (Beta value 0.24; 95%CI 0.087~0.393, P-value=0.002) and penalized robust IVW (Beta value 0.24, 95%CI 0.087~0.393, P-value=0.002) (Table 2). Taken together, these results demonstrate that elevated LDL-C levels significantly increased the risk of T2DM.
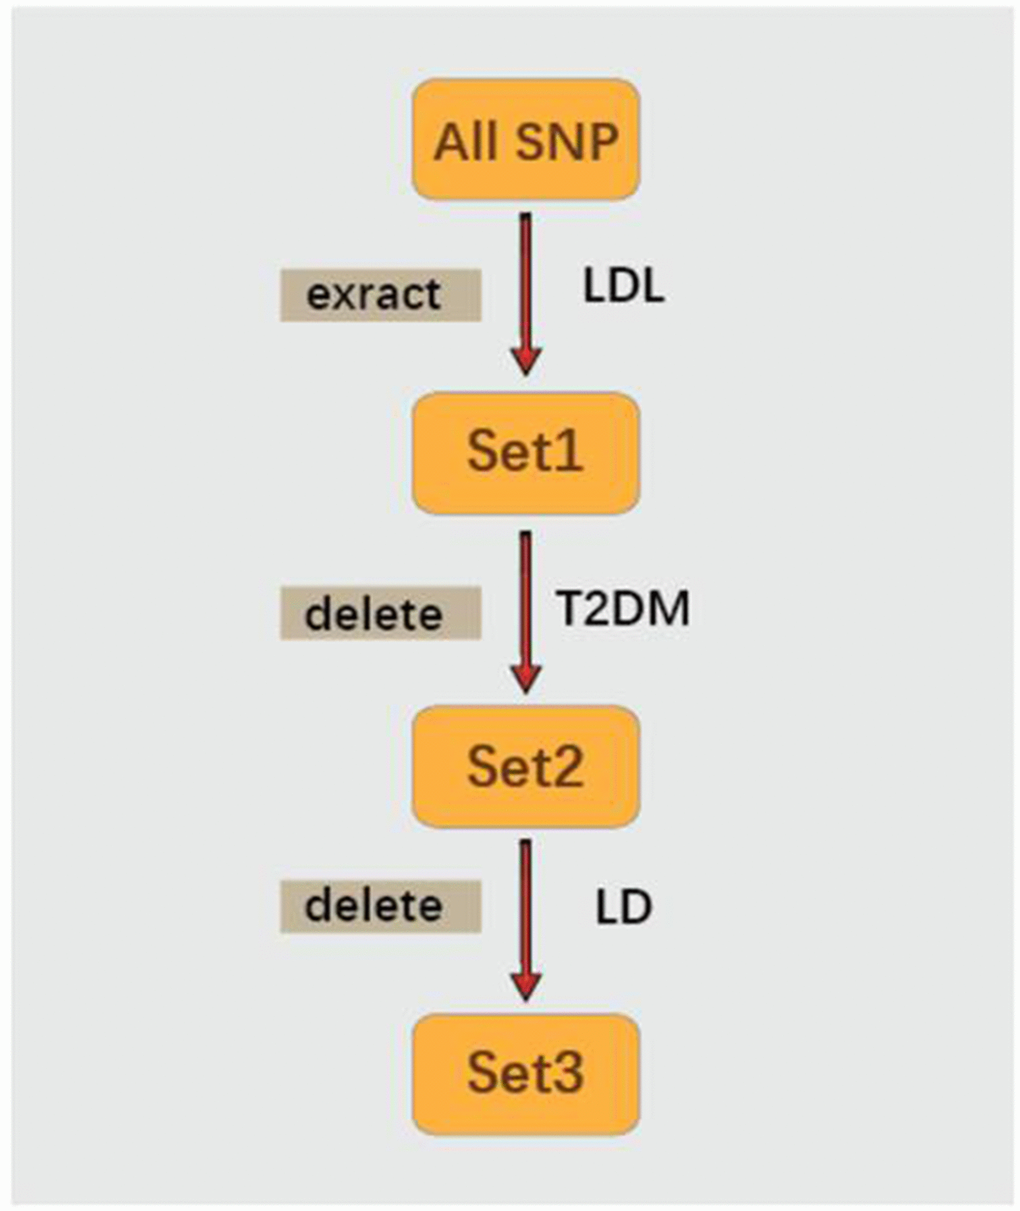
Figure 2. Forest plot of the ORs and 95%CIs of the instrumental variables.
Table 2. The effect of LDL-C on T2DM estimated using IVW and MR-Egger methods.
| Method | Beta | Std error | 95% CI | P-value |
| IVW | 0.250 | 0.074 | 0.105 | 0.395 | 0.001 |
| Penalized IVW | 0.250 | 0.074 | 0.105 | 0.395 | 0.001 |
| Robust IVW | 0.240 | 0.078 | 0.087 | 0.393 | 0.002 |
| Penalized robust IVW | 0.240 | 0.078 | 0.087 | 0.393 | 0.002 |
| MR-Egger | 0.062 | 0.146 | -0.224 | 0.348 | 0.670 |
| (intercept) | 0.011 | 0.007 | -0.003 | 0.025 | 0.135 |
| Penalized MR-Egger | 0.062 | 0.146 | -0.224 | 0.348 | 0.670 |
| (intercept) | 0.011 | 0.007 | -0.003 | 0.025 | 0.135 |
| Robust MR-Egger | 0.070 | 0.078 | -0.082 | 0.222 | 0.367 |
| (intercept) | 0.010 | 0.006 | -0.001 | 0.021 | 0.072 |
| Penalized robust MR-Egger | 0.070 | 0.078 | -0.082 | 0.222 | 0.367 |
| (intercept) | 0.010 | 0.006 | -0.001 | 0.021 | 0.072 |
| CI, confidence intervals; IVW, inverse-variance weighted; LDL-C, low-density lipoprotein cholesterol; |
| OR, odds ratio; SE, standard error; T2DM, type 2 Diabetes Mellitus. |
Table 3 shows the sensitivity analysis result of SNPs based on leave-one-out validation. The estimate have a great change after removing rs1367117 or rs11220462 but not after removing other SNPs. These results demonstrated that rs1367117 or rs11220462 drive the Penalized robust IVW estimate.
Table 3. The sensitivity analysis result of SNPs based on leave-one-out validation.
| SNP | Beta | SE | 95%CI | P value |
| rs267733 | 0.159 | 0.074 | 0.014 | 0.303 | 0.015 |
| rs2710642 | 0.144 | 0.074 | -0.001 | 0.289 | 0.032 |
| rs10490626 | 0.153 | 0.074 | 0.008 | 0.298 | 0.023 |
| rs2030746 | 0.144 | 0.074 | 0 | 0.289 | 0.032 |
| rs1250229 | 0.144 | 0.074 | -0.001 | 0.289 | 0.032 |
| rs7640978 | 0.149 | 0.074 | 0.005 | 0.294 | 0.028 |
| rs17404153 | 0.15 | 0.074 | 0.005 | 0.295 | 0.027 |
| rs4530754 | 0.138 | 0.074 | -0.008 | 0.283 | 0.035 |
| rs4722551 | 0.15 | 0.074 | 0.005 | 0.295 | 0.027 |
| rs10102164 | 0.129 | 0.074 | -0.016 | 0.275 | 0.036 |
| rs4942486 | 0.155 | 0.074 | 0.011 | 0.3 | 0.02 |
| rs364585 | 0.144 | 0.074 | -0.001 | 0.289 | 0.032 |
| rs2328223 | 0.138 | 0.074 | -0.007 | 0.283 | 0.032 |
| rs5763662 | 0.136 | 0.075 | -0.012 | 0.283 | 0.044 |
| rs2479409 | 0.18 | 0.077 | 0.028 | 0.331 | 0.009 |
| rs1367117 | 0.139 | 0.089 | -0.036 | 0.314 | 0.084 |
| rs4299376 | 0.196 | 0.08 | 0.04 | 0.352 | 0.005 |
| rs3757354 | 0.153 | 0.075 | 0.007 | 0.299 | 0.026 |
| rs1800562 | 0.152 | 0.074 | 0.008 | 0.297 | 0.023 |
| rs11220462 | 0.131 | 0.077 | -0.019 | 0.281 | 0.054 |
| rs8017377 | 0.142 | 0.074 | -0.003 | 0.287 | 0.033 |
| rs7206971 | 0.144 | 0.074 | -0.001 | 0.289 | 0.003 |
| rs6029526 | 0.134 | 0.075 | -0.013 | 0.281 | 0.044 |
| CI, confidence intervals; SE, standard error. |
Table 4 contains results from the combined effects of SNPs on T1DM. No statistically significant positive association was obtained between LDL-C and T1DM as revealed from the Beta (0.019, 95%CI -0.009~0.048, P-value=0.178), as well as from the robust IVW (Beta 0.014, 95%CI -0.003~0.031, P-value=0.099) and penalized robust IVW (Beta -0.202, 95%CI -2.888~2.484, P-value=0.883). Accordingly, LDL-C shows a specific relationship with T2DM, but not T1DM.
Table 4. The effect of LDL-C on T1DM estimated using IVW and MR-Egger methods.
| Method | Beta | Std error | 95% CI | P-value |
| IVW | 0.019 | 0.014 | -0.009 | 0.048 | 0.178 |
| Penalized IVW | 0.036 | 0.004 | 0.028 | 0.044 | 0.000 |
| Robust IVW | 0.014 | 0.009 | -0.003 | 0.031 | 0.099 |
| Penalized robust IVW | -0.202 | 1.370 | -2.888 | 2.484 | 0.883 |
| MR-Egger | 0.014 | 0.021 | -0.028 | 0.056 | 0.511 |
| (intercept) | 0.011 | 0.031 | -0.050 | 0.073 | 0.716 |
| Penalized MR-Egger | -0.006 | 0.048 | -0.100 | 0.088 | 0.898 |
| (intercept) | 0.039 | 0.045 | -0.049 | 0.127 | 0.383 |
| Robust MR-Egger | 0.011 | 0.011 | -0.010 | 0.031 | 0.319 |
| (intercept) | 0.009 | 0.027 | -0.044 | 0.062 | 0.729 |
| Penalized robust MR-Egger | 0.038 | 0.003 | 0.033 | 0.043 | 0.000 |
| (intercept) | -0.091 | 0.009 | -0.108 | -0.074 | 0.000 |
| CI, confidence intervals; IVW, inverse-variance weighted; LDL-C, low-density lipoprotein cholesterol; |
| OR, odds ratio; SE, standard error; T1DM, type 1 Diabetes Mellitus. |
The pleiotropic effects of these SNPs (IVs) were further estimated with use of robust and Penalized robust MR-Egger analyses. Results from these analyses revealed a Beta value of 0.062 (95%CI: -0.224~0.348, P=0.135) with an intercept of 0.011 (95% CI -0.003 to 0.025, P = 0.135). These findings indicate that a potential horizontal pleiotropic effect could bias our estimates (Table 2).
DISCUSSION
In this report, we utilized a two-sample MR approach to expose potential causal effects of LDL-C on the risk of T2DM. The 29 SNPs showing a significant correlation with LDL-C were extracted from results of the study by Henry et al [34] who reported causal effects between LDL-C and colorectal cancer. However, 6 SNPs related to T2DM were deleted. Data on the associations between SNPs and T2DM were sourced from diabetes genetics replication and meta-analysis (DIAGRAM) consortium. The remaining 23 SNPs without LD were then used as the IVs. Results from IVW and Penalized IVW methods, as well as from the robust IVW and Penalized robust IVW methods reveal that elevated LDL-C levels have a causal effect on the risk of T2DM.
Results from randomized controlled trials and meta-analysis had indicated that lipid lowering treatment may increase the risk of T2DM [12–18]. And, results from the longitudinal Framingham Heart Study, also suggested that low LDL-C levels were associated with T2DM. Accordingly, a notable relationship between LDL-C and T2DM was apparent, with lipid-lowering treatment being associated with increased risks of T2DM [35]. However, the overall average results from 10-year follow-up data (N = 1,819) in non-diabetic first-degree relatives of consecutive patients with T2DM 30-70 years old, not treated with lipid-lowering drugs, revealed that a higher LDL-C level was significantly associated with a higher risk of T2DM, independent of age, gender, fasting plasma glucose, waist circumference or blood pressure [36]. Therefore, based upon these findings, the role of LDL-C as a causal risk factor for T2DM remained uncertain.
Here, we utilize MR, a technique which can provide robust and reliable evidence, as a means for assessing the relationship between LDL-C and T2DM. A number of factors contribute to the strength of our findings. First, all of the data on SNPs as associated with LDL-C and SNPs as associated with T2DM were obtained from large-scale GWASs. Previous studies employing MR used only a single genetic variant and the association between a specific risk factor and disease were limited to a single study population. Recently, increasing use of genome-wide association studies (GWAS) have resulted in a large amount of genotype-phenotype association data and genotype-disease association data. Such data allows for numerous genetic variants identified from many exposures to be used in MR analysis, which enables the ability to acquire comprehensive information regarding associations between exposure factors and disease etiology [30].
Second, all of the 23 SNPs significantly related to LDL-C (P value < 5×10⁻⁸), but not related to T2DM, were extracted as the IVs. Swerdlow et al. [18] assessed associations between SNPs (rs17238484 and rs12916) of 3-hydroxy-3-methylglutaryl-coenzyme A reductase (HMGCR) and the prevalence and incidence of T2DM by meta-analysis in 223,463 individuals from 43 genetic studies. Their results indicated that the rs17238484-G allele seemed to be associated with a higher risk of type 2 diabetes (OR per allele 1.02, 95% CI 1.00-1.05) and the rs12916-T allele association was consistent (1.06, 1.03-1.09). Similar results were reported by Ference et al. [37]. They compared the effects of lower LDL-C cholesterol levels that were mediated by variants in proprotein convertase subtilisin-kexin type 9 (PCSK9), HMGCR, or both on the risk of cardiovascular events and risk of diabetes in 112,772 participants from 14 studies with use of the MR method. Variants in these two genes were associated with very similar effects on the risk of diabetes: OR for each 10 mg per deciliter decrease in LDL-C cholesterol was 1.11 (95% CI, 1.04 to 1.19) for PCSK9 and 1.13 (95% CI, 1.06 to 1.20) for HMGCR. Similar results were observed with regard to the risk for cardiovascular events. However, these studies only focused on genetic variants in HMGCR and PCSK9, which are the intended drug targets, rather than all SNPs related to LDL-C. In this way, they failed to fully explain the relationship between LDL-C and T2DM as was accomplished in our current study.
Finally, in this report we utilized the most recent methodological developments of MR, including Penalized IVW, Robust IVW and Penalized robust IVW methods, as sensitivity analyses to provide additional means for investigating any pleiotropic effects of the genetic variants. To serve as a valid instrument, genetic variants must satisfy the assumptions of a strong correlation with exposure but an absence of pleiotropic effects with the outcomes. However, due to the complexities of biological effects, pleiotropic effects of variants are often unavoidable. To avert such an eventuality it is necessary to evaluate the sensitivity of the results with use of sensitivity analysis for the hypothesis that the evidence is insufficient or even contrary to the situation. Therefore, we utilized robust IVW and Penalized robust IVW methods for the inference of consistent and robust casual estimations. Robust regression in an inverse-variance weighted method and a simple median of the causal estimates from the individual variants, have considerably improved Type 1 error rates compared with conventional methods in a wide variety of scenarios when up to 30% of the genetic variants are invalid instruments [38].
The advantage of MR analysis is that confounding factors should not be considered when using genetic variation as IVs, because genetic variation is free and not affected by confounding factors. In contrast, confounding factors can seriously affect the results of observational studies. Therefore, most of these observational studies should be adjusted for potential confounding factors. Another possible explanation for the differences in results generated in our current MR study from those of previous clinical trials and meta-analysis may be due to the relative short-term duration of the trials as opposed to lifetime exposures to natural genetic variation, and potentially undefined “off-target effects” of medical treatments on carbohydrate homeostasis [39]. In fact, in response to hypolipidemic drug-cholesteryl ester transfer protein (CETP) inhibitors, which do not detrimentally affect carbohydrate homeostasis, a lower incidence of new-onset DM was reported [40].
Here, we get the inconsistent results using the MR-Egger method. Different methods have their own advantages and disadvantages in terms of consistency of causal effect estimation and effectiveness. Thus, the causal relationship need to be verified using randomized controlled trial (RCT). The results of the MR-Egger method indicate that the selected SNPs may affect the outcome through other pathways, as conclusions from a single method may be somewhat one-sided. This possibility can only be verified with more reliable information, as there are no other statistical methods currently available which can explain whether the selected SNPs have pleiotropic effects. By comparing other disease phenotypes such as insulin resistance [41] and obesity [42], it does not appear that the selected SNPs affected T2DM through other pathways. Unfortunately, we cannot assess all potential associated pathways, therefore conclusions based on the known information have certain limitations. With future developments of new methods and the increased availability of information, it will be possible to verified whether our selected SNPs have pleiotropic effects.
Results from our two-sample MR approach for the association of LDL-C and T1DM were negative, which indicates that a causality between LDL-C and T1DM was not possible. Such findings are consistent with the phenomenon that patients with type 1 diabetes usually show no dyslipidemia [6].
There exist some limitations in our study. First, racial differences may contribute to inconsistencies in results. Notably, the data on SNPs as associated with LDL-C and T2DM were from European studies, which restricts definitive conclusions for other, non-European, populations. Second, it has been reported that some genetic variations such as those in HMGCR and PCSK9 are also related to changes in body weight and waist to hip ratios, which are known risk factors for new-onset DM [18, 43, 44]. Finally, as a result of unrecognized effects of genotypes on other risk factors, there exists the possibility of residual confounding.
In conclusion, with use of two-sample MR analysis, we established that elevated LDL-C levels were associated with an increased the risk of T2DM, but not T1DM. These findings provide strong evidence for the clinical application of lipid lowering drugs in patients with T2DM as a means to reduce their risk of cardiovascular disease.