


Introduction
Lung cancer is one of the leading causes of cancer mortality worldwide, with nearly 2.1 million new lung cancer cases and 1.8 million lung cancer deaths reported in 2018 [1]. Lung cancer incidence in the United States has improved significantly in men, but remains high in the women [2]. In China, the incidence of lung cancer has increased by 26.9% annually, and the numbers of lung cancer patients have doubled every 10 to 15 years in the last 50 years [3]. Moreover, in the last three decades, the mortality rate of lung cancer has increased by 465%, and replaced liver cancer as the most common malignant tumor in China [4]. The two main categories of lung cancer are small cell lung cancer (SCLC) and non-small cell lung cancer (NSCLC); NSCLC accounts for nearly 87% of all lung cancer cases, about 75% of which are diagnosed in the advanced stages with poor prognosis [5]. The 5-year survival rate of lung cancer patients is low and ranges from 5% to 31% [6, 7]. Radiotherapy is one of the main treatment modalities, especially for NSCLC patients that are not amenable for surgery [8–10]. The prognostic indicators in NSCLC patients include TNM stage [11], serum levels of tumor markers [12], tumor size [13], blood glucose levels, and treatment modalities [14, 15].
Ataxia telangiectasia mutated (ATM) gene is located on chromosome 11q 22.3 and encodes for the ATM protein that plays a significant role in DNA repair and cell cycle regulation [16, 17]. Previous case-control studies in Caucasian and Han Chinese populations have shown that several ATM gene polymorphisms are associated with increased risk of lung cancer [18–20]. However, their prognostic significance has not been studied in detail. Therefore, in this study, we analyzed the prognostic significance of four ATM SNPs in 720 Han Chinese NSCLC patients that received radiation or chemo-radiation therapy.
Results
General characteristics of the study population
We enrolled 720 NSCLC patients, including 335 males (46.5%) and 385 females (53.5%). We obtained their clinical and follow-up data to evaluate DFS and OS outcomes. Among these 720 patients, 497 (69.0%) were above 60 years, and 223 (31.0%) were ≤ 60 years of age. Furthermore, these patients included 370 (51.4%) smokers, 158 (21.9%) with squamous cell carcinoma, 358 (49.7%) with adenocarcinomas, and 204 (28.3%) with other cancer types. Moreover, 333 patients were diagnosed with stage IIIA and 387 with stage IIIB NSCLC. The cohort included 380 patients that received radiation therapy alone, whereas, the remaining 340 patients received chemoradiation therapy. While 357 patients received intensity-modulated radiation therapy (IMRT), 363 patients received three-dimensional conformal radiotherapy (3D-CRT) or another kind of radiotherapy. The median radiation dose received by this cohort was 65 Gy (419 patients received < 65 Gy and 419 received ≥ 65 Gy). The four ATM SNPs analyzed in this study were rs664143 (GG, GA and AA genotypes at nucleotide positions 148, 381 and 191, respectively), rs664677 (TT, TC, and CC genotypes at nucleotide positions 265, 282, and 173, respectively), rs189037 (AA, AG, and GG genotypes at nucleotide positions 172, 283, and 165, respectively), and rs373759 (TT, TC, and CC genotypes at nucleotide positions 227, 294 and 199, respectively). The baseline clinical characteristics of the study population are listed in Table 1.
Table 1. Relationship between clinical parameters and disease-free survival and overall survival in patients with NSCLC.
| Parameters | Category | Disease-free survival | Overall survival | ||||||||||||||||||||||||||||||||||||||||||||||||||||||||||||||||||||||||||||||||||||||||||||||||
| MST | Event/Total | Pa | HR (95%CI) | Pb | MST | Event/Total | Pa | HR (95%CI) | Pb | ||||||||||||||||||||||||||||||||||||||||||||||||||||||||||||||||||||||||||||||||||||||||||
| Age | ≤60 | 22.5 | 116/223 | 0.851 | 1.00 | 42.8 | 84/223 | 0.445 | 1.00 | ||||||||||||||||||||||||||||||||||||||||||||||||||||||||||||||||||||||||||||||||||||||||||
| >60 | 25.2 | 267/497 | 0.98 (0.79-1.22) | 0.851 | 38.7 | 209/497 | 1.10 (0.86-1.42) | 0.445 | |||||||||||||||||||||||||||||||||||||||||||||||||||||||||||||||||||||||||||||||||||||||||||
| Gender | Female | 28.9 | 224/385 | 0.003 | 1.00 | 44.5 | 169/385 | 1.00 | |||||||||||||||||||||||||||||||||||||||||||||||||||||||||||||||||||||||||||||||||||||||||||
| Male | 24.1 | 159/335 | 1.36 (1.11-1.67) | 0.003 | 30.3 | 124/335 | 0.118 | 1.20 (0.95-1.52) | 0.119 | ||||||||||||||||||||||||||||||||||||||||||||||||||||||||||||||||||||||||||||||||||||||||||
| Smoking | No | - | 136/350 | 1.00 | 57.9 | 110/350 | 1.00 | ||||||||||||||||||||||||||||||||||||||||||||||||||||||||||||||||||||||||||||||||||||||||||||
| Yes | 21.0 | 247/370 | <0.001 | 2.09 (1.70-2.58) | <0.001 | 34.9 | 183/370 | <0.001 | 1.69 (1.33-2.15) | <0.001 | |||||||||||||||||||||||||||||||||||||||||||||||||||||||||||||||||||||||||||||||||||||||||
| Histology | SCC | 24.5 | 92/158 | 0.130 | 1.00 | 52.9 | 57/158 | 0.058 | 1.00 | ||||||||||||||||||||||||||||||||||||||||||||||||||||||||||||||||||||||||||||||||||||||||||
| ADC | 23.1 | 191/358 | 1.08 (0.84-1.38) | 0.567 | 36.4 | 158/358 | 1.40 (0.98-1.90) | 0.068 | |||||||||||||||||||||||||||||||||||||||||||||||||||||||||||||||||||||||||||||||||||||||||||
| Other | 28.9 | 100/204 | 0.84 (0.63-1.11) | 0.224 | 31.7 | 78/204 | 1.02 (0.72-1.44) | 0.910 | |||||||||||||||||||||||||||||||||||||||||||||||||||||||||||||||||||||||||||||||||||||||||||
| Stage | IIIA | 43.1 | 142/333 | <0.001 | 1.00 | 52.9 | 119/333 | 0.005 | 1.00 | ||||||||||||||||||||||||||||||||||||||||||||||||||||||||||||||||||||||||||||||||||||||||||
| IIIB | 22.7 | 241/387 | 1.67 (1.36-2.05) | <0.001 | 36.7 | 174/387 | 1.39 (1.12-1.76) | 0.006 | |||||||||||||||||||||||||||||||||||||||||||||||||||||||||||||||||||||||||||||||||||||||||||
| Treatment | CRT | 40.4 | 149/340 | <0.001 | 1.00 | 52.7 | 122/340 | 0.013 | 1.00 | ||||||||||||||||||||||||||||||||||||||||||||||||||||||||||||||||||||||||||||||||||||||||||
| RT | 22.0 | 234/380 | 1.63 (1.33-2.01) | <0.001 | 37.8 | 171/380 | 1.34 (1.16-1.69) | 0.014 | |||||||||||||||||||||||||||||||||||||||||||||||||||||||||||||||||||||||||||||||||||||||||||
| Radiation technique | IMRT | 28.9 | 170/357 | 0.006 | 1.00 | 42.7 | 136/357 | 0.378 | 1.00 | ||||||||||||||||||||||||||||||||||||||||||||||||||||||||||||||||||||||||||||||||||||||||||
| 3D-CRT and other | 24.7 | 213/363 | 1.33 (0.99-1.62) | 0.056 | 41.1 | 157/363 | 1.11 (0.88-1.40) | 0.379 | |||||||||||||||||||||||||||||||||||||||||||||||||||||||||||||||||||||||||||||||||||||||||||
| Does | ≥65Gy | 29.6 | 243/419 | 0.001 | 1.00 | 42.6 | 117/301 | 0.136 | 1.00 | ||||||||||||||||||||||||||||||||||||||||||||||||||||||||||||||||||||||||||||||||||||||||||
| <65Gy | 23.1 | 140/301 | 1.42 (1.15-1.75) | 0.001 | 38.2 | 176/419 | 1.29 (1.25-1.51) | 0.013 | |||||||||||||||||||||||||||||||||||||||||||||||||||||||||||||||||||||||||||||||||||||||||||
| Pa, Log-rank P; Pb, univariate cox regression; MST, median survival time; RT, radiation therapy; CRT, chemoradiation therapy; SCC, squamous cell carcinoma. | |||||||||||||||||||||||||||||||||||||||||||||||||||||||||||||||||||||||||||||||||||||||||||||||||||
| ADC, adenocarcinoma; IMRT, Intensity Modulated Radiation Therapy; 3D-CRT, three-dimensional conformal radiotherapy. | |||||||||||||||||||||||||||||||||||||||||||||||||||||||||||||||||||||||||||||||||||||||||||||||||||
Clinical characteristics and prognosis of NSCLC patients
The median follow-up time was 36.4 months (range: 2.9–94.6 months) and 293 patients died before the last follow-up. The median DFS was 24.5 months, and 383 patients showed disease progression. Kaplan–Meier survival curve analysis showed that gender (P = 0.003), smoking (P < 0.001), TNM stage (P < 0.001), treatment modality (P < 0.001), and radiation dose (P = 0.001) were significantly associated with DFS and OS. Patients with stage IIIB tumors showed significantly shorter DFS (HR = 1.67, 95%CI = 1.36–2.05, P < 0.001) and OS (HR = 1.39, 95%CI = 1.12–1.76, P = 0.006) than stage IIIA lung cancer patients. The survival time was significantly longer for patients treated with chemoradiation therapy than those treated with radiation therapy alone (40.4 vs. 22.0 months, P < 0.001). Moreover, patients treated with radiation therapy alone had worse survival outcomes than those treated with combination of chemo and radiation therapy (HR = 1.34, 95%CI = 1.16–1.69, P = 0.014). The OS rates for smoking NSCLC patients was significantly shorter than the non-smoking NSCLC patients (HR = 1.69, 95%CI = 1.69-1.33–2.15, P < 0.001). Patients that received a radiation dose < 65 Gy showed worse DFS rates (HR = 1.42, 95%CI = 1.15–1.75, P = 0.001) and OS (HR = 1.29, 95%CI = 1.25–1.51, P = 0.013) than NSCLC patients that received a radiation dose ≥ 65 Gy.
ATM SNPs and survival outcomes of NSCLC patients
Univariate analyses showed that two ATM SNPs, rs664143 and rs189037, as shown in Supplementary Figure 1, were significantly associated with DFS and OS, but, the other two ATM SNPs, rs664677 and rs373759, did not show any significant correlation with survival outcomes (Table 2).
Table 2. Associations of ATM gene with DFS and OS in patients with NSCLC.
| SNP | Disease-free survival | Overall survival | |||||||||||||||||||||||||||||||||||||||||||||||||||||||||||||||||||||||||||||||||||||||||||||||||
| Event/No. | MST | Pa | Adjusted HR (95%CI) | Pb | Event/No. | MST | Pa | Adjusted HR (95%CI) | Pb | ||||||||||||||||||||||||||||||||||||||||||||||||||||||||||||||||||||||||||||||||||||||||||
| rs664143 | |||||||||||||||||||||||||||||||||||||||||||||||||||||||||||||||||||||||||||||||||||||||||||||||||||
| GG | 58/148 | 33.4 | 0.008 | 1.00 | 43/148 | 44.0 | 0.029 | 1.00 | |||||||||||||||||||||||||||||||||||||||||||||||||||||||||||||||||||||||||||||||||||||||||||
| GA | 219/381 | 24.3 | 1.41(1.05-1.89) | 0.023 | 166/381 | 37.8 | 1.22(1.17-1.72) | 0.014 | |||||||||||||||||||||||||||||||||||||||||||||||||||||||||||||||||||||||||||||||||||||||||||
| AA | 106/191 | 22.7 | 1.38(1.01-1.91) | 0.034 | 84/191 | 33.6 | 1.40(1.23-2.04) | 0.024 | |||||||||||||||||||||||||||||||||||||||||||||||||||||||||||||||||||||||||||||||||||||||||||
| Trend | |||||||||||||||||||||||||||||||||||||||||||||||||||||||||||||||||||||||||||||||||||||||||||||||||||
| GG | 58/148 | 33.4 | 0.002 | 1.00 | 43/148 | 44.0 | 0.023 | 1.00 | |||||||||||||||||||||||||||||||||||||||||||||||||||||||||||||||||||||||||||||||||||||||||||
| GA+AA | 325/571 | 23.8 | 1.40(1.05-1.86) | 0.021 | 250/572 | 35.9 | 1.28(1.12-1.78) | 0.040 | |||||||||||||||||||||||||||||||||||||||||||||||||||||||||||||||||||||||||||||||||||||||||||
| GG+GA | 277/528 | 26.0 | 0.248 | 1.00 | 209/529 | 36.1 | 0.049 | 1.00 | |||||||||||||||||||||||||||||||||||||||||||||||||||||||||||||||||||||||||||||||||||||||||||
| AA | 106/191 | 22.7 | 1.06(0.85-1.33) | 0.596 | 84/191 | 33.6 | 1.20(0.93-1.55) | 0.164 | |||||||||||||||||||||||||||||||||||||||||||||||||||||||||||||||||||||||||||||||||||||||||||
| rs664677 | |||||||||||||||||||||||||||||||||||||||||||||||||||||||||||||||||||||||||||||||||||||||||||||||||||
| TT | 142/265 | 25.5 | 0.929 | 1.00 | 115/265 | 42.7 | 0.670 | 1.00 | |||||||||||||||||||||||||||||||||||||||||||||||||||||||||||||||||||||||||||||||||||||||||||
| TC | 152/282 | 24.1 | 1.11(0.88-1.40) | 0.379 | 116/282 | 38.7 | 1.13(0.87-1.47) | 0.348 | |||||||||||||||||||||||||||||||||||||||||||||||||||||||||||||||||||||||||||||||||||||||||||
| CC | 89/173 | 28.0 | 1.02(0.78-1.33) | 0.874 | 62/173 | 32.7 | 0.97(0.71-1.32) | 0.852 | |||||||||||||||||||||||||||||||||||||||||||||||||||||||||||||||||||||||||||||||||||||||||||
| Trend | |||||||||||||||||||||||||||||||||||||||||||||||||||||||||||||||||||||||||||||||||||||||||||||||||||
| TT | 160/259 | 25.5 | 0.928 | 1.00 | 115/265 | 42.7 | 0.888 | 1.00 | |||||||||||||||||||||||||||||||||||||||||||||||||||||||||||||||||||||||||||||||||||||||||||
| TC+CC | 241/455 | 24.5 | 0.97(0.77-1.22) | 0.777 | 178/455 | 35.7 | 1.07(0.85-1.36) | 0.575 | |||||||||||||||||||||||||||||||||||||||||||||||||||||||||||||||||||||||||||||||||||||||||||
| TT+TC | 294/547 | 28.0 | 0.766 | 1.00 | 231/547 | 33.4 | 0.465 | 1.00 | |||||||||||||||||||||||||||||||||||||||||||||||||||||||||||||||||||||||||||||||||||||||||||
| CC | 48/79 | 24.5 | 0.88(0.67-1.15) | 0.344 | 62/173 | 32.7 | 0.91(0.69-1.21) | 0.531 | |||||||||||||||||||||||||||||||||||||||||||||||||||||||||||||||||||||||||||||||||||||||||||
| rs189037 | |||||||||||||||||||||||||||||||||||||||||||||||||||||||||||||||||||||||||||||||||||||||||||||||||||
| AA | 94/172 | 31.0 | 0.007 | 1.00 | 56/172 | 43.5 | <0.001 | 1.00 | |||||||||||||||||||||||||||||||||||||||||||||||||||||||||||||||||||||||||||||||||||||||||||
| AG | 221/383 | 23.8 | 1.48(1.18-2.03) | 0.014 | 192/383 | 34.9 | 1.76(1.21-2.45) | 0.001 | |||||||||||||||||||||||||||||||||||||||||||||||||||||||||||||||||||||||||||||||||||||||||||
| GG | 68/165 | 24.5 | 1.32(1.17-1.91) | 0.012 | 45/165 | 33.5 | 1.23(1.13-1.83) | 0.029 | |||||||||||||||||||||||||||||||||||||||||||||||||||||||||||||||||||||||||||||||||||||||||||
| Trend | |||||||||||||||||||||||||||||||||||||||||||||||||||||||||||||||||||||||||||||||||||||||||||||||||||
| AA | 94/172 | 31.0 | 0.004 | 1.000 | 53/172 | 43.5 | 0.001 | 1.00 | |||||||||||||||||||||||||||||||||||||||||||||||||||||||||||||||||||||||||||||||||||||||||||
| AG+GG | 289/548 | 24.1 | 1.44(1.06-1.95) | 0.019 | 237/548 | 36.0 | 1.16(1.17-2.21) | 0.004 | |||||||||||||||||||||||||||||||||||||||||||||||||||||||||||||||||||||||||||||||||||||||||||
| AA+AG | 315/555 | 24.7 | 0.523 | 1.00 | 248/555 | 37.8 | 0.145 | 1.00 | |||||||||||||||||||||||||||||||||||||||||||||||||||||||||||||||||||||||||||||||||||||||||||
| GG | 68/165 | 24.5 | 0.98(0.75-1.29) | 0.906 | 45/165 | 33.5 | 0.80(0.60-1.08) | 0.141 | |||||||||||||||||||||||||||||||||||||||||||||||||||||||||||||||||||||||||||||||||||||||||||
| rs373759 | |||||||||||||||||||||||||||||||||||||||||||||||||||||||||||||||||||||||||||||||||||||||||||||||||||
| TT | 122/227 | 25.2 | 0.508 | 1.00 | 103/227 | 35.6 | 0.103 | 1.00 | |||||||||||||||||||||||||||||||||||||||||||||||||||||||||||||||||||||||||||||||||||||||||||
| TC | 157/294 | 23.1 | 1.14(0.90-1.45) | 0.286 | 117/294 | 34.9 | 1.08(0.82-1.41) | 0.590 | |||||||||||||||||||||||||||||||||||||||||||||||||||||||||||||||||||||||||||||||||||||||||||
| CC | 104/199 | 29.0 | 0.99(0.76-1.30) | 0.968 | 73/199 | 44.9 | 0.81(0.60-1.10) | 0.814 | |||||||||||||||||||||||||||||||||||||||||||||||||||||||||||||||||||||||||||||||||||||||||||
| Trend | |||||||||||||||||||||||||||||||||||||||||||||||||||||||||||||||||||||||||||||||||||||||||||||||||||
| TT | 122/227 | 25.2 | 0.908 | 1.00 | 103/227 | 35.6 | 0.489 | 1.00 | |||||||||||||||||||||||||||||||||||||||||||||||||||||||||||||||||||||||||||||||||||||||||||
| TC+CC | 261/493 | 24.5 | 1.07(0.87-1.34) | 0.496 | 190/493 | 41.8 | 0.96(0.75-1.22) | 0.739 | |||||||||||||||||||||||||||||||||||||||||||||||||||||||||||||||||||||||||||||||||||||||||||
| TT+TC | 279/521 | 29.0 | 0.324 | 1.00 | 220/521 | 35.4 | 0.035 | 1.00 | |||||||||||||||||||||||||||||||||||||||||||||||||||||||||||||||||||||||||||||||||||||||||||
| CC | 104/199 | 24.7 | 0.92(0.73-1.17) | 0.505 | 73/199 | 44.9 | 0.78(0.60-1.02) | 0.074 | |||||||||||||||||||||||||||||||||||||||||||||||||||||||||||||||||||||||||||||||||||||||||||
| Number of risk allele* | |||||||||||||||||||||||||||||||||||||||||||||||||||||||||||||||||||||||||||||||||||||||||||||||||||
| 0 | 14/35 | 33.6 | <0.001 | 1.00 | 7/35 | - | 0.002 | 1.00 | |||||||||||||||||||||||||||||||||||||||||||||||||||||||||||||||||||||||||||||||||||||||||||
| 1 | 85/155 | 24.5 | 1.37(0.78-2.41) | 0.279 | 58/155 | 52.9 | 1.59(0.73-3.49) | 0.244 | |||||||||||||||||||||||||||||||||||||||||||||||||||||||||||||||||||||||||||||||||||||||||||
| 2 | 164/310 | 26.7 | 1.30(0.75-2.42) | 0.138 | 137/310 | 36.9 | 1.82(0.85-3.89) | 0.122 | |||||||||||||||||||||||||||||||||||||||||||||||||||||||||||||||||||||||||||||||||||||||||||
| 3 | 106/180 | - | 1.53(1.13-2.66) | 0.004 | 81/180 | 35.5 | 2.01(1.13-4.35) | 0.017 | |||||||||||||||||||||||||||||||||||||||||||||||||||||||||||||||||||||||||||||||||||||||||||
| 4 | 14/40 | 19.7 | 2.91(1.43-3.93) | <0.001 | 10/40 | 28.6 | 1.42(1.22-2.95) | <0.001 | |||||||||||||||||||||||||||||||||||||||||||||||||||||||||||||||||||||||||||||||||||||||||||
| Pa, Log-rank P; Pb, cox regression for adjusting age, gender, smoking, histology, stage, treatment, radiation technique, does; MST, median survival time. | |||||||||||||||||||||||||||||||||||||||||||||||||||||||||||||||||||||||||||||||||||||||||||||||||||
| Trend: the prognosis showed an increased or decreased changed with the number of risk allele. | |||||||||||||||||||||||||||||||||||||||||||||||||||||||||||||||||||||||||||||||||||||||||||||||||||
| *Number of risk allele: For rs664143(A) and rs189037(G): 0(GG+AA), 1(GG+AG, GA+AA), 3(AA+AG, GA+GG), 4(AA+GG). | |||||||||||||||||||||||||||||||||||||||||||||||||||||||||||||||||||||||||||||||||||||||||||||||||||
The patients with ATM rs664143 AA and GA genotypes showed significantly shorter DFS (median survival time or MST (month): 22.7 vs. 24.3 vs. 33.4; P = 0.008; Figure 1A) and OS (MST: 33.6 vs. 37.8 vs. 52.9 months; P = 0.029; Figure 1C) than patients with the rs664143 GG genotype. After adjusting for clinical parameters, Cox regression analysis showed that patients with ATM rs664143 AA or GA genotypes showed worse survival outcomes than those with the rs664143 GG phenotype (AA vs. GG, HR: 1.38, 95%CI = 1.01-1.19, P = 0.034; GA vs. GG, 1.41, 95%CI = 1.05–1.89, P = 0.023). The rs664143 G allele showed dominant effect than the rs664143 A allele (GA/AA vs. GG: P = 0.002 for DFS, Figure 1B; P = 0.023 for OS, Figure 1D). According to multivariate Cox regression analysis, patients with rs664143 GA and rs664143 AA genotypes showed worse DFS (HR = 1.40, 95%CI = 1.05–1.86, P = 0.021) and OS (HR = 1.28, 95%CI = 1.12–1.78, P = 0.040) than those with the rs664143 GG phenotype. Patients with the ATM rs189037 GG and rs189037 AG genotypes showed significantly shorter DFS (MST: 24.5 vs. 23.8 vs. 31.0 months, P = 0.007, Figure 2A) and OS (MST: 33.5 vs. 34.9 vs. 43.5, P < 0.001, Figure 2C) than those with the rs189037 AA genotype. After adjusting for clinical parameters, Cox regression analysis showed that patients with rs189037 GG or AG genotypes had worse DFS (GG vs. AA: HR = 1.32, 95%CI = 1.17–1.91, P = 0.012; AG vs. AA: HR = 1.48, 95%CI = 1.18–2.03, P = 0.014; Table 2) and OS (GG vs. AA: HR = 1.23, 95%CI = 1.13–1.83, P = 0.029; AG vs. AA: HR = 1.76, 95%CI = 1.21–2.45, P = 0.001) than those with rs189037 AA. The rs189037 G allele exhibited dominant effect than the rs189037 A allele (DFS: P = 0.004, Figure 2B; OS: P = 0.001, Figure 2D). Multivariate Cox regression analysis showed worse survival outcomes for patients with the rs189037 AG and GG genotypes than those with the rs189037 AA genotype (AG/GG vs. AA: DFS, HR = 1.44, 95%CI = 1.06–1.95, P = 0.019; OS, HR = 1.16, 95%CI = 1.16–1.17–2.21, P = 0.004; Table 2).
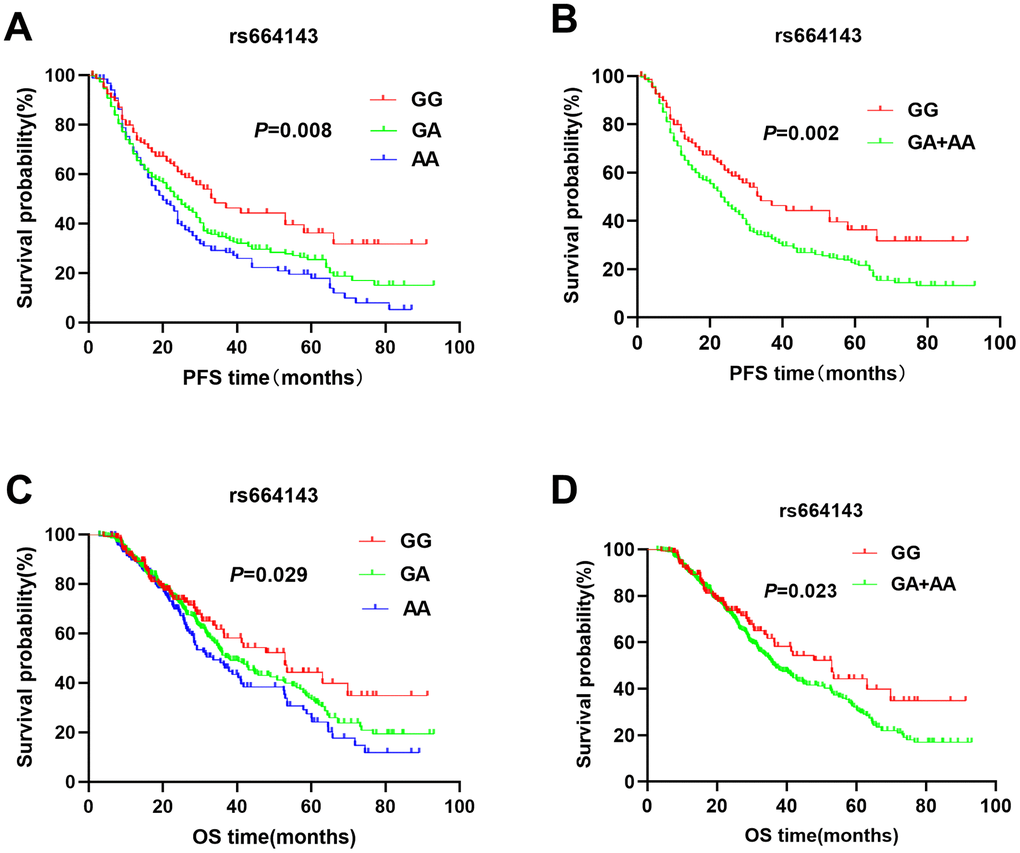
Figure 1. Kaplan-Meier survival curve analysis shows disease-free survival (A) GG vs. GA vs. AA, (B) GA/AA vs. GG); and overall survival (C) GG vs. GA vs. AA, (D) GA/AA vs. GG, of NSCLC patients with ATM rs664143 genotypes that are treated with radiation or chemoradiation therapies.
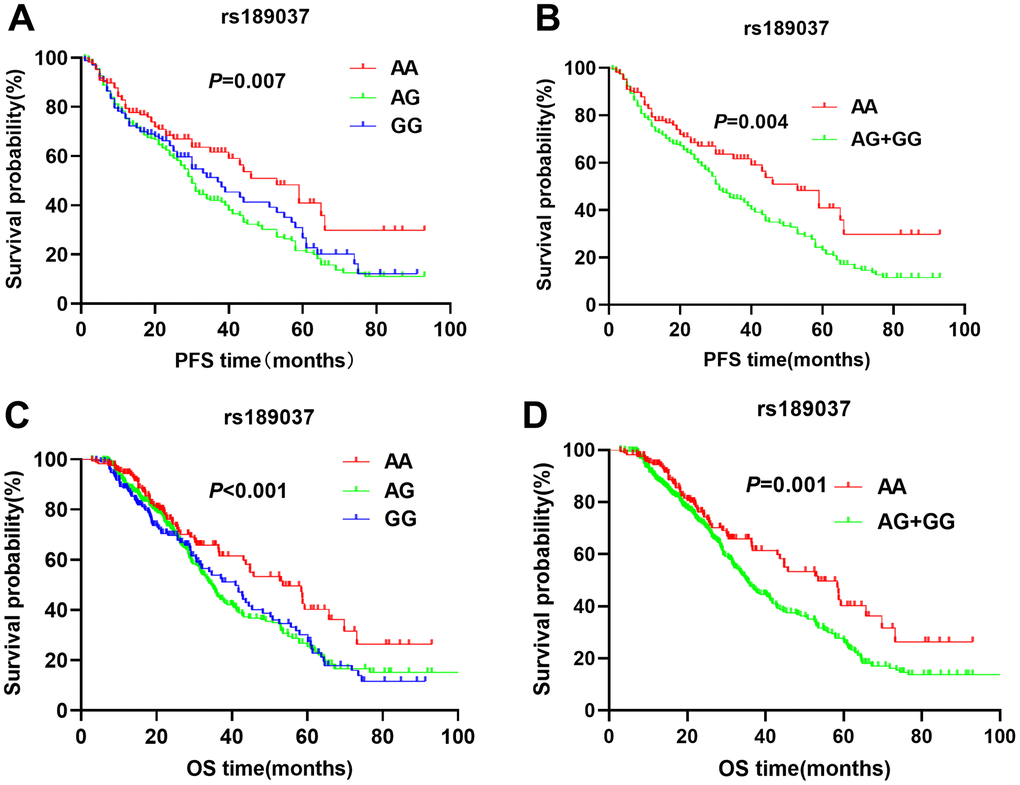
Figure 2. Kaplan-Meier survival curve analysis shows disease-free survival (A) AA vs. AG vs. GG, (B) AG/GG vs. AA; and overall survival (C) AA vs. AG vs. GG, (D) AG/GG vs. AA, of NSCLC patients with ATM rs189037 genotypes that are treated with radiation or chemoradiation therapies.
We also compared the association between the number of risk alleles (rs664143 and 189037) and survival outcomes, DFS and OS. The results showed that patients with the risk alleles were associated with worse DFS and OS compared to those without a risk allele (Table 2). As shown in Table 3, three SNPs (rs664143, rs664677, and rs373759) showed a prior false-positive probability of 0.1.
Table 3. False-positive reports probability values for associations between gene and survival outcomes.
| SNP | Disease-free survival | Overall survival | ||||||||||
| HR (95%CI) | Pb | Statistical power | Prior probability | HR (95%CI) | Pb | Statistical power | Prior probability | |||||
| 0.2 | 0.1 | 0.01 | 0.2 | 0.1 | 0.01 | |||||||
| rs664143 | ||||||||||||
| GA vs. GG | 1.41(1.05-1.89) | 0.023 | 0.741 | 0.162 | 0.305 | 0.816 | 1.22(1.17-1.72) | 0.014 | 0.634 | 0.106 | 0.301 | 0.764 |
| AA vs. GG | 1.38(1.01-1.91) | 0.034 | 0.720 | 0.221 | 0.396 | 0.875 | 1.40(1.23-2.04) | 0.024 | 0.821 | 0.035 | 0.074 | 0.612 |
| GA/AA vs.GG | 1.40(1.05-1.86) | 0.021 | 0.712 | 0.111 | 0.198 | 0.801 | 1.28(1.12-1.78) | 0.040 | 0.903 | 0.161 | 0.254 | 0.821 |
| rs664677 | ||||||||||||
| TCvs.TT | 1.11(0.88-1.40) | 0.379 | 0.701 | 0.221 | 0.297 | 0.897 | 1.13(0.87-1.47) | 0.348 | 0.706 | 0.085 | 0.234 | 0.681 |
| CC vs.TT | 1.02(0.78-1.33) | 0.874 | 0.623 | 0.047 | 0.110 | 0.654 | 0.97(0.71-1.32) | 0.852 | 0.764 | 0.002 | 0.097 | 0.101 |
| TC/CCvs.TT | 0.97(0.77-1.22) | 0.777 | 0.713 | 0.051 | 0.055 | 0.635 | 1.07(0.85-1.36) | 0.575 | 0.934 | 0.001 | 0.216 | 0.024 |
| rs189037 | ||||||||||||
| GA vs. AA | 1.48(1.08-2.03) | 0.014 | 0.769 | 0.135 | 0.291 | 0.841 | 1.76(1.21-2.45) | 0.001 | 0.638 | 0.006 | 0.204 | 0.883 |
| GG vs. AA | 1.32(1.17-1.91) | 0.012 | 0.812 | 0.062 | 0.154 | 0.734 | 1.23(1.13-1.83) | 0.029 | 0.694 | 0.012 | 0.114 | 0.154 |
| GG/GA vs. AA | 1.44(1.06-1.95) | 0.019 | 0.934 | 0.216 | 0.221 | 0.886 | 1.16(1.17-2.21) | 0.004 | 0.824 | 0.031 | 0.310 | 0.135 |
| rs373759 | ||||||||||||
| TC vs. TT | 1.14(0.90-1.45) | 0.286 | 0.685 | 0.253 | 0.442 | 0.885 | 1.08(0.82-1.41) | 0.590 | 0.768 | 0.015 | 0.014 | 0.621 |
| CC vs. TT | 0.99(0.76-1.30) | 0.968 | 0.821 | 0.131 | 0.241 | 0.769 | 0.81(0.60-1.10) | 0.814 | 0.836 | 0.026 | 0.004 | 0.412 |
| TC/CC vs. TT | 1.07(0.87-1.34) | 0.496 | 0.932 | 0.468 | 0.468 | 0.908 | 0.96(0.75-1.22) | 0.739 | 0.931 | 0.018 | 0.031 | 0.232 |
Subgroup analysis of ATM SNPs and NSCLC prognosis
We performed subgroup analysis with clinical factors such as smoking, histology, tumor stage, treatment, and radiation dose that are significantly associated with DFS and OS. The subgroup analysis showed that rs664143 and rs189037 were significantly associated with DFS and OS in both IIIA and IIIB stages (Table 4 and Table 5). NSCLC patients with ATM rs664143 GA and AA genotypes showed worse DFS (stage IIIA: adjusted HR = 1.34, 95%CI = 1.18–2.05, P = 0.022; stage IIIB: adjusted HR = 1.52, 95%CI = 1.04–2.22, P = 0.030) and OS (stage IIIA: adjusted HR = 1.29, 95%CI = 1.18–2.09, P = 0.028; stage IIIB: adjusted HR = 1.51, 95%CI = 1.17–2.37, P = 0.021) than patients with the rs664143 GG genotype. Stage IIIA and IIIB NSCLC patients with rs189037 AG/GG genotypes showed significantly shorter median survival times than those with the rs189037 AA genotype (Stage IIIA: 39.0 vs. 58.6 months; stage IIIB: 27.1 vs. 43.7 months; Table 4). Cox regression analysis after adjustment showed shorter DFS and OS for the rs189037 AG/GG genotypes in than those with the rs189037 AA genotype in stage IIIA NSCLC (DFS: adjusted HR, 1.43; 95% CI = 1.31–2.22, P = 0.037; OS: adjusted HR, 1.62;(95%CI = 1.02–2.57, P = 0.042; Table 5) and stage IIIB NSCLC (DFS: adjusted HR,1.55; 95% CI = 1.05–2.38, P = 0.029; OS: adjusted HR, 1.69; 95% CI = 1.09–2.65, P = 0.020; Table 5). Moreover, patients with rs664143 and rs189037 SNPs that were smokers and received radiation therapy (RT) with a radiation dose > 65 Gy showed worse survival outcomes than patients that were non-smokers and received chemo-radiation therapy (CRT) with a radiation dose ≤65 Gy, respectively (Tables 4, 5). Furthermore, based on histology, the rs664143 and rs189037 gene polymorphisms were associated with DFS and OS among the patients with adenocarcinomas (ADC) as shown in Tables 4, 5.
Table 4. Subgroup multivariate analysis of clinical parameters for rs664143 and survival outcomes.
| Parameters | Subgroup | Genotype | Disease-free survival | Overall survival | |||||||||||||||||||||||||||||||||||||||||||||||||||||||||||||||||||||||||||||||||||||||||||||||
| Event/No. | MST (month) | Pa | HR* (95%CI) | Pb | Event/No. | MST (month) | Pa | HR* (95%CI) | Pb | ||||||||||||||||||||||||||||||||||||||||||||||||||||||||||||||||||||||||||||||||||||||||||
| rs664143 | |||||||||||||||||||||||||||||||||||||||||||||||||||||||||||||||||||||||||||||||||||||||||||||||||||
| Smoking | Yes | GG | 34/62 | 24.1 | 1.00 | 27/62 | 36.4 | 1.00 | |||||||||||||||||||||||||||||||||||||||||||||||||||||||||||||||||||||||||||||||||||||||||||
| GA | 145/207 | 21.0 | 0.204 | 1.46(0.99-2.15) | 0.057 | 105/207 | 35.6 | 0.838 | 0.98(0.63-1.51) | 0.930 | |||||||||||||||||||||||||||||||||||||||||||||||||||||||||||||||||||||||||||||||||||||||||
| AA | 68/101 | 17.0 | 0.013 | 1.65(1.32-2.07) | 0.026 | 51/101 | 21.2 | 0.023 | 1.10(1.09-1.77) | 0.037 | |||||||||||||||||||||||||||||||||||||||||||||||||||||||||||||||||||||||||||||||||||||||||
| GA+AA | 213/308 | 19.5 | 0.033 | 1.42(1.06-2.08) | 0.047 | 156/308 | 29.4 | 0.014 | 1.31(1.27-1.53) | 0.029 | |||||||||||||||||||||||||||||||||||||||||||||||||||||||||||||||||||||||||||||||||||||||||
| No | GG | 24/86 | - | 1.00 | 16/86 | - | 1.00 | ||||||||||||||||||||||||||||||||||||||||||||||||||||||||||||||||||||||||||||||||||||||||||||
| GA | 74/174 | 43.1 | 0.058 | 1.31(1.12-2.11) | 0.024 | 61/174 | 52.5 | 0.031 | 1.59(0.91-2.79) | 0.103 | |||||||||||||||||||||||||||||||||||||||||||||||||||||||||||||||||||||||||||||||||||||||||
| AA | 38/90 | 39.0 | 0.022 | 1.36(1.14-2.29) | 0.026 | 33/90 | 34.5 | 0.011 | 1.86(1.01-3.43) | 0.047 | |||||||||||||||||||||||||||||||||||||||||||||||||||||||||||||||||||||||||||||||||||||||||
| GA+AA | 112/264 | 39.0 | 0.034 | 1.33(1.15-2.09) | 0.022 | 94/264 | 44.5 | 0.015 | 1.67(1.27-2.87) | 0.023 | |||||||||||||||||||||||||||||||||||||||||||||||||||||||||||||||||||||||||||||||||||||||||
| Histology | SCC | GG | 14/31 | - | 1.00 | 7/31 | - | 1.00 | |||||||||||||||||||||||||||||||||||||||||||||||||||||||||||||||||||||||||||||||||||||||||||
| GA | 55/87 | 22.7 | 0.422 | 1.28(0.71-2.30) | 0.416 | 34/87 | 62.8 | 0.455 | 1.32(0.59-2.99) | 0.501 | |||||||||||||||||||||||||||||||||||||||||||||||||||||||||||||||||||||||||||||||||||||||||
| AA | 23/40 | 23.5 | 0.637 | 1.15(0.59-2.42) | 0.674 | 16/40 | 36.7 | 0.367 | 1.59(0.65-3.87) | 0.308 | |||||||||||||||||||||||||||||||||||||||||||||||||||||||||||||||||||||||||||||||||||||||||
| GA+AA | 78/127 | 22.5 | 0.461 | 1.24(0.70-2.19) | 0.464 | 50/127 | 52.9 | 1.40(0.63-3.09) | 0.407 | ||||||||||||||||||||||||||||||||||||||||||||||||||||||||||||||||||||||||||||||||||||||||||
| ADC | GG | 30/80 | 43.1 | 1.00 | 24/80 | - | 1.00 | ||||||||||||||||||||||||||||||||||||||||||||||||||||||||||||||||||||||||||||||||||||||||||||
| GA | 111/186 | 20.7 | 0.008 | 1.72(1.15-2.58) | 0.008 | 92/186 | 35.9 | 0.049 | 1.57(0.99-2.45) | 0.051 | |||||||||||||||||||||||||||||||||||||||||||||||||||||||||||||||||||||||||||||||||||||||||
| AA | 50/92 | 22.5 | 0.051 | 1.57(1.00-2.47) | 0.052 | 42/92 | 39.2 | 0.055 | 1.65(1.01-2.73) | 0.050 | |||||||||||||||||||||||||||||||||||||||||||||||||||||||||||||||||||||||||||||||||||||||||
| GA+AA | 160/278 | 0.009 | 1.67(1.31-2.47) | 0.010 | 134/278 | 36.4 | 1.59(1.03-2.46) | 0.036 | |||||||||||||||||||||||||||||||||||||||||||||||||||||||||||||||||||||||||||||||||||||||||||
| Other | GG | 14/37 | 30.8 | 1.00 | 12/37 | 52.9 | 1.00 | ||||||||||||||||||||||||||||||||||||||||||||||||||||||||||||||||||||||||||||||||||||||||||||
| GA | 53/108 | 28.9 | 0.216 | 1.45(0.81-2.61) | 0.216 | 40/108 | 44.5 | 0.595 | 1.20(0.63-2.28) | 0.585 | |||||||||||||||||||||||||||||||||||||||||||||||||||||||||||||||||||||||||||||||||||||||||
| AA | 33/59 | 23.4 | 0.025 | 1.99(1.06-3.72) | 0.032 | 26/59 | 35.5 | 0.070 | 1.82(0.91-3.60) | 0.088 | |||||||||||||||||||||||||||||||||||||||||||||||||||||||||||||||||||||||||||||||||||||||||
| GA+AA | 86/167 | 23.8 | 0.091 | 1.62(0.92-2.85) | 0.096 | 66/167 | 41.7 | 1.38(0.75-2.56) | 0.303 | ||||||||||||||||||||||||||||||||||||||||||||||||||||||||||||||||||||||||||||||||||||||||||
| Stage | IIIA | GG | 27/84 | - | 1.00 | 21/68 | - | 1.00 | |||||||||||||||||||||||||||||||||||||||||||||||||||||||||||||||||||||||||||||||||||||||||||
| GA | 76/168 | 39.0 | 0.114 | 1.34(1.16-2.09) | 0.036 | 66/168 | 44.5 | 0.303 | 1.25(1.06-2.06) | 0.037 | |||||||||||||||||||||||||||||||||||||||||||||||||||||||||||||||||||||||||||||||||||||||||
| AA | 39/81 | 26.7 | 0.106 | 1.35(1.08-2.22) | 0.039 | 32/81 | 32.6 | 0.012 | 1.38(1.29-2.26) | 0.014 | |||||||||||||||||||||||||||||||||||||||||||||||||||||||||||||||||||||||||||||||||||||||||
| GA+AA | 115/249 | 39.0 | 0.085 | 1.34(1.18-2.05) | 0.014 | 98/249 | 37.5 | 0.008 | 1.29(1.18-2.09) | 0.028 | |||||||||||||||||||||||||||||||||||||||||||||||||||||||||||||||||||||||||||||||||||||||||
| IIIB | GG | 31/64 | 28.9 | 1.00 | 22/64 | 47.9 | 1.00 | ||||||||||||||||||||||||||||||||||||||||||||||||||||||||||||||||||||||||||||||||||||||||||||
| GA | 143/213 | 22.0 | 0.026 | 1.52(1.03-2.25) | 0.034 | 100/213 | 55.6 | 0.127 | 1.44(0.91-2.29) | 0.122 | |||||||||||||||||||||||||||||||||||||||||||||||||||||||||||||||||||||||||||||||||||||||||
| AA | 67/110 | 19.7 | 0.044 | 1.51(1.01-2.33) | 0.043 | 52/110 | 24.9 | 0.038 | 1.68(1.02-2.78) | 0.043 | |||||||||||||||||||||||||||||||||||||||||||||||||||||||||||||||||||||||||||||||||||||||||
| GA+AA | 210/323 | 21.8 | 0.020 | 1.52(1.04-2.22) | 0.030 | 152/323 | 36.9 | 0.005 | 1.51(1.17-2.37) | 0.021 | |||||||||||||||||||||||||||||||||||||||||||||||||||||||||||||||||||||||||||||||||||||||||
| Treatment | RT | GG | 31/65 | 28.9 | 1.00 | 22/65 | 47.9 | 1.00 | |||||||||||||||||||||||||||||||||||||||||||||||||||||||||||||||||||||||||||||||||||||||||||
| GA | 139/208 | 21.5 | 0.033 | 1.50(1.02-2.22) | 0.041 | 100/208 | 37.8 | 0.130 | 1.49(0.93-2.39) | 0.096 | |||||||||||||||||||||||||||||||||||||||||||||||||||||||||||||||||||||||||||||||||||||||||
| AA | 64/107 | 19.7 | 0.066 | 1.45(1.39-2.23) | 0.034 | 49/107 | 30.6 | 0.049 | 1.74(1.05-2.92) | 0.034 | |||||||||||||||||||||||||||||||||||||||||||||||||||||||||||||||||||||||||||||||||||||||||
| GA+AA | 230/315 | 21.2 | 0.029 | 1.48(1.02-2.17) | 0.041 | 149/315 | 35.9 | 0.021 | 1.57(1.21-2.48) | 0.033 | |||||||||||||||||||||||||||||||||||||||||||||||||||||||||||||||||||||||||||||||||||||||||
| CRT | GG | 27/83 | - | 1.00 | 21/83 | - | 1.00 | ||||||||||||||||||||||||||||||||||||||||||||||||||||||||||||||||||||||||||||||||||||||||||||
| GA | 80/173 | 29.6 | 0.100 | 1.31(0.80-2.16) | 0.288 | 66/173 | 52.6 | 0.316 | 1.31(0.79-2.16) | 0.288 | |||||||||||||||||||||||||||||||||||||||||||||||||||||||||||||||||||||||||||||||||||||||||
| AA | 42/84 | 26.7 | 0.036 | 1.51(1.27-2.62) | 0.042 | 35/84 | 33.1 | 0.003 | 1.51(1.37-2.62) | 0.014 | |||||||||||||||||||||||||||||||||||||||||||||||||||||||||||||||||||||||||||||||||||||||||
| GA+AA | 122/257 | 29.6 | 0.025 | 1.37(1.30-2.22) | 0.017 | 101/257 | 43.5 | 0.019 | 1.37(1.25-2.22) | 0.017 | |||||||||||||||||||||||||||||||||||||||||||||||||||||||||||||||||||||||||||||||||||||||||
| Does | ≥65Gy | GG | 32/76 | 32.9 | 1.00 | 23/76 | - | 1.00 | |||||||||||||||||||||||||||||||||||||||||||||||||||||||||||||||||||||||||||||||||||||||||||
| GA | 141/227 | 23.1 | 0.178 | 1.20(0.77-1.89) | 0.423 | 101/227 | 40.4 | 0.695 | 1.19(0.71-2.01) | 0.511 | |||||||||||||||||||||||||||||||||||||||||||||||||||||||||||||||||||||||||||||||||||||||||
| AA | 70/116 | 17.0 | 0.015 | 1.08(1.04-1.81) | 0.025 | 52/116 | 29.2 | 0.016 | 1.21(1.07-2.17) | 0.023 | |||||||||||||||||||||||||||||||||||||||||||||||||||||||||||||||||||||||||||||||||||||||||
| GA+AA | 211/343 | 22.5 | 0.023 | 1.16(1.05-1.80) | 0.038 | 153/343 | 35.6 | 0.028 | 1.19(1.02-1.98) | 0.036 | |||||||||||||||||||||||||||||||||||||||||||||||||||||||||||||||||||||||||||||||||||||||||
| <65Gy | GG | 26/72 | - | 1.00 | 20/72 | - | 1.00 | ||||||||||||||||||||||||||||||||||||||||||||||||||||||||||||||||||||||||||||||||||||||||||||
| GA | 78/154 | 27.1 | 0.009 | 1.62(1.09-2.42) | 0.018 | 65/154 | 52.6 | 0.075 | 1.35(0.85-2.15) | 0.203 | |||||||||||||||||||||||||||||||||||||||||||||||||||||||||||||||||||||||||||||||||||||||||
| AA | 36/75 | 39.0 | 0.003 | 1.69(1.09-2.61) | 0.018 | 32/75 | 26.9 | 0.006 | 1.69(1.02-2.79) | 0.042 | |||||||||||||||||||||||||||||||||||||||||||||||||||||||||||||||||||||||||||||||||||||||||
| GA+AA | 114/229 | 29.4 | 0.003 | 1.64(1.11-2.42) | 0.012 | 97/229 | 33.7 | 0.024 | 1.45(1.39-2.28) | 0.015 | |||||||||||||||||||||||||||||||||||||||||||||||||||||||||||||||||||||||||||||||||||||||||
| Pa, Log-rank P; Pb, multivariate cox regression; MST, median survival time; RT, radiation therapy; CRT, chemoradiation therapy. | |||||||||||||||||||||||||||||||||||||||||||||||||||||||||||||||||||||||||||||||||||||||||||||||||||
Table 5. Subgroup multivariate analysis of clinical parameters for 189037 and survival outcomes.
| Parameters | Subgroup | Genotype | Disease-free survival | Overall survival | |||||||||||||||||||||||||||||||||||||||||||||||||||||||||||||||||||||||||||||||||||||||||||||||
| Event/No. | MST (month) | Pa | HR*(95%CI) | Pb | Event/No. | MST (month) | Pa | HR*(95%CI) | Pb | ||||||||||||||||||||||||||||||||||||||||||||||||||||||||||||||||||||||||||||||||||||||||||
| rs189037 | |||||||||||||||||||||||||||||||||||||||||||||||||||||||||||||||||||||||||||||||||||||||||||||||||||
| Smoking | Yes | AA | 24/71 | - | 1.00 | 24/71 | 43.5 | ||||||||||||||||||||||||||||||||||||||||||||||||||||||||||||||||||||||||||||||||||||||||||||
| AG | 121/214 | 24.5 | 0.014 | 1.61(0.97-2.66) | 0.063 | 122/214 | 34.6 | 0.055 | 1.31(0.78-2.19) | 0.309 | |||||||||||||||||||||||||||||||||||||||||||||||||||||||||||||||||||||||||||||||||||||||||
| GG | 43/85 | 24.1 | 0.039 | 1.67(1.06-2.60) | 0.023 | 37/85 | 31.8 | 0.166 | 1.90(1.22-2.95) | 0.004 | |||||||||||||||||||||||||||||||||||||||||||||||||||||||||||||||||||||||||||||||||||||||||
| AG+GG | 164/299 | 24.5 | 0.012 | 1.65(1.08-2.55) | 0.022 | 159/299 | 32.1 | 0.010 | 1.71(1.11-2.63) | 0.015 | |||||||||||||||||||||||||||||||||||||||||||||||||||||||||||||||||||||||||||||||||||||||||
| No | AA | 26/94 | 59.3 | 1.00 | 21/94 | - | |||||||||||||||||||||||||||||||||||||||||||||||||||||||||||||||||||||||||||||||||||||||||||||
| AG | 70/169 | 40.4 | 0.184 | 1.40(1.09-2.0) | 0.046 | 70/169 | 36.9 | 0.095 | 1.08(0.58-2.03) | 0.800 | |||||||||||||||||||||||||||||||||||||||||||||||||||||||||||||||||||||||||||||||||||||||||
| GG | 25/87 | 61.4 | 0.017 | 1.05(1.01-1.83) | 0.035 | 19/87 | - | 0.027 | 1.78(1.09-2.90) | 0.021 | |||||||||||||||||||||||||||||||||||||||||||||||||||||||||||||||||||||||||||||||||||||||||
| AG+GG | 95/256 | 44.5 | 0.015 | 1.29(1.13-2.00) | 0.025 | 89/256 | 42.9 | 0.025 | 1.57(1.09-2.53) | 0.045 | |||||||||||||||||||||||||||||||||||||||||||||||||||||||||||||||||||||||||||||||||||||||||
| Histology | SCC | AA | 28/45 | 22.7 | 1.00 | 14/45 | 73.5 | 1.00 | |||||||||||||||||||||||||||||||||||||||||||||||||||||||||||||||||||||||||||||||||||||||||||
| AG | 49/80 | 23.5 | 0.836 | 0.62(0.33-1.16) | 0.136 | 35/80 | 32.1 | 0.353 | 0.62(0.26-1.47) | 0.276 | |||||||||||||||||||||||||||||||||||||||||||||||||||||||||||||||||||||||||||||||||||||||||
| GG | 15/33 | - | 0.153 | 0.95(0.60-1.51) | 0.832 | 8/33 | - | 0.383 | 1.34(0.72-2.49) | 0.354 | |||||||||||||||||||||||||||||||||||||||||||||||||||||||||||||||||||||||||||||||||||||||||
| AG+GG | 64/113 | 22.7 | 0.110 | 1.56(0.90-2.72) | 0.115 | 43/113 | 38.1 | 0.067 | 1.98(0.64-4.190 | 0.073 | |||||||||||||||||||||||||||||||||||||||||||||||||||||||||||||||||||||||||||||||||||||||||
| ADC | AA | 51/90 | 22.5 | 1.00 | 33/90 | 64.3 | 1.00 | ||||||||||||||||||||||||||||||||||||||||||||||||||||||||||||||||||||||||||||||||||||||||||||
| AG | 107/178 | 20.7 | 0.034 | 1.73(1.17-2.56) | 0.006 | 102/178 | 31.5 | 0.089 | 0.65(0.38-1.11) | 0.653 | |||||||||||||||||||||||||||||||||||||||||||||||||||||||||||||||||||||||||||||||||||||||||
| GG | 33/90 | 43.1 | 0.007 | 1.80(1.16-2.78) | 0.009 | 23/90 | 58.4 | 0.000 | 1.46(0.99-2.170 | 0.057 | |||||||||||||||||||||||||||||||||||||||||||||||||||||||||||||||||||||||||||||||||||||||||
| AG+GG | 140/268 | 21.5 | 0.003 | 1.75(1.20-2.55) | 0.003 | 125/268 | 34.6 | 0.002 | 2.01(1.29-3.13) | 0.002 | |||||||||||||||||||||||||||||||||||||||||||||||||||||||||||||||||||||||||||||||||||||||||
| Other | AA | 15/37 | 33.3 | 1.00 | 9/37 | - | 1.00 | ||||||||||||||||||||||||||||||||||||||||||||||||||||||||||||||||||||||||||||||||||||||||||||
| AG | 65/125 | 28.9 | 0.271 | 0.92(0.55-1.51) | 0.729 | 55/125 | 36.9 | 0.318 | 1.41(0.61-3.25) | 0.426 | |||||||||||||||||||||||||||||||||||||||||||||||||||||||||||||||||||||||||||||||||||||||||
| GG | 20/42 | 24.7 | 0.154 | 0.64(0.33-1.25) | 0.194 | 14/42 | - | 0.995 | 1.80(0.89-3.65) | 0.101 | |||||||||||||||||||||||||||||||||||||||||||||||||||||||||||||||||||||||||||||||||||||||||
| AG+GG | 85/167 | 30.8 | 0.505 | 0.85(0.52-1.38) | 0.508 | 69/167 | 37.8 | 0.629 | 1.15(0.65-2.06) | 0.631 | |||||||||||||||||||||||||||||||||||||||||||||||||||||||||||||||||||||||||||||||||||||||||
| Stage | IIIA | AA | 25/90 | 58.6 | 22/90 | - | |||||||||||||||||||||||||||||||||||||||||||||||||||||||||||||||||||||||||||||||||||||||||||||
| AG | 77/162 | 60.2 | 0.051 | 1.09(0.62-1.91) | 0.760 | 77/162 | 46.0 | 0.085 | 1.07(0.58-1.97) | 0.832 | |||||||||||||||||||||||||||||||||||||||||||||||||||||||||||||||||||||||||||||||||||||||||
| GG | 25/81 | 33.9 | 0.037 | 1.59(1.01-2.50) | 0.044 | 20/81 | - | 0.012 | 1.85(1.15-2.97) | 0.011 | |||||||||||||||||||||||||||||||||||||||||||||||||||||||||||||||||||||||||||||||||||||||||
| AG+GG | 102/243 | 39.0 | 0.012 | 1.43(1.31-2.22) | 0.037 | 97/243 | 42.7 | 0.045 | 1.62(1.02-2.57) | 0.042 | |||||||||||||||||||||||||||||||||||||||||||||||||||||||||||||||||||||||||||||||||||||||||
| IIIB | AA | 25/75 | 43.7 | 1.00 | 23/75 | 44.3 | 1.00 | ||||||||||||||||||||||||||||||||||||||||||||||||||||||||||||||||||||||||||||||||||||||||||||
| AG | 114/221 | 30.1 | 0.032 | 1.59(1.02-2.48) | 0.042 | 115/221 | 40.2 | 0.250 | 1.35(0.80-2.28) | 0.267 | |||||||||||||||||||||||||||||||||||||||||||||||||||||||||||||||||||||||||||||||||||||||||
| GG | 43/91 | 27.1 | 0.037 | 1.45(1.28-2.39) | 0.031 | 36/91 | 33.2 | 0.009 | 1.86(1.18-2.94) | 0.008 | |||||||||||||||||||||||||||||||||||||||||||||||||||||||||||||||||||||||||||||||||||||||||
| AG+GG | 157/312 | 27.1 | 0.028 | 1.55(1.05-2.38) | 0.029 | 151/312 | 33.7 | 0.019 | 1.69(1.09-2.65) | 0.020 | |||||||||||||||||||||||||||||||||||||||||||||||||||||||||||||||||||||||||||||||||||||||||
| Treatment | RT | AA | 23/71 | - | 1.00 | 22/71 | 48.4 | 1.00 | |||||||||||||||||||||||||||||||||||||||||||||||||||||||||||||||||||||||||||||||||||||||||||
| AG | 110/218 | 28.1 | 0.027 | 1.54(0.98-2.43) | 0.059 | 111/218 | 41.7 | 0.167 | 1.39(0.82-2.36) | 0.221 | |||||||||||||||||||||||||||||||||||||||||||||||||||||||||||||||||||||||||||||||||||||||||
| GG | 44/91 | 30.1 | 0.019 | 1.49(1.19-2.48) | 0.021 | 38/91 | 34.9 | 0.026 | 1.78(1.12-2.82) | 0.015 | |||||||||||||||||||||||||||||||||||||||||||||||||||||||||||||||||||||||||||||||||||||||||
| AG+GG | 154/309 | 29.0 | 0.035 | 1.53(1.08-2.38) | 0.049 | 149/309 | 34.9 | 0.036 | 1.65(1.06-2.59) | 0.028 | |||||||||||||||||||||||||||||||||||||||||||||||||||||||||||||||||||||||||||||||||||||||||
| CRT | AA | 27/94 | 61.4 | 1.00 | 23/94 | - | 1.00 | ||||||||||||||||||||||||||||||||||||||||||||||||||||||||||||||||||||||||||||||||||||||||||||
| AG | 81/165 | 33.6 | 0.916 | 1.09(0.62-1.89) | 0.772 | 81/165 | 35.1 | 0.869 | 0.99(0.53-1.85) | 0.987 | |||||||||||||||||||||||||||||||||||||||||||||||||||||||||||||||||||||||||||||||||||||||||
| GG | 24/81 | - | 0.029 | 1.58(1.02-2.46) | 0.040 | 18/81 | - | 0.003 | 1.87(1.17-2.97) | 0.009 | |||||||||||||||||||||||||||||||||||||||||||||||||||||||||||||||||||||||||||||||||||||||||
| AG+GG | 105/246 | 34.5 | 0.039 | 1.43(1.02-2.20) | 0.042 | 99/246 | 36.9 | 0.029 | 1.61(1.02-2.54) | 0.041 | |||||||||||||||||||||||||||||||||||||||||||||||||||||||||||||||||||||||||||||||||||||||||
| Does | ≥65Gy | AA | 24/85 | - | 1.00 | 23/85 | 48.4 | 1.00 | |||||||||||||||||||||||||||||||||||||||||||||||||||||||||||||||||||||||||||||||||||||||||||
| AG | 113/232 | 29.0 | 0.069 | 1.17(0.80-1.73) | 0.420 | 114/232 | 41.7 | 0.799 | 1.23(0.82-1.86) | 0.311 | |||||||||||||||||||||||||||||||||||||||||||||||||||||||||||||||||||||||||||||||||||||||||
| GG | 46/102 | 30.1 | 0.014 | 1.31(1.23-1.32) | 0.017 | 39/102 | 24.4 | 0.010 | 1.17(1.07-1.32) | 0.020 | |||||||||||||||||||||||||||||||||||||||||||||||||||||||||||||||||||||||||||||||||||||||||
| AG+GG | 159/334 | 29.2 | 0.013 | 1.25(1.18-1.93) | 0.021 | 153/334 | 34.9 | 0.006 | 1.47(1.29-2.36) | 0.013 | |||||||||||||||||||||||||||||||||||||||||||||||||||||||||||||||||||||||||||||||||||||||||
| <65Gy | AA | 26/80 | 59.3 | 1.00 | 22/80 | - | 1.00 | ||||||||||||||||||||||||||||||||||||||||||||||||||||||||||||||||||||||||||||||||||||||||||||
| AG | 78/151 | 61.4 | 0.016 | 1.68(1.02-2.76) | 0.041 | 78/151 | 35.5 | 0.133 | 1.54(0.91-2.58) | 0.104 | |||||||||||||||||||||||||||||||||||||||||||||||||||||||||||||||||||||||||||||||||||||||||
| GG | 22/70 | 33.6 | 0.039 | 1.70(1.09-2.66) | 0..019 | 17/70 | - | 0.007 | 1.98(1.26-3.11) | 0.003 | |||||||||||||||||||||||||||||||||||||||||||||||||||||||||||||||||||||||||||||||||||||||||
| AG+GG | 100/221 | 38.7 | 0.014 | 1.70(1.10-2.61) | 0.017 | 95/221 | 36.9 | 0.013 | 1.84(1.18-2.86) | 0.007 | |||||||||||||||||||||||||||||||||||||||||||||||||||||||||||||||||||||||||||||||||||||||||
| Pa, Log-rank P; Pb, multivariate cox regression; MST, median survival time; RT, radiation therapy; CRT, chemoradiation therapy. | |||||||||||||||||||||||||||||||||||||||||||||||||||||||||||||||||||||||||||||||||||||||||||||||||||
Discussion
In this study, we assessed the association between four ATM SNPs and the survival outcomes in NSCLC patients of Han Chinese origin who received radiation therapy alone or chemo-radiation therapy. We demonstrated that two SNPs, rs664143 and rs189037, were significantly associated with DFS and OS rates in NSCLC patients treated with radiation or chemoradiation therapy. The association was significant with a prior false-positive rate of 0.1. NSCLC patients with rs664143 G or rs189037A alleles were at increased risk of disease progression compared with the other SNP genotypes. These results were further confirmed by the subgroup analysis. These findings suggest that these two ATM variants are associated with the prognosis of NSCLC patients and determine the efficacy of radiation therapy.
Radiation therapy induces DNA damage and tumor cell death. Inactivating ATM gene mutations contribute to genomic instability by reducing the efficiency of DNA double-strand break repair in response to radiation. ATM protein also detects DNA damage or other abnormal DNA structures in response to radiations and initiates DNA damage repair response that may include cell cycle arrest or apoptosis [21]. ATM activates checkpoint kinase, which induces phosphorylation of CDC25 at Ser216 and inhibits the cell cycle progression by suppressing the activity of CDC25 and M-Cdk. ATM also regulates the activity of p53, a critical tumor suppressor protein in multiple ways. It mediates p53 phosphorylation through Chk2 kinase activation. Moreover, ATM phosphorylates Mdm2 proto-oncogene and prevents its binding to p53. Furthermore, activation of p53 induces the expression of p21, which blocks the cell cycle in the G1-S phase by inhibiting CDK activity [22, 23]. Therefore, inactivating mutations in the ATM gene can disrupt these critical cellular mechanisms. ATM inhibition enhances the sensitivity of cancer cells to radiation therapy [24, 25], whereas, phosphorylated ATM protein increases the radiation resistance of cancer cells and correlates with poor prognosis of cancer patients [26]. Considering the importance of ATM kinase in DNA damage repair, our data suggests that activating or inactivating ATM gene polymorphisms influence the efficacy of radiation therapy and the prognosis of NSCLC patients.
Previous studies have shown that ATM gene polymorphisms are associated with poor prognosis of patients with pancreatic cancer, acute myeloid leukemia, and colorectal cancer [27, 28, 29]. Su et al. performed a case-control study of 230 NSCLC patients and showed that ATM rs664143 was not associated with the treatment response of patients with advanced NSCLC [30]. However, they did not evaluate its relationship with the prognosis of NSCLC patients. Du et al. showed that ATM rs664143 A and rs664677 C alleles were associated with poor prognosis of 412 esophageal squamous cell carcinoma (ESCC) patients that received radiation or chemoradiation therapy [31]. In the present study, we demonstrate that NSCLC patients with the rs664143 A allele is associated with unfavorable prognosis after receiving radiation or chemoradiation therapy. One probable mechanism explaining these outcomes is inaccurate splicing when rs664143 is combined with an intronic splicing enhancer or repressor [32]. However, further investigation is required to ascertain the molecular mechanisms involved in the process. We also demonstrate that ATM rs189037 is associated with poor prognosis of NSCLC patients treated with radiation or chemoradiation therapy. This SNP is located in the promoter region of the ATM gene. A previous study showed that ATM rs189037 is associated with radiation- induced pneumonia in lung cancer patients [33], but, its role in survival outcomes of NSCLC patients has not been reported. In a previous study of breast cancer patients, those with ATM rs664677 TC genotype showed increased radiation resistance compared to the rs664677 TT genotype [34]. Furthermore, pancreatic cancer patients with the rs664677 TC genotype showed worse prognosis than those with the rs664677 TT genotype [28]. In advanced ESCC patients receiving radiation therapy, two ATM SNPs, rs664143, and rs664677, were associated with survival times [31]. In contrast, our study showed no correlation between rs664677 and prognosis of NSCLC patients that received radiation or chemoradiation therapy. The reasons for these contrasting findings are not clear and further studies are necessary to determine the differential function or role of rs664677 in different types of cancers.
One plausible explanation for our findings is that the two ATM SNPs (or haplotypes) modulate the function of the ATM protein. This determines the response of NSCLC cells to radiation and chemo-radiation therapy, which affects their survival and contributes to differential prognosis of patients with different ATM SNPs. ATM protein is a key regulator of cell cycle. Cell cycle is blocked under conditions of DNA damage, incomplete replication, or abnormal spindle formation. When normal cells are irradiated, DNA repair mechanisms are activated so that the DNA damage is rectified. Cell cycle inhibition of irradiated cells prevents the proliferation of malignant cells that contain genetic mutations. However, tumor cells are defective in cell cycle checkpoints and DNA repair mechanisms. This results in uncontrolled proliferation and differentiation of tumor cells with genetic mutations [35]. Mutations in the ATM gene alter the structure and function of the ATM protein in ataxia telangiectasia (A-T) patients. Therefore, A-T patient cells show aberrant cell cycle checkpoints and DNA damage repair, increased sensitivity to apoptosis, chromosomal instability, and radiation sensitivity. Moreover, the incidence of cancers is significantly higher in patients with heterozygous or homozygous ATM mutations compared to individuals with the wild-type ATM gene [36]. The rs189037 is located at the 5'UTR of ATM gene (NC_000011.10: g. 108354934), and rs664143 is located at the intron of ATM gene (NC_000011.10: g.108354934). Two SNPs are very close loci (131bp) existing in two intros. We used the web-based tool (Improbizer, https://users.soe.ucsc.edu/~kent/improbizer/improbizer.html) to check the splicing effect of two sites, and the results suggested that two sited exist in protein-binding motifs have a potential as binding sites of intronic splicing enhancer, indicating a possibility that both sites may be related to splicing process to lead to inaccurate splicing. However, this hypothesis should be confirmed through further research.
Our study has several limitations. Firstly, our study includes NSCLC patients treated with radiation or chemoradiation, but does not investigate NSCLC patients that underwent surgery. Secondly, we adjusted the survival outcomes for a few common clinical parameters, but, more factors should be considered. Thirdly, we did not identify the mechanisms underlying the findings of our study. Finally, we did not perform haplotype analysis because only two significant SNPs were found.
In conclusion, our study demonstrates that ATM gene polymorphisms are significantly associated with disease progression and survival outcomes in NSCLC patients that have received radiation or chemoradiation therapy. These two ATM SNPs are potential prognostic biomarkers to predict survival outcomes of NSCLC patients that receive radiation or chemoradiation therapy.
Materials and Methods
Study population
This two-center follow-up study was conducted at Yantai Yuhuangding Hospital, the Affiliated Hospital of Qingdao University and Tangshan People’s Hospital from January 2009 to December 2017. The inclusion criteria were: (1) newly diagnosed Han Chinese NSCLC patients that were confirmed by biopsy with TNM stage IIIA–IIIB NCSLC tumors; (2) availability of follow-up clinical data, and (3) patients underwent radiotherapy or chemoradiotherapy. Patients that (1) underwent surgery or stereotactic ablative radiation therapy, and (2) with an history of lung cancer and recurrent disease, severe cardiovascular diseases, cerebral apoplexy, or depression were excluded from the study. Tumors were classified based on histology according to the World Health Organization system for NSCLC. The tumor staging was according to the revised American Joint Committee on Cancer/Union for International Cancer Control (AJCC/UICC 7th Edition). This study was approved by the Ethics Committee of Yantai Yuhuangding Hospital, the Affiliated Hospital of Qingdao University, and conducted in accordance with the World Medical Association Declaration of Helsinki. We obtained written informed consent from all study subjects.
Radiation therapy
All patients underwent computed tomography (CT) scans of 5 mm slice thickness in a supine position with hands crossed before placing the forehead and thermoplastic body model fixation. The scans were performed from the mastoid process to the bottom of the lung and the images were transmitted over the network to a three-dimensional (3-D) treatment planning system. The target area delineation was according to ICRU50 and ICRU62 report guidelines. The gross tumor volume (GTV) was defined as the tumor volume seen below the lung window. The GTV node (GTVnd) was defined as a metastatic lymph node seen below the mediastinal window. The characteristics of the GTVnd were: short diameter > LCM; multiple fusions; necrosis or envelope invasion; and confirmed by positron emission tomography (PET) or mediastinoscopy. For concurrent chemoradiotherapy or radiotherapy alone, the double-lung V20 was limited to < 28% and < 30%, respectively, and adjusted according to the patient’s physical condition, age, complications, and basic lung-function parameters. The other tissue limits included a maximum dose of the spinal cord of < 45 Gy, a cardiac V40 of < 30%, and an esophageal V50 of < 40–50%. A physician confirmed the treatment plan developed by the radiologist. The plan was further verified by calibration on the CT simulation positioning machine. Finally, the treatment was performed using a Vanaii linear accelerator.
Clinical data and follow-up
We obtained clinical data from the medical records of the patients for parameters such as age at treatment, gender, smoking, histologic type, TNM stage, treatment method, radiation technique, and radiation dose. The survival data was collected by follow-up through the telephone or from the outpatient medical records. The patients underwent physical examinations, CT or PET/CT, laboratory tests, and lung function evaluations at 6 weeks after therapy. The follow-up interval was every 3 months for 2 years, and 6 months thereafter. The primary follow-up outcome was overall survival (OS). OS was defined as the time period from the start of treatment to the last follow-up or death. We also evaluated disease-free survival (DFS), which was defined as the time period from the start of treatment until the date of the first local recurrence or metastasis at the last follow-up. Patients without progression were censored at the last follow-up date.
Selection and genotyping of ATM SNPs
We first searched for the ATM gene SNPs in the dbSNP database (https://www.ncbi.nlm.nih.gov/snp/) using a minor allele frequency of > 5%. Next, we selected tagSNPs with r2 > 0.8 among the Han Chinese population using the International HapMap project database and identified four SNPs (rs664143, rs664677, rs189037, and rs373759) with moderate linkage disequilibrium by analyzing the 1000GENOMES project database.
We obtained 5 mL of fasting venous blood in ethylenediaminetetraacetic acid (EDTA)-coated tubes and isolated the genomic DNA from peripheral blood leukocytes using the Biospin Whole Blood Genomic DNA Extraction Kit (Bioer Technology Co., Ltd., China) according to the manufacturer’s instructions. The samples were stored at −20°C.
The SNP sequences were PCR amplified using primer sequences that were designed using Primer Premier 5.0, and synthesized by Sangon Biotech (Shanghai, China) as shown in Supplementary Table 1. The PCR protocol was: initial denaturation cycle at 95°C for 7 min; 35 cycles of denaturation at 95°C for 1 min, annealing at 56°C for 1 min, and extension at 72°C for 1 min; final extension cycle at 72°C for 10 min. The PCR products were separated by 2% agarose gel electrophoresis, purified by ExoSAP-IT (USB Corp., Cleveland, OH, USA), sequenced in an Applied Biosystems 3730xl automated sequencer (Applied Biosystems, Foster City, CA, USA), and analyzed using the Vector NTI software.
Statistical analysis
The continuous variables were converted into categorical variables based on the mean age or median dose. The median OS and DFS were determined by Kaplan-Meir survival curve analyses using the log-rank test. The relationship between clinical parameters, ATM SNPs and survival parameters, OS and DFS, was determined using univariate and multivariate cox proportional hazards regression models. The multivariate Cox proportional regression model was adjusted for age, gender, smoking, histology, stage, treatment, radiation technique, and dose and the corresponding hazard ratios (HRs) and 95% confidence intervals (CIs) were estimated. Subgroup analyses were performed for significant variables such as smoking, tumor stage, treatment, and radiation dose. The false-positive probability analysis was conducted by assuming that the HR for a risk allele was 1.5 and the HR for a protective allele was 1/1.5 times below the prior probability of 0.01 for each SNP. A significant association was defined as a false-positive value of < 0.20. Statistical significance was defined as a two-sided P-value < 0.05. Statistical analysis was performed using the SPSS 23.0 software.
Acknowledgments
ZW designed this study and the search strategy; WY and CW performed the analysis and interpreted the data; WY wrote the manuscript; WZW critically reviewed the manuscript; HT performed data extraction and manuscript revision; MJJ proof read the final version of the manuscript. All the authors read and approved the final manuscript.
Conflicts of Interest
These authors declare no conflicts of interest.
References
- 1. Bray F, Ferlay J, Soerjomataram I, Siegel RL, Torre LA, Jemal A. Global cancer statistics 2018: GLOBOCAN estimates of incidence and mortality worldwide for 36 cancers in 185 countries. CA Cancer J Clin. 2018; 68:394–424. https://doi.org/10.3322/caac.21492 [PubMed]
- 2. Siegel RL, Miller KD, Jemal A. Cancer statistics, 2019. CA Cancer J Clin. 2019; 69:7–34. https://doi.org/10.3322/caac.21551 [PubMed]
- 3. Feng RM, Zong YN, Cao SM, Xu RH. Current cancer situation in China: good or bad news from the 2018 Global Cancer Statistics? Cancer Commun (Lond). 2019; 39:22. https://doi.org/10.1186/s40880-019-0368-6 [PubMed]
- 4. Chen W, Zheng R, Baade PD, Zhang S, Zeng H, Bray F, Jemal A, Yu XQ, He J. Cancer statistics in China, 2015. CA Cancer J Clin. 2016; 66:115–32. https://doi.org/10.3322/caac.21338 [PubMed]
- 5. Liao Z, Lin SH, Cox JD. Status of particle therapy for lung cancer. Acta Oncol. 2011; 50:745–56. https://doi.org/10.3109/0284186X.2011.590148 [PubMed]
- 6. Zhou R, Xu T, Nguyen QN, Liu Y, Yang J, Komaki R, Gomez DR, Liao Z. Radiation Dose, Local Disease Progression, and Overall Survival in Patients With Inoperable Non-Small Cell Lung Cancer After Concurrent Chemoradiation Therapy. Int J Radiat Oncol Biol Phys. 2018; 100:452–61. https://doi.org/10.1016/j.ijrobp.2017.10.003 [PubMed]
- 7. Ettinger DS. Ten years of progress in non-small cell lung cancer. J Natl Compr Canc Netw. 2012; 10:292–95. https://doi.org/10.6004/jnccn.2012.0029 [PubMed]
- 8. Deng HY, Peng L. Surgery or Stereotactic Body Radiotherapy for Early-stage Lung Cancer: What Is the Current Evidence? Clin Lung Cancer. 2020; 21:e33–e34. https://doi.org/10.1016/j.cllc.2019.10.011 [PubMed]
- 9. Louie AV, Bahig H, Moghanaki D. The current and future landscape of radiotherapy for lung cancer. Transl Lung Cancer Res. 2019 (Suppl 2); 8:S122–23. https://doi.org/10.21037/tlcr.2019.09.07 [PubMed]
- 10. Van Meerbeeck JP, De Pooter C, Raskin J, Janssens A, Van Schil PE. Local treatment of stage IIIA-N2 nonsmall cell lung cancer: surgery and/or radiotherapy. Curr Opin Oncol. 2020; 32:54–62. https://doi.org/10.1097/CCO.0000000000000596 [PubMed]
- 11. Fan Y, Du Y, Sun W, Wang H. Including positive lymph node count in the AJCC N staging may be a better predictor of the prognosis of NSCLC patients, especially stage III patients: a large population-based study. Int J Clin Oncol. 2019; 24:1359–66. https://doi.org/10.1007/s10147-019-01483-1 [PubMed]
- 12. Cedrés S, Nuñez I, Longo M, Martinez P, Checa E, Torrejón D, Felip E. Serum tumor markers CEA, CYFRA21-1, and CA-125 are associated with worse prognosis in advanced non-small-cell lung cancer (NSCLC). Clin Lung Cancer. 2011; 12:172–79. https://doi.org/10.1016/j.cllc.2011.03.019 [PubMed]
- 13. Luo J, Chen YJ, Chang LJ. Fasting blood glucose level and prognosis in non-small cell lung cancer (NSCLC) patients. Lung Cancer. 2012; 76:242–47. https://doi.org/10.1016/j.lungcan.2011.10.019 [PubMed]
- 14. Wu F, Hu N, Li Y, Bian B, Xu G, Zheng Y. Galectin-3 genetic variants are associated with platinum-based chemotherapy response and prognosis in patients with NSCLC. Cell Oncol (Dordr). 2012; 35:175–80. https://doi.org/10.1007/s13402-012-0075-7 [PubMed]
- 15. Motta G, Carbone E, Spinelli E, Nahum MA, Testa T, Flocchini GP. Considerations about tumor size as a factor of prognosis in NSCLC. Ann Ital Chir. 1999; 70:893–97. [PubMed]
- 16. Xu Y, Gao P, Lv X, Zhang L, Zhang J. The role of the ataxia telangiectasia mutated gene in lung cancer: recent advances in research. Ther Adv Respir Dis. 2017; 11:375–80. https://doi.org/10.1177/1753465817725716 [PubMed]
- 17. Kruhlak M, Crouch EE, Orlov M, Montaño C, Gorski SA, Nussenzweig A, Misteli T, Phair RD, Casellas R. The ATM repair pathway inhibits RNA polymerase I transcription in response to chromosome breaks. Nature. 2007; 447:730–34. https://doi.org/10.1038/nature05842 [PubMed]
- 18. Yang H, Spitz MR, Stewart DJ, Lu C, Gorlov IP, Wu X. ATM sequence variants associate with susceptibility to non-small cell lung cancer. Int J Cancer. 2007; 121:2254–59. https://doi.org/10.1002/ijc.22918 [PubMed]
- 19. Lo YL, Hsiao CF, Jou YS, Chang GC, Tsai YH, Su WC, Chen YM, Huang MS, Chen HL, Yang PC, Chen CJ, Hsiung CA. ATM polymorphisms and risk of lung cancer among never smokers. Lung Cancer. 2010; 69:148–54. https://doi.org/10.1016/j.lungcan.2009.11.007 [PubMed]
- 20. Bhowmik A, Nath S, Das S, Ghosh SK, Choudhury Y. ATM rs189037 (G > A) polymorphism and risk of lung cancer and head and neck cancer: A meta-analysis. Meta Gene. 2015; 6:42–48. https://doi.org/10.1016/j.mgene.2015.08.002 [PubMed]
- 21. Shiloh Y. ATM and related protein kinases: safeguarding genome integrity. Nat Rev Cancer. 2003; 3:155–68. https://doi.org/10.1038/nrc1011 [PubMed]
- 22. Maya R, Balass M, Kim ST, Shkedy D, Leal JF, Shifman O, Moas M, Buschmann T, Ronai Z, Shiloh Y, Kastan MB, Katzir E, Oren M. ATM-dependent phosphorylation of Mdm2 on serine 395: role in p53 activation by DNA damage. Genes Dev. 2001; 15:1067–77. https://doi.org/10.1101/gad.886901 [PubMed]
- 23. Sancar A, Lindsey-Boltz LA, Unsal-Kaçmaz K, Linn S. Molecular mechanisms of mammalian DNA repair and the DNA damage checkpoints. Annu Rev Biochem. 2004; 73:39–85. https://doi.org/10.1146/annurev.biochem.73.011303.073723 [PubMed]
- 24. Fuhrman CB, Kilgore J, LaCoursiere YD, Lee CM, Milash BA, Soisson AP, Zempolich KA. Radiosensitization of cervical cancer cells via double-strand DNA break repair inhibition. Gynecol Oncol. 2008; 110:93–98. https://doi.org/10.1016/j.ygyno.2007.08.073 [PubMed]
- 25. Rainey MD, Charlton ME, Stanton RV, Kastan MB. Transient inhibition of ATM kinase is sufficient to enhance cellular sensitivity to ionizing radiation. Cancer Res. 2008; 68:7466–74. https://doi.org/10.1158/0008-5472.CAN-08-0763 [PubMed]
- 26. Roossink F, Wieringa HW, Noordhuis MG, ten Hoor KA, Kok M, Slagter-Menkema L, Hollema H, de Bock GH, Pras E, de Vries EG, de Jong S, van der Zee AG, Schuuring E, et al. The role of ATM and 53BP1 as predictive markers in cervical cancer. Int J Cancer. 2012; 131:2056–66. https://doi.org/10.1002/ijc.27488 [PubMed]
- 27. Shi JY, Ren ZH, Jiao B, Xiao R, Yun HY, Chen B, Zhao WL, Zhu Q, Chen Z, Chen SJ. Genetic variations of DNA repair genes and their prognostic significance in patients with acute myeloid leukemia. Int J Cancer. 2011; 128:233–38. https://doi.org/10.1002/ijc.25318 [PubMed]
- 28. Li D, Frazier M, Evans DB, Hess KR, Crane CH, Jiao L, Abbruzzese JL. Single nucleotide polymorphisms of RecQ1, RAD54L, and ATM genes are associated with reduced survival of pancreatic cancer. J Clin Oncol. 2006; 24:1720–28. https://doi.org/10.1200/JCO.2005.04.4206 [PubMed]
- 29. Kweekel DM, Antonini NF, Nortier JW, Punt CJ, Gelderblom H, Guchelaar HJ. Explorative study to identify novel candidate genes related to oxaliplatin efficacy and toxicity using a DNA repair array. Br J Cancer. 2009; 101:357–62. https://doi.org/10.1038/sj.bjc.6605134 [PubMed]
- 30. Su D, Ma S, Liu P, Jiang Z, Lv W, Zhang Y, Deng Q, Smith S, Yu H. Genetic polymorphisms and treatment response in advanced non-small cell lung cancer. Lung Cancer. 2007; 56:281–88. https://doi.org/10.1016/j.lungcan.2006.12.002 [PubMed]
- 31. Du Z, Zhang W, Zhou Y, Yu D, Chen X, Chang J, Qiao Y, Zhang M, Huang Y, Wu C, Xiao Z, Tan W, Lin D. Associations of ATM Polymorphisms With Survival in Advanced Esophageal Squamous Cell Carcinoma Patients Receiving Radiation Therapy. Int J Radiat Oncol Biol Phys. 2015; 93:181–89. https://doi.org/10.1016/j.ijrobp.2015.05.002 [PubMed]
- 32. Kim JH, Kim H, Lee KY, Choe KH, Ryu JS, Yoon HI, Sung SW, Yoo KY, Hong YC. Genetic polymorphisms of ataxia telangiectasia mutated affect lung cancer risk. Hum Mol Genet. 2006; 15:1181–86. https://doi.org/10.1093/hmg/ddl033 [PubMed]
- 33. Yan Z, Tong X, Ma Y, Liu S, Yang L, Yang X, Yang X, Bai M, Fan H. Association between ATM gene polymorphisms, lung cancer susceptibility and radiation-induced pneumonitis: a meta-analysis. BMC Pulm Med. 2017; 17:205. https://doi.org/10.1186/s12890-017-0555-7 [PubMed]
- 34. Angèle S, Romestaing P, Moullan N, Vuillaume M, Chapot B, Friesen M, Jongmans W, Cox DG, Pisani P, Gérard JP, Hall J. ATM haplotypes and cellular response to DNA damage: association with breast cancer risk and clinical radiosensitivity. Cancer Res. 2003; 63:8717–25. [PubMed]
- 35. Romanowska M, Maciag A, Smith AL, Fields JR, Fornwald LW, Kikawa KD, Kasprzak KS, Anderson LM. DNA damage, superoxide, and mutant K-ras in human lung adenocarcinoma cells. Free Radic Biol Med. 2007; 43:1145–55. https://doi.org/10.1016/j.freeradbiomed.2007.07.004 [PubMed]
- 36. Lee JH, Mand MR, Kao CH, Zhou Y, Ryu SW, Richards AL, Coon JJ, Paull TT. ATM directs DNA damage responses and proteostasis via genetically separable pathways. Sci Signal. 2018; 11:11. https://doi.org/10.1126/scisignal.aan5598 [PubMed]