Prognostic value of microRNAs in pancreatic cancer: a meta-analysis
Abstract
Background: The prognostic impact of microRNA (miRNA) expression levels in pancreatic cancer (PC) has been estimated for years, but the outcomes are controversial and heterogeneous. Therefore, we comprehensively reviewed the evidence collected on miRNA expression in PC to determine this effect.
Results: PC patients with high miR-21 (HR=2.61, 95%CI=1.68-4.04), miR-451a (HR=2.23, 95%CI=1.23-4.04) or miR-1290 (HR=1.43, 95%CI=1.04-1.95) levels in blood had significantly poorer OS (P<0.05). Furthermore, PC patients with high miR-10b (HR=1.73, 95%CI=1.09-2.76), miR-17-5p (HR=1.91, 95%CI=1.30-2.80), miR-21 (HR=1.90, 95%CI=1.61-2.25), miR-23a (HR=2.18, 95%CI=1.52-3.13), miR-155 (HR=2.22, 95%CI=1.27-3.88), miR-203 (HR=1.65, 95%CI=1.14-2.40), miR-221 (HR=1.72, 95%CI=1.08-2.74), miR-222 levels (HR=1.72, 95%CI=1.02-2.91) or low miR-29c (HR=1.39, 95%CI=1.08-1.79), miR-126 (HR=1.55, 95%CI=1.23-1.95), miR-218 (HR=2.62, 95%CI=1.41-4.88) levels in tissues had significantly shorter OS (P<0.05).
Conclusions: In summary, blood miR-21, miR-451a, miR-1290 and tissue miR-10b, miR-17-5p, miR-21, miR-23a, miR-29c, miR-126, miR-155, miR-203, miR-218, miR-221, miR-222 had significant prognostic value.
Methods: We searched PubMed, EMBASE, Web of Science and Cochrane Database of Systematic Reviews to recognize eligible studies, and 57 studies comprising 5445 PC patients and 15 miRNAs were included to evaluate the associations between miRNA expression levels and overall survival (OS) up to June 1, 2019. Summary hazard ratios (HR) with 95% confidence intervals (CI) were calculated to assess the effect.
Introduction
Much effort has been made over a long period of time to identify prognostic biomarkers in pancreatic cancer (PC) patients. Fortunately, a large body of literature has covered the survival of PC patients with abnormal microRNA (miRNA) expression [1–169]. Among all kinds of human cancers, PC has one of the worst prognoses, with a 5-year overall survival (OS) rate of lower than 5% [170]. Despite advances in clinical treatments and new surgical techniques, the survival rate of PC patients has been low for more than 30 years [171]. PC is highly aggressive; therefore, distant metastasis and tissue invasion may occur at early stages [172]. Since invasion and metastasis are the biggest obstacles to effective treatment of PC, it is imperative to explore the molecular biological mechanism leading to such invasive behavior to improve the survival time of patients.
miRNAs are small noncoding RNAs involved in gene regulation [173]. In cancers, a few upregulated miRNAs can serve as oncogenes (oncomiRs) [174], and downregulated miRNAs can serve as tumor suppressors [175]. Expression profiling data analyses have revealed signatures of diagnosis and prognosis that have been employed to stratify various tumor types [174, 176]. As a consequence, miRNAs have the potential to turn into clinical biomarkers for human tumors and into molecular therapeutic targets [177].
Despite comprehensive studies focused on illustrating the molecular biological mechanisms in PC, there are still challenges confronting the identification of minimally invasive and sensitive biomarkers of prognosis. Consequently, it is of vital significance to find prognostic signatures that can be conveniently and reliably applied in the clinical setting to improve the survival time of PC patients.
Increasing evidence indicates that miRNAs have the potential to act as PC prognostic biomarkers in clinical practice [1–169]. Regrettably, there has not been a meta-analysis to evaluate the relationship between dysregulated miRNA expression and survival in PC patients. In view of our previous work, meta-analyses of miRNA expression and cancer patients [178, 179], it is necessary to conduct the current work by searching the recently published literature about miRNAs as prognostic tools in PC tissue or blood.
Results
Meta-analysis
An overview of the HR with 95%CI obtained from the overall comprehensive analysis for all included miRNAs is shown in Table 1. Based on the logical order of the miRNA names, the forest plot, Begg’s funnel plot, sensitivity analysis and funnel plot of the merged analysis adjusted with the trim and fill method are shown in Figures 1–7. The mean NOS score of the included studies was 7.0 (5.0-8.0), indicating that their quality was adequate (Table 2).
Table 1. Summary about results of meta-analysis for miRNA expression in pancreatic cancer.
| miRNA | Sample | Survival analysis | Number of articles | Included studies | HR | 95%CI | Figure | P value | Heterogeneity (Higgins I2 statistic) | Total patients |
| High miR-21 | Blood | OS | 5 | 4-8 | 2.61 | 1.68-4.04 | 2 | <0.01 | I2=33.8%, P=0.20 | 326 |
| High miR-196a | Blood | OS | 2 | 16,17 | 1.61 | 0.50-5.23 | 2 | 0.43 | I2=79.5%, P=0.03 | 66 |
| High miR-451a | Blood | OS | 3 | 7,8,23 | 2.23 | 1.23-4.04 | 2 | <0.01 | I2=2.1%, P=0.36 | 137 |
| High miR-1290 | Blood | OS | 2 | 24,26 | 1.43 | 1.04-1.95 | 2 | 0.03 | I2=0.0%, P=0.76 | 223 |
| High miR-10b | Tissue | OS | 4 | 35-38 | 1.73 | 1.09-2.76 | 3 | 0.02 | I2=61.5%, P=0.03 | 375 |
| High miR-17-5p | Tissue | OS | 3 | 39-41 | 1.91 | 1.30-2.80 | 3 | <0.01 | I2=0.0%, P=0.96 | 164 |
| High miR-21 | Tissue | OS | 19 | 5,43-60 | 1.90 | 1.61-2.25 | 3 | <0.01 | I2=43.9%, P=0.02 | 1947 |
| High miR-21 | Tissue | OSm | 8 | 5,45-48,50-52 | 2.43 | 1.89-3.13 | 4 | <0.01 | I2=0.0%, P=0.73 | 592 |
| High miR-21 | Tissue | OSAdjusted | | | 1.58 | 1.32-1.89 | | <0.01 | I2=58.6%, P<0.01 | |
| High mIR-23a | Tissue | OS | 4 | 50,53,61,62 | 2.18 | 1.52-3.13 | 8 | <0.01 | I2=0.0%, P=0.51 | 251 |
| Low miR-29c | Tissue | OS | 4 | 33,46,69,70 | 1.39 | 1.08-1.79 | 8 | 0.01 | I2=51.8%, P=0.10 | 463 |
| Low miR-126 | Tissue | OS | 3 | 27,68,82 | 1.55 | 1.23-1.95 | 8 | <0.01 | I2=0.0%, P=0.99 | 455 |
| High miR-155 | Tissue | OS | 3 | 14,50,51 | 2.22 | 1.27-3.88 | 8 | <0.01 | I2=0.0%, P=0.47 | 211 |
| Low mIR-200c | Tissue | OS | 3 | 109-111 | 1.40 | 0.51-3.79 | 8 | 0.51 | I2=87.2%, P<0.01 | 258 |
| High miR-203 | Tissue | OS | 4 | 59,112-114 | 1.65 | 1.14-2.40 | 8 | <0.01 | I2=83.6%, P<0.01 | 619 |
| Low miR-218 | Tissue | OS | 3 | 121-123 | 2.62 | 1.41-4.88 | 8 | <0.01 | I2=57.5%, P=0.10 | 248 |
| High miR-221 | Tissue | OS | 4 | 46,50,125,126 | 1.72 | 1.08-2.74 | 8 | 0.02 | I2=4.9%, P=0.37 | 187 |
| High miR-222 | Tissue | OS | 3 | 28,126,127 | 1.72 | 1.02-2.91 | 8 | 0.04 | I2=36.8%, P=0.21 | 322 |
| HR: hazard ratios; CI: confidence intervals; OS: overall survival; mmultivariate analysis; AdjustedAdjusted with the trim and fill method. |
Table 2. Newcastle-Ottawa scale quality assessment results.
| First author | Year | Reference | Selection | Comparability | Outcome | Total |
| Liu | 2012 | [4] | ★★★ | ★★ | ★★ | 7 |
| Wang | 2013 | [5] | ★★★ | ★★ | ★★ | 7 |
| Abue | 2015 | [6] | ★★★ | ★★ | ★★ | 7 |
| Goto | 2018 | [7] | ★★★ | ★★ | ★★ | 7 |
| Kawamura | 2019 | [8] | ★★★ | ★★ | ★★★ | 8 |
| Mikamori | 2017 | [14] | ★★★ | ★★ | ★★★ | 8 |
| Kong | 2010 | [16] | ★★★ | ★★ | ★★ | 7 |
| Yu | 2017 | [17] | ★★★ | ★★ | ★★ | 7 |
| Takahasi | 2018 | [23] | ★★★ | ★★ | ★★ | 7 |
| Li | 2013 | [24] | ★★★ | ★★ | ★★★ | 8 |
| Tavano | 2013 | [26] | ★★★ | ★★ | ★★ | 7 |
| Liao | 2018 | [27] | ★★★ | ★★ | ★★ | 7 |
| Schultz | 2012 | [28] | ★★★ | ★★ | ★★ | 7 |
| Wang | 2019 | [33] | ★★ | ★ | ★★★ | 6 |
| Nakata | 2011 | [35] | ★★ | ★ | ★★★ | 6 |
| Preis | 2011 | [36] | ★★★ | ★★ | ★★ | 7 |
| Nguyen | 2016 | [37] | ★★★ | ★★ | ★★ | 7 |
| Yang | 2017 | [38] | ★★★ | ★★ | ★★★ | 8 |
| Yu | 2010 | [39] | ★★★ | ★★ | ★★★ | 8 |
| Gu | 2016 | [40] | ★★★ | ★★ | ★★ | 7 |
| Zhu | 2018 | [41] | ★★ | ★ | ★★ | 5 |
| Dillhoff | 2008 | [43] | ★★ | ★ | ★★★ | 6 |
| Giovannetti | 2010 | [44] | ★★★ | ★★ | ★★★ | 8 |
| Hwang | 2010 | [45] | ★★★ | ★★ | ★★★ | 8 |
| Jamieson | 2011 | [46] | ★★★ | ★★ | ★★ | 7 |
| Nagao | 2012 | [47] | ★★★ | ★★ | ★★ | 7 |
| Caponi | 2013 | [48] | ★★★ | ★★ | ★★★ | 8 |
| Kadera | 2013 | [49] | ★★★ | ★★ | ★★★ | 8 |
| Ma | 2013 | [50] | ★★★ | ★★ | ★★ | 7 |
| Papaconstantinou | 2013 | [51] | ★★★ | ★★ | ★★★ | 8 |
| Donahue | 2014 | [52] | ★★★ | ★★ | ★★★ | 8 |
| Frampton | 2014 | [53] | ★★★ | ★★ | ★★ | 7 |
| Mitsuhashi | 2015 | [54] | ★★★ | ★★ | ★★ | 7 |
| Vychytilova-Faltejskova | 2015 | [55] | ★★ | ★ | ★★ | 5 |
| Morinaga | 2016 | [56] | ★★★ | ★★ | ★★★ | 8 |
| Benesova | 2018 | [57] | ★★★ | ★★ | ★★ | 7 |
| Xi | 2018 | [58] | ★★ | ★ | ★★★ | 6 |
| Zhang | 2018 | [59] | ★★ | ★ | ★★★ | 6 |
| Zhao | 2018 | [60] | ★★★ | ★★ | ★★★ | 8 |
| Diao | 2018 | [61] | ★★ | ★ | ★★ | 5 |
| Wu | 2018 | [62] | ★★★ | ★★ | ★★ | 7 |
| Liang | 2018 | [68] | ★★ | ★ | ★★★ | 6 |
| Jiang | 2015 | [69] | ★★ | ★ | ★★ | 5 |
| Zou | 2015 | [70] | ★★★ | ★★ | ★★ | 7 |
| Yu | 2018 | [82] | ★★★ | ★★ | ★★★ | 8 |
| Yu | 2010 | [109] | ★★★ | ★★ | ★★★ | 8 |
| Paik | 2015 | [110] | ★★★ | ★★ | ★★★ | 8 |
| Liu | 2016 | [111] | ★★★ | ★★ | ★★★ | 8 |
| Ikenaga | 2010 | [112] | ★★★ | ★★ | ★★★ | 8 |
| Shao | 2017 | [113] | ★★ | ★ | ★★★ | 6 |
| Shi | 2018 | [114] | ★★ | ★ | ★★★ | 6 |
| Li | 2013 | [121] | ★★★ | ★★ | ★★ | 7 |
| Zhu | 2014 | [122] | ★★★ | ★★ | ★★ | 7 |
| Li | 2015 | [123] | ★★★ | ★★ | ★★★ | 8 |
| Sarkar | 2013 | [125] | ★★ | ★ | ★★★ | 6 |
| Wang | 2016 | [126] | ★★★ | ★★ | ★★ | 7 |
| Lee | 2013 | [127] | ★★★ | ★★ | ★★ | 7 |
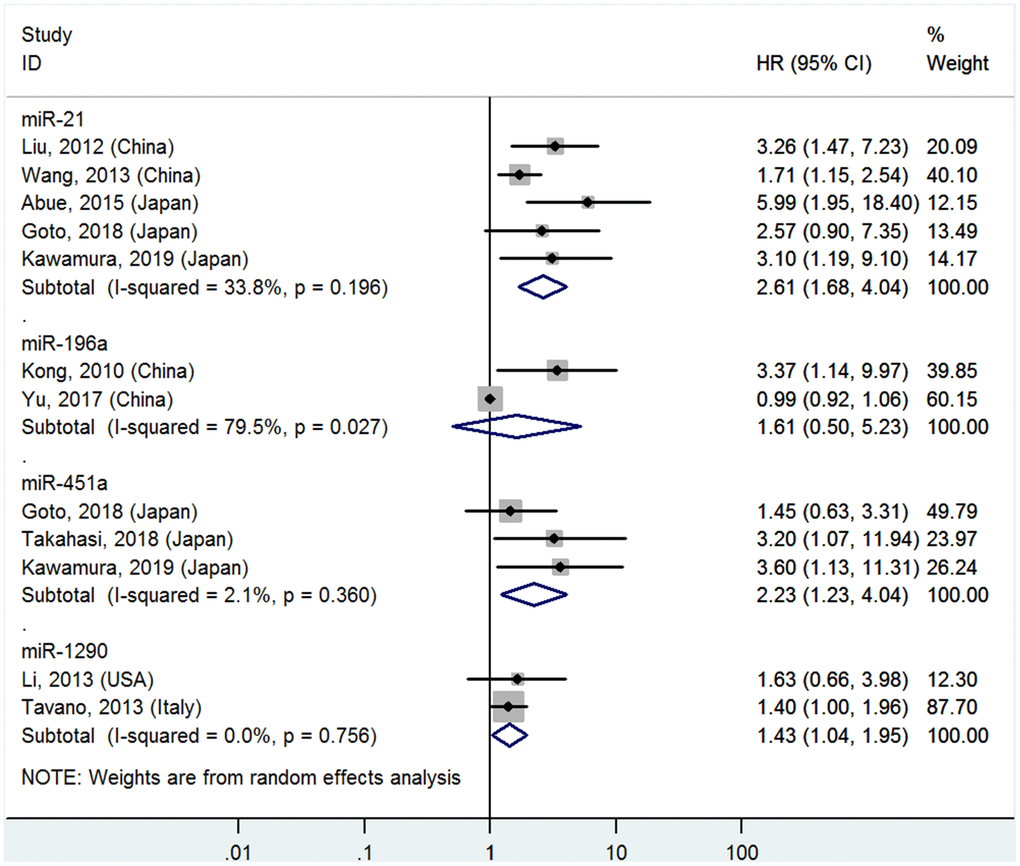
Figure 1. Forest plot about OS of PC patients with high miR-21, miR-196a, miR-451a or miR-1290 level in blood
High miR-21, miR-451a and miR-1290 levels in the blood predict poor OS
Five studies [4–8] analyzed the connections between high blood miR-21 levels and OS, indicating that PC patients with high blood miR-21 levels had significantly poorer OS than those with low levels (HR=2.61, 95%CI=1.68-4.04, P<0.01, Figure 1).
Two studies [16, 17] reported the relationship between high blood miR-196a levels and OS, but no significant associations were found between high blood miR-196a and OS (HR=1.61, 95%CI=0.50-5.23, P=0.43, Figure 1).
Three studies [7, 8, 23] focused on the correlativity between high blood miR-451a levels and OS, indicating that PC patients with high miR-451a levels had significantly shorter OS than those with low levels (HR=2.23, 95%CI=1.23-4.04, P<0.01, Figure 1).
Two studies [24, 26] stressed the pertinence between high blood miR-1290 levels and OS, suggesting that PC patients with high miR-1290 levels had significantly worse OS than those with low levels (HR=1.43, 95%CI=1.04-1.95, P=0.03, Figure 1).
High miR-10b, miR-17-5P, miR-21, miR-23a, miR-155, miR-203, miR-221, and miR-222 levels or low miR-29c, miR-126, and miR-218 levels in tissues predict poor OS
The details are shown in Table 1 and Figures 2 and 7.
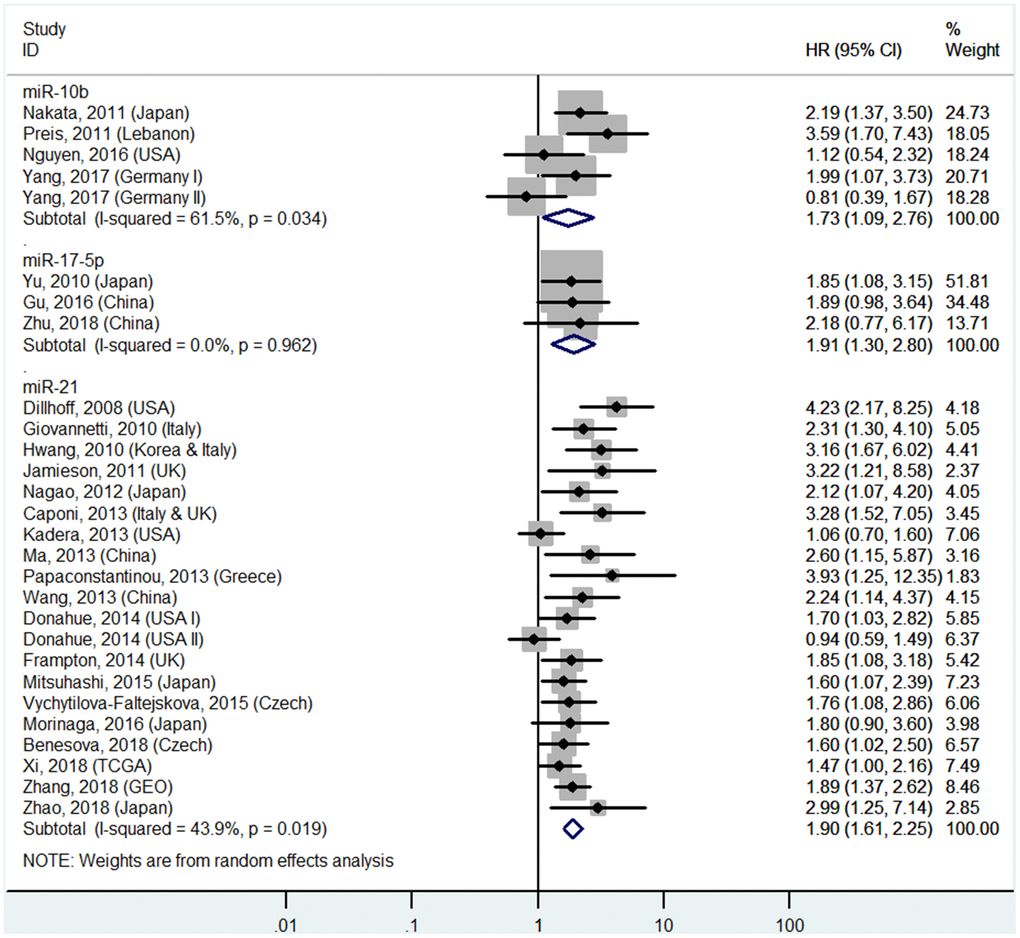
Figure 2. Forest plot about OS of PC patients with high miR-10b, miR-17-5P or miR-21 level in tissue.
High miR-21 levels in tissues predict poor OS (multivariate analysis)
The details are shown in Table 1 and Figure 3.
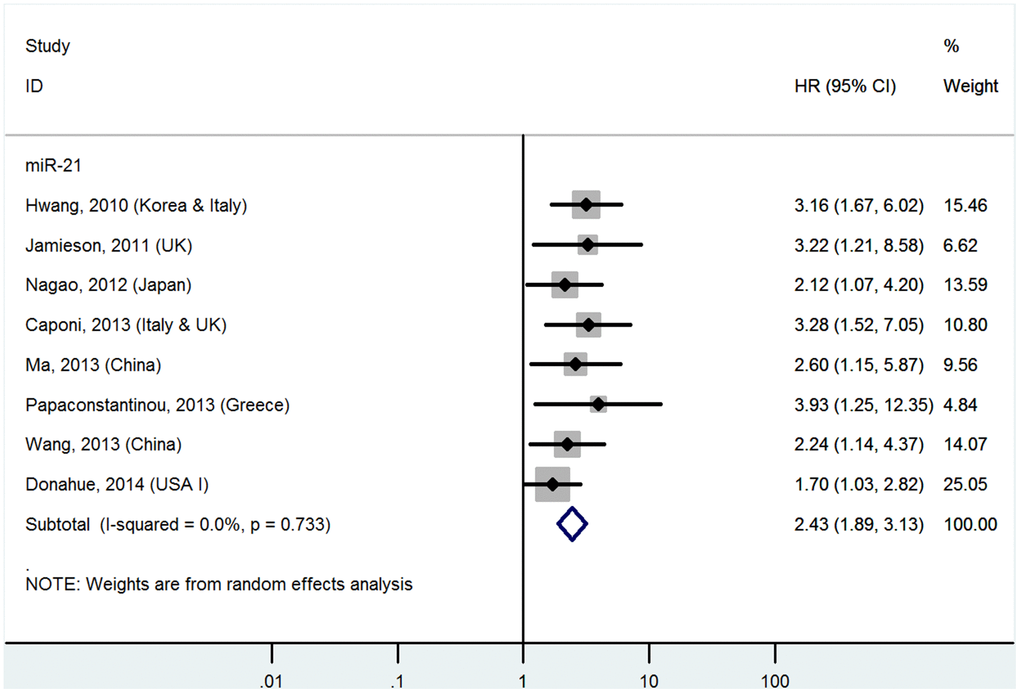
Figure 3. Forest plot about OS of PC patients with high miR-21 level in tissue (multivariate analysis).
Publication bias
Begg’s funnel plot was employed to estimate publication bias in the study of OS in PC patients with high tissue miR-21 levels (Figure 4). The results showed that the P value was less than 0.01, indicating the presence of publication bias.
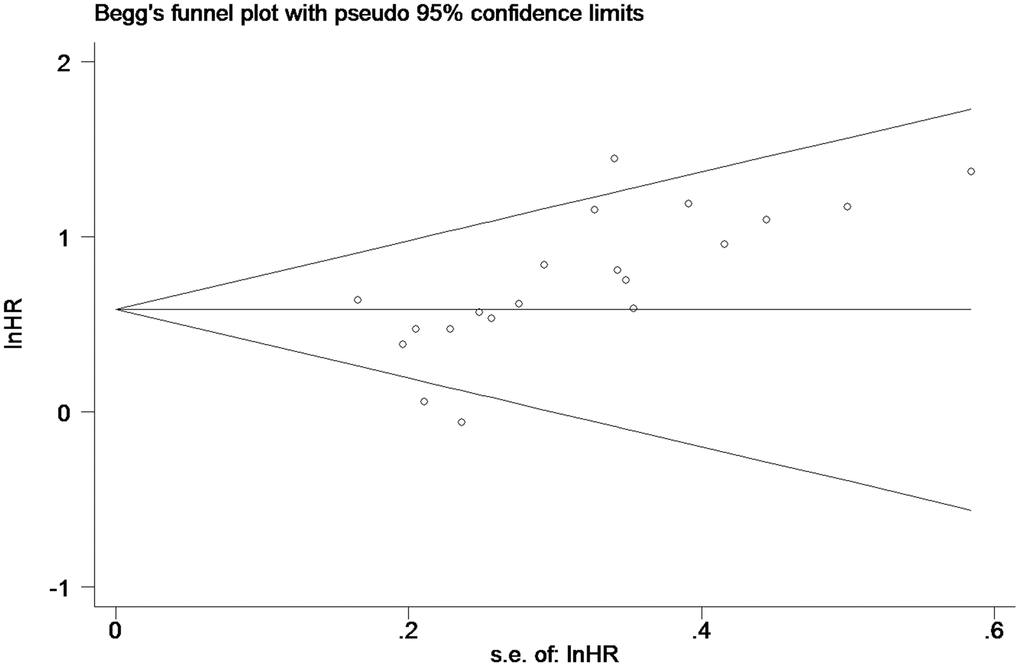
Figure 4. Begg’s funnel plot about OS of PC patients with high miR-21 level in tissue.
Sensitivity analysis
Sensitivity analysis was used to estimate whether any single study had undue influence on the OS of PC patients with high tissue miR-21 levels (Figure 5). The outcome showed that no single investigation significantly affected the pooled HR and 95%CI.
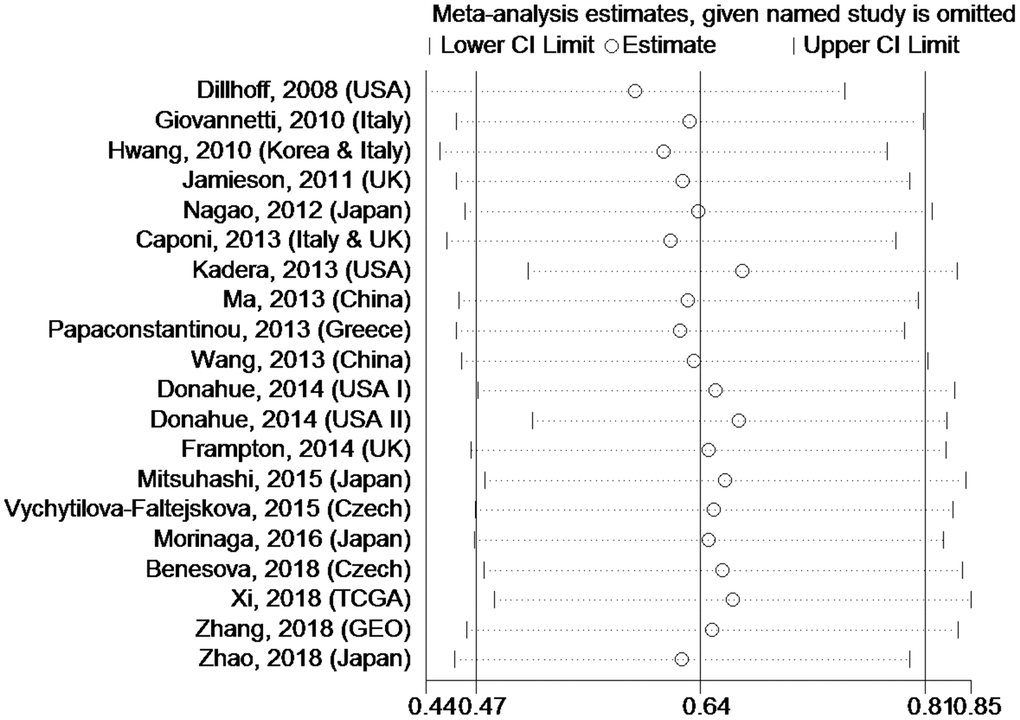
Figure 5. Sensitivity analysis about OS of PC patients with high miR-21 level in tissue.
The trim and fill method
As such (Figure 4), the trim and fill method was conducted, and the pooled HR was recalculated with assumed lost studies to assess dissymmetry in the funnel plot (Figure 6), manifesting no publication bias (P=0.80). The recalculated HR did not change significantly for OS (HR=1.58, 95%CI=1.32-1.89, P<0.01).
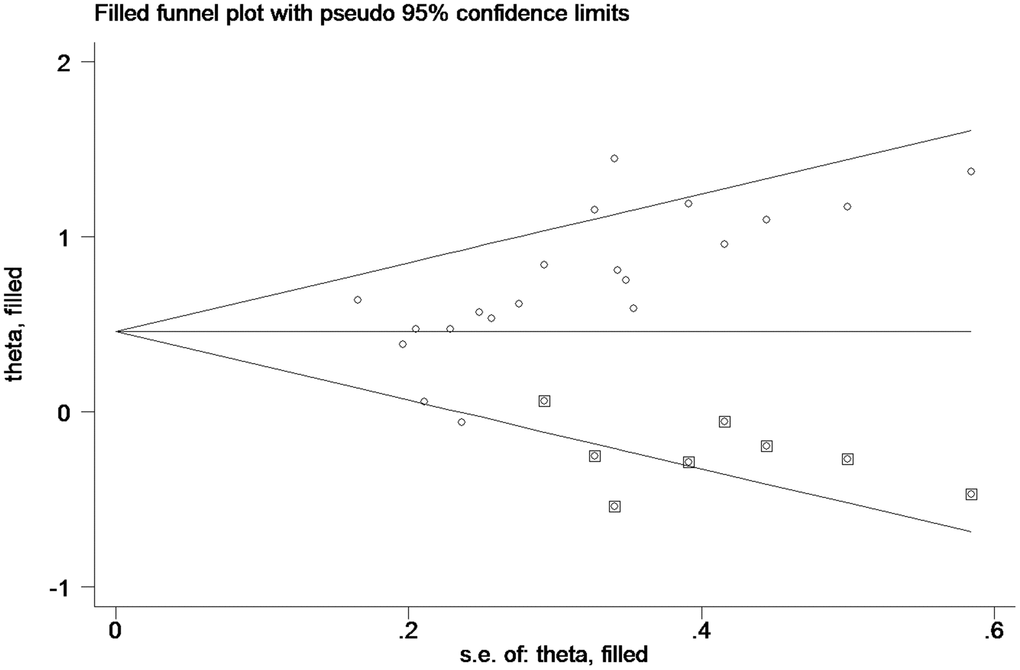
Figure 6. Funnel plot about pooled analysis adjusted with trim and fill method of OS of PC patients with high miR-21 level in tissue. Circles: included studies; diamonds: presumed missing studies.
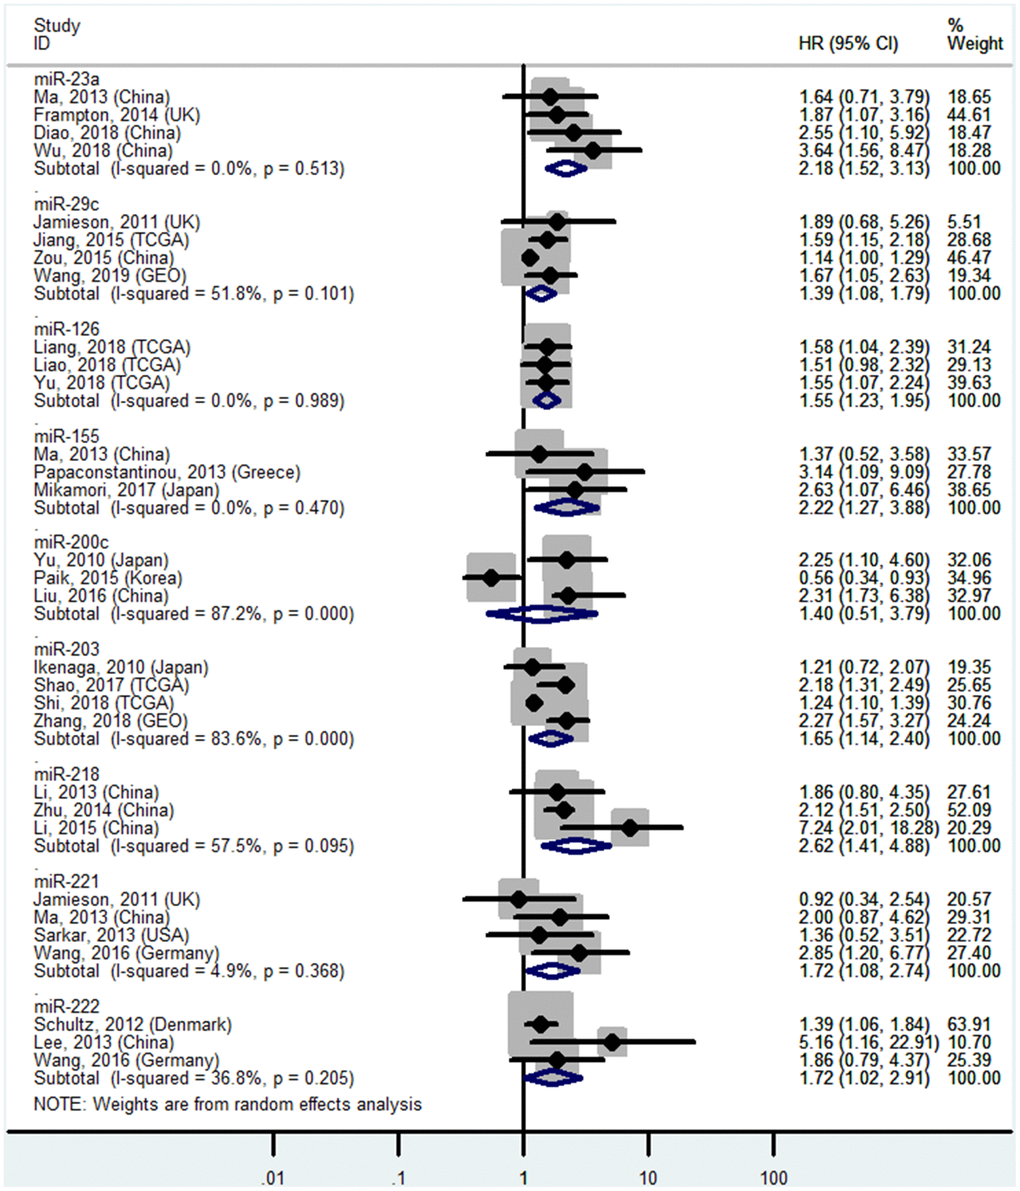
Figure 7. Forest plot about OS of PC patients with high miR-23a, miR-155, miR-203, miR-221, miR-222 or low miR-29c, miR-126, miR-200c, miR-218 level in tissue.
Discussion
Foremost findings
The current meta-analysis included 57 English articles that incorporated 15 miRNAs and 5445 patients. As the most researched miRNA, PC patients with high blood or tissue miR-21 levels had significantly poorer OS than those with low levels. It also proved true among PC patients with high tissue miR-21 levels (multivariate analysis) and pooled analysis adjusted with the trim and fill method of OS, indicating that miR-21 is a stable and useful prognostic biomarker in PC. Moreover, a few other miRNAs had significant prognostic impact on PC, including blood miR-451a, and miR-1290 and tissue miR-10b, miR-17-5p, miR-29c, miR-126, miR-155, miR-203, miR-218, miR-221, and miR-222. Among these, blood miR-21, and miR-451a and tissue miR-23a, miR-155, and miR-218 were strong biomarkers of prognosis for PC.
Altered expression, potential targets and pathways for studied miRNAs
In addition, an overview of the 15 miRNAs with dysregulated levels, covering the validated targets and pathways, is shown in Table 3. Most of the included miRNAs showed stable expression levels, higher or lower than the control groups except miR-200c. In brief, Table 3 could support a better understanding of the molecular biological mechanisms of miRNAs in PC.
Table 3. Summary of miRNAs with altered expression, their validated targets and pathways entered this study.
| miRNA | Reference | Expression | Potential target | Pathway |
| 10b | [35–38] | Up | None | Cell invasion |
| 17-5p | [39–41] | Up | PTEN,RBL2 | Cell cycle, invasion and proliferation |
| 21 | [4–8,43–60] | Up | BTG2,FASL,PDCD4,SPRY2 | Cell apopsotis, chemoresistance, cycle, proliferation, FASL/FAS, MAPK/ERK and PI3K/AKT signaling |
| 23a | [50, 53, 61, 62] | Up | ESRP1,FOXP2,NEDD4L | Cell invasion, epithelial-mesenchymal transition, migration and proliferation |
| 29c | [33, 46, 69, 70] | Down | MMP2 | Cell invasion, migration and Wnt signaling |
| 126 | [27, 68, 82] | Down | None | None |
| 155 | [14, 50, 51] | Up | None | None |
| 196a | [16,17] | Up | None | None |
| 200c | [109–111] | Unstable | None | Cell invasion and proliferation |
| 203 | [59, 112–114] | Up | None | None |
| 218 | [121–123] | Down | UGT8,VOPP1 | Cell proliferation |
| 221 | [46, 50, 125, 126] | Up | None | Cell migration and proliferation |
| 222 | [28, 126, 127] | Up | NOSTRIN | None |
| 451a | [7, 8, 23] | Up | None | None |
| 1290 | [24, 26] | Up | None | None |
| PTEN: phosphatase and tensin homolog; RBL2: RB transcriptional corepressor like 2; BTG2: BTG anti-proliferation factor 2; FASL: Fas ligand; PDCD4: programmed cell death 4; SPRY2: sprouty RTK signaling antagonist 2; ESRP1: epithelial splicing regulatory protein 1; FOXP2: forkhead box P2; NEDD4L: NEDD4 like E3 ubiquitin protein ligase; UGT8: UDP glycosyltransferase 8; VOPP1: VOPP1 WW domain binding protein; NOSTRIN: nitric oxide synthase trafficking; FAS: Fas cell surface death receptor; MAPK: mitogen-activated protein kinase; ERK: extracellular regulated protein kinases; PI3K: phosphoinositide-3-kinase; AKT: AKT serine/threonine kinase 1. |
Superiorities of the meta-analysis
The present work had two strengths : (1) we looked for and found out almost all studies with OS in PC patients with dysregulated miRNA levels. In addition, the recent miRNA expression pattern is shown in Tables 4 and 5 that differentiates miRNA names and the sample types. (2) The majority of included articles had large sample sizes (≥30, all but 4 studies [6, 41, 121, 125]), intensifying and widening the applicability of the prognostic outcomes for PC patients.
Table 4. Frequency of studies estimating prognostic value of blood miRNA expression in pancreatic cancer.
| miR | N | R | miR | N | R | miR | N | R | miR | N | R |
| let-7b-5p | 1 | 1 | 107 | 1 | 11 | 203 | 1 | 18 | 483-3p | 1 | 6 |
| 16-2-3p | 1 | 2 | 124 | 1 | 12 | 205 | 1 | 19 | 486-3p | 1 | 24 |
| 19a-3p | 1 | 1 | 125b-5p | 1 | 13 | 210 | 1 | 17 | 602 | 1 | 2 |
| 19b-3p | 1 | 1 | 150 | 1 | 10 | 222 | 1 | 20 | 629 | 1 | 25 |
| 21-5p | 1 | 3 | 155 | 1 | 14 | 223-3p | 1 | 1 | 877-5p | 1 | 2 |
| 21 | 5 | 4-8 | 182 | 1 | 15 | 301a-3p | 1 | 21 | 890 | 1 | 2 |
| 25-3p | 1 | 1 | 191 | 1 | 7 | 373 | 1 | 22 | 1290 | 2 | 24,26 |
| 33a | 1 | 9 | 192-5p | 1 | 1 | 375 | 1 | 3 | 3201 | 1 | 2 |
| 34a | 1 | 10 | 196a | 2 | 16,17 | 451a | 3 | 7,8,23 | 4525 | 1 | 8 |
Highlighted studies were included in the present meta-analysis; N: Number of studies estimating prognostic value; R: References.
Table 5. Frequency of studies estimating prognostic value of tissue miRNA expression in pancreatic cancer.
| miR | N | R | miR | N | R | miR | N | R | miR | N | R | miR | N | R |
| let-7a-3 | 1 | 27 | 92b-3p | 1 | 75 | 155 | 3 | 14,50,51 | 301a-3p | 1 | 129 | 509-5p | 1 | 151 |
| let-7g* | 1 | 28 | 93 | 1 | 38 | 181c | 1 | 100 | 301b | 1 | 38 | 539 | 1 | 152 |
| let-7g | 1 | 29 | 96-5p | 1 | 76 | 182-5p | 1 | 76 | 323-3p | 1 | 130 | 545 | 1 | 153 |
| 1 | 1 | 30 | 100 | 2 | 50,77 | 183 | 1 | 101 | 326 | 1 | 71 | 548an | 1 | 154 |
| 7-5p | 1 | 31 | 101 | 1 | 78 | 191 | 1 | 102 | 328 | 1 | 68 | 590-5p | 1 | 38 |
| 9-5p | 1 | 32 | 103 | 1 | 79 | 192 | 2 | 33,103 | 329 | 1 | 131 | 613 | 1 | 155 |
| 9 | 1 | 33 | 107 | 1 | 80 | 195 | 1 | 104 | 337 | 1 | 132 | 615-5p | 1 | 156 |
| 10a-5p | 1 | 34 | 124 | 1 | 81 | 196a-2 | 1 | 105 | 342-3p | 2 | 53,133 | 661 | 1 | 157 |
| 10b | 4 | 35-38 | 125a-3p | 1 | 29 | 196b | 2 | 59,106 | 361-3p | 1 | 134 | 663 | 1 | 158 |
| 15b | 1 | 38 | 125a | 1 | 68 | 198 | 2 | 55,107 | 367 | 1 | 135 | 664a | 1 | 68 |
| 17-5p | 3 | 39-41 | 125b | 1 | 77 | 199a-3p | 1 | 53 | 371-5p | 1 | 136 | 664 | 1 | 159 |
| 19a | 1 | 42 | 126 | 3 | 27,68,82 | 200c-3p | 1 | 108 | 374b-5p | 1 | 137 | 675-5p | 1 | 160 |
| 21 | 19 | 5,43-60 | 130b | 1 | 83 | 200c | 3 | 109-111 | 375 | 1 | 50 | 675 | 1 | 28 |
| 23a | 4 | 50,53,61,62 | 132 | 2 | 33,84 | 203 | 4 | 59,112-114 | 376b | 1 | 68 | 708-5p | 1 | 161 |
| 24-1 | 1 | 27 | 133a-1 | 1 | 27 | 204-5p | 1 | 115 | 376c | 1 | 68 | 744 | 1 | 162 |
| 25-3p | 1 | 63 | 133a | 2 | 33,85 | 204 | 1 | 95 | 377 | 1 | 138 | 891b | 1 | 163 |
| 26a | 1 | 64 | 135b-5p | 2 | 86,87 | 205-5p | 1 | 29 | 410-3p | 1 | 139 | 940 | 1 | 164 |
| 27a | 1 | 53 | 135b | 1 | 88 | 205 | 2 | 19,116 | 421 | 1 | 27 | 1181 | 1 | 165 |
| 29a-5p | 1 | 29 | 137 | 1 | 89 | 211 | 1 | 117 | 424 | 2 | 82,114 | 1246 | 1 | 166 |
| 29a | 1 | 65 | 139-5p | 1 | 90 | 212-3p | 1 | 29 | 429 | 1 | 140 | 1247 | 1 | 167 |
| 29b-2-5p | 1 | 66 | 139 | 1 | 91 | 212 | 2 | 28,118 | 448 | 1 | 141 | 1266 | 1 | 168 |
| 29b-3p | 1 | 67 | 140 | 1 | 33 | 214 | 1 | 30 | 450b-5p | 1 | 28 | 1293 | 1 | 114 |
| 29b | 2 | 33,68 | 141 | 2 | 92,93 | 216b-5p | 1 | 119 | 451 | 1 | 142 | 1301 | 1 | 68 |
| 29c | 4 | 33,46,69,70 | 142-3p | 2 | 53,94 | 216b | 1 | 120 | 454 | 1 | 68 | 3157 | 1 | 27 |
| 30a | 1 | 71 | 142-5p | 1 | 95 | 217 | 1 | 50 | 483-3p | 1 | 143 | 3613 | 1 | 68 |
| 30b | 1 | 72 | 143 | 1 | 50 | 218 | 3 | 121-123 | 491 | 1 | 33 | 3656 | 1 | 169 |
| 30d | 1 | 46 | 146a | 1 | 28 | 219 | 1 | 71 | 494 | 3 | 144-146 | 4521 | 1 | 27 |
| 30e | 1 | 27 | 148a* | 1 | 28 | 221-3p | 1 | 124 | 495 | 1 | 147 | 4709 | 1 | 27 |
| 31 | 2 | 50,54 | 148a | 1 | 50 | 221 | 4 | 46,50,125,126 | 497 | 1 | 148 | 5091 | 1 | 27 |
| 34a-5p | 2 | 29,73 | 148b | 1 | 96 | 222 | 3 | 28,126,127 | 501-3p | 1 | 149 | | | |
| 34a | 1 | 46 | 150 | 1 | 97 | 223 | 1 | 128 | 501 | 1 | 27 | | | |
| 34b | 1 | 74 | 153 | 2 | 98,99 | 224 | 2 | 46,71 | 506 | 1 | 150 | | | |
| Highlighted studies were included in the present meta-analysis; N: Number of studies estimating prognostic value; R: References. |
Drawbacks
The following drawbacks of the current meta-analysis should considered: (1) there were numerous variables, consisting of dissimilar sample types from PC patients at different stages, cutoffs, and miRNA detection methods, among which the differences in sample type and cutoffs were the main drawbacks; (2) we only selected English articles, perhaps excluding potential papers published in other languages about PC patients with miRNA expression levels and prognostic outcomes; (3) we only chose studies estimating OS, perhaps excluding potential investigations reporting prognosis with other survival results, such as disease-free and recurrence-free survival; (4) the prognostic impact of miRNA expression levels in pancreatic cancer should be adjusted for risk factors that have an important influence on pancreatic cancer prognosis, such as age, educational level, sex, smoking, obesity, heavy alcohol intake, underlying illnesses and family history of cancer, which indicates possible mutations. However, the searched papers may not all contain the very concerned information. Therefore, the impact of bias in predicting miRNAs involved in pancreatic cancer prognosis may occur due to the lack of adjustment for risk factors in a rigorous conclusion.
Insight for future clinical and experimental studies
Notably, this study was the first meta-analysis of the associations between abnormal miRNA levels and prognosis in PC patients. This study provides direction for further clinical and experimental study: (1) joint detection of various miRNA levels could be utilized by clinical workers and other health care providers, which might extremely expand the ability to assess the prognosis of PC patients such that immediate treatment might be supplied; (2) advances and trends regarding miRNA expression levels and the survival time of PC patients could be obviously acquired by the experimental researchers mentioned in Tables 4 and 5. In addition, miRNA molecular mechanisms could be obtained by assessing the data in Table 3; and (3) several contradictory outcomes concerning the prognostic value of miRNAs might be resolved on account of the present work.
Conclusions
In summary, blood miR-21, miR-451a, miR-1290 and tissue miR-10b, miR-17-5p, miR-21, miR-23a, miR-29c, miR-126, miR-155, miR-203, miR-218, miR-221, miR-222 had significant prognostic value.
Materials and Methods
Search strategy
Two independent authors (Fei Zhao and Chao Wei) performed the literature search from 4 online databases, PubMed, EMBASE, Web of Science and Cochrane Database of Systematic Reviews. Afterwards, Yue Zhang reassessed undetermined information. An extensive and comprehensive search was performed utilizing the keywords: ‘microRNA’, ‘miRNA’, ‘miR’, and ‘pancreatic cancer’, ‘pancreatic carcinoma’ and ‘pancreatic adenocarcinoma’. After duplicates were eliminated, 875 reports remained. Accordingly, 671 articles were excluded by titles and abstracts. For the residual 204 studies, 35 full-text studies were removed. The details of the literature selection are shown in Figure 8. The search deadline was June 1, 2019.
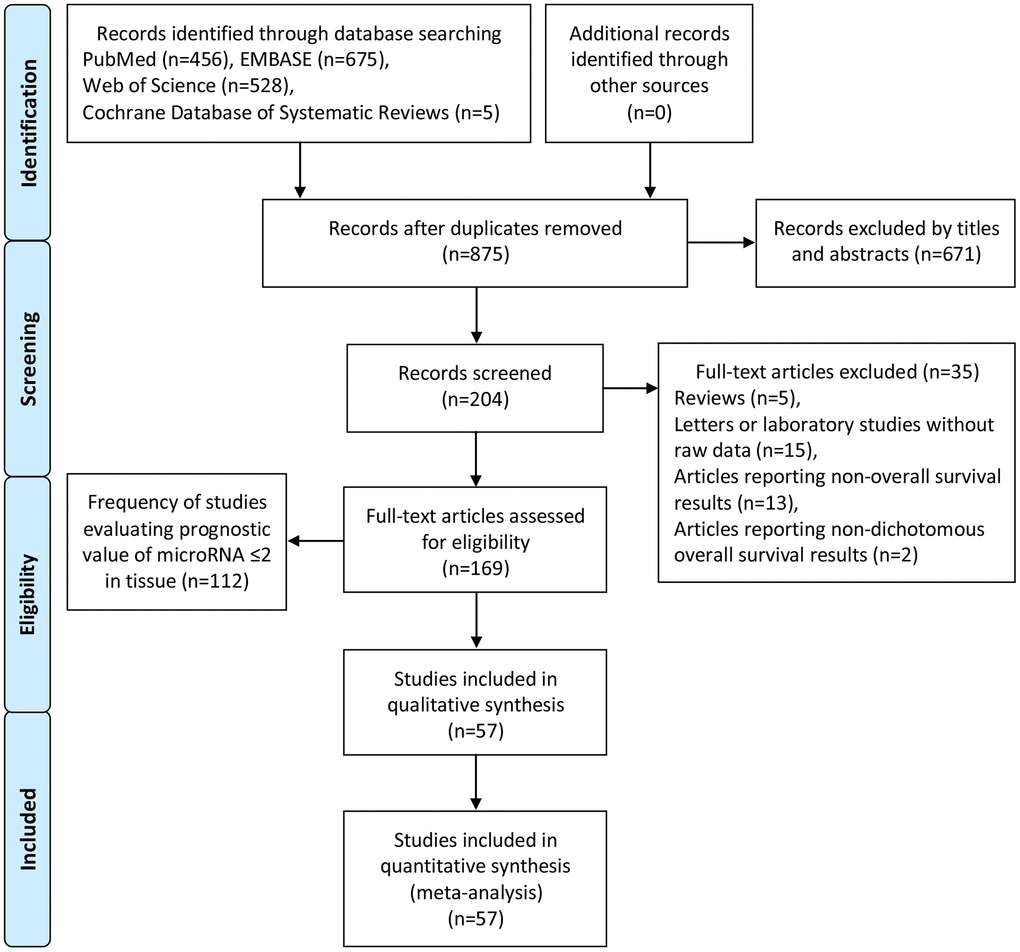
Figure 8. Flow diagram of literature search and selection.
Inclusion criteria
The inclusion criteria were as follows: (1) articles on the correlation between miRNA expression level and survival time of PC patients; (2) inclusion of estimated OS outcomes; and (3) full-text in English.
Exclusion criteria
The exclusion criteria were as follows: (1) articles without original data (reviews, letters or laboratory studies); (2) nondichotomous miRNA level; and (3) frequency of studies evaluating OS of miRNA expression level equal or less than 2 in tissue. In addition, on the condition that more than one article was published on the same subjects, the most well-rounded paper was chosen for the present work. Likewise, if both univariate and multivariate analysis of OS were covered, the latter was chosen, as this type of analysis considers interferential factors.
Quality assessment
Fei Zhao and Chao Wei confirmed all qualified studies that analyzed the prognostic value of miRNAs in PC, and Yue Zhang reevaluated undetermined information. Quality assessment for each paper was performed employing the modified Newcastle–Ottawa Scale (NOS) [180]. NOS scores were calculated according to selection, comparability, and outcome. Articles with NOS scores ≥6 were considered high-quality articles [181].
Study selection
The flow chart with details of the study selection process is given in Figure 8.
Study frequency
The frequency of studies estimating the OS of PC patients with and miRNA expressions of PC patients is presented in Tables 4 (blood) and 5 (tissue), and includes the miRNA names, the frequency of included miRNAs, and the reference number.
Study characteristics
The fundamental particulars of the included literature are fully listed in Table 6. On the condition that the data were not offered in the article but just as Kaplan–Meier survival curves, the data were abstracted from the curves, and the generation of HR with 95% CI was next carried out employing the software Engauge Digitizer version 4.1.
Table 6. Characteristics of included studies about pancreatic cancer.
| miRNA | Study | Country | Sample | Number | Stage | Cut-off | Method | Follow-up (month) | Result | HR (L/H) | HR (H/L) | 95%CI |
| 21 | Liu, 2012 [4] | China | Serum | 38 | I-IV | Median | qRT-PCR | 24 | OSu | | 3.26 | 1.47-7.23 |
| 21 | Wang, 2013 [5] | China | Serum | 177 | III-IV | Median | qRT-PCR | 30 | OSm | | 1.71 | 1.15-2.54 |
| 21 | Abue, 2015 [6] | Japan | Plasma | 24 | I-IV | 850 | qRT-PCR | >20 | OSu | | 5.99 | 1.95-18.40 |
| 21 | Goto, 2018 [7] | Japan | Serum | 32 | I-IV | Median | qRT-PCR | >40 | OSu | | 2.57 | 0.90-7.35 |
| 21 | Kawamura, 2019 [8] | Japan | Plasma | 55 | I-II | Mean | qRT-PCR | 60 | OSm | | 3.10 | 1.19-9.10 |
| 196a | Kong, 2010 [16] | China | Serum | 35 | I-IV | -5.22 | qRT-PCR | >16 | OSu | | 3.37 | 1.14-9.97 |
| 196a | Yu, 2017 [17] | China | Plasma | 31 | None | Median | qRT-PCR | 15 | OSm | | 0.99 | 0.92-1.06 |
| 451a | Goto, 2018 [7] | Japan | Serum | 32 | I-IV | Median | qRT-PCR | >40 | OSu | | 1.45 | 0.63-3.31 |
| 451a | Takahasi, 2018 [23] | Japan | Plasma | 50 | I-II | Median | qRT-PCR | 54 | OSm | | 3.20 | 1.07-11.94 |
| 451a | Kawamura, 2019 [8] | Japan | Plasma | 55 | I-II | Mean | qRT-PCR | 60 | OSm | | 3.60 | 1.13-11.31 |
| 1290 | Li, 2013 [24] | USA | Serum | 56 | I-III | Median | qRT-PCR | >80 | OSu | | 1.63 | 0.66-3.98 |
| 1290 | Tavano, 2013 [26] | Italy | Plasma | 167 | I-IV | ROC | ddPCR | >40 | OSu | | 1.40 | 1.00-1.96 |
| 10b | Nakata, 2011 [35] | Japan | FFPE | 115 | None | None | qRT-PCR | 101 | OSu | | 2.19 | 1.37-3.50 |
| 10b | Preis, 2011 [36] | Lebanon | FFPE | 95 | I-IV | 5000 | ISH | 36 | OSu | | 3.59 | 1.73-7.43 |
| 10b | Nguyen, 2016 [37] | USA | Frozen | 55 | I-II | 1.5 fold | qRT-PCR | 34.25 | OSu | | 1.12 | 0.54-2.32 |
| 10b | Yang, 2017 [38] | Germany I | Frozen | 69 | I-IV | None | qRT-PCR | >60 | OSu | | 1.99 | 1.07-3.73 |
| | Germany II | Frozen | 41 | I-IV | None | qRT-PCR | >60 | OSu | | 0.81 | 0.39-1.67 |
| 17-5p | Yu, 2010 [39] | Japan | FFPE | 80 | I-IV | 5.69 | qRT-PCR | 100 | OSu | | 1.85 | 1.08-3.15 |
| 17-5p | Gu, 2016 [40] | China | Tissue | 58 | I-IV | None | qRT-PCR | >50 | OSu | | 1.89 | 0.98-3.64 |
| 17-5p | Zhu, 2018 [41] | China | Tissue | 26 | None | None | qRT-PCR | >50 | OSu | | 2.18 | 0.77-6.17 |
| 21 | Dillhoff, 2008 [43] | USA | FFPE | 80 | None | Median | ISH | >60 | OSu | | 4.23 | 2.17-8.25 |
| 21 | Giovannetti, 2010 [44] | Italy | Frozen | 59 | I-IV | Median | qRT-PCR | 60.5 | OSu | | 2.31 | 1.30-4.10 |
| 21 | Hwang, 2010 [45] | Korea and Italy | Tissue | 97 | II-IV | Median | qRT-PCR | >60 | OSm | | 3.16 | 1.67-6.02 |
| 21 | Jamieson, 2011 [46] | UK | Frozen | 48 | None | Median | qRT-PCR | >50 | OSm | | 3.22 | 1.21-8.58 |
| 21 | Nagao, 2012 [47] | Japan | FFPE | 65 | None | Mean | qRT-PCR | >40 | OSm | | 2.12 | 1.07-4.20 |
| 21 | Caponi, 2013 [48] | Italy and UK | FFPE | 57 | None | Median | qRT-PCR | 117.3 | OSm | | 3.28 | 1.52-7.05 |
| 21 | Kadera, 2013 [49] | USA | Tissue | 145 | I-II,IV | Median | ISH | 100 | OSu | | 1.06 | 0.70-1.60 |
| 21 | Ma, 2013 [50] | China | Frozen | 78 | I-IV | 2 fold | qRT-PCR | >25 | OSm | | 2.60 | 1.15-5.87 |
| 21 | Papaconstantinou, 2013 [51] | Greece | FFPE | 88 | None | Mean | qRT-PCR | >60 | OSm | | 3.93 | 1.25-12.35 |
| 21 | Wang, 2013 [5] | China | Tissue | 65 | III-IV | Median | qRT-PCR | 60 | OSm | | 2.24 | 1.14-4.37 |
| 21 | Donahue, 2014 [52] | USA I | FFPE | 94 | I-IV | Median | ISH | 72 | OSm | | 1.70 | 1.03-2.82 |
| | USA II | FFPE | 87 | I-IV | Median | ISH | 72 | OSu | | 0.94 | 0.59-1.49 |
| 21 | Frampton, 2014 [53] | UK | Frozen | 91 | IIA,IIB | Median | qRT-PCR | >48 | OSu | | 1.85 | 1.08-3.18 |
| 21 | Mitsuhashi, 2015 [54] | Japan | FFPE | 283 | I-IV | 75% | qRT-PCR | 48 | OSu | | 1.60 | 1.07-2.39 |
| 21 | Vychytilova-Faltejskova, 2015 [55] | Czech | FFPE | 74 | None | 27.15 | qRT-PCR | >40 | OSu | | 1.76 | 1.08-2.86 |
| 21 | Morinaga, 2016 [56] | Japan | FFPE | 39 | None | Median | ISH | 114.1 | OSu | | 1.80 | 0.90-3.60 |
| 21 | Benesova, 2018 [57] | Czech | FFPE | 91 | II-IV | Median | qRT-PCR | 18 | OSu | | 1.60 | 1.02-2.50 |
| 21 | Xi, 2018 [58] | TCGA | Tissue | 169 | I-IV | Median | Downloaded | 60 | OSu | | 1.47 | 1.00-2.16 |
| 21 | Zhang, 2018 [59] | GEO | Tissue | 174 | I-IV | Median | Downloaded | >80 | OSu | | 1.89 | 1.37-2.62 |
| 21 | Zhao, 2018 [60] | Japan | Tissue | 63 | 0-IV | None | qRT-PCR | >60 | OSu | | 2.99 | 1.25-7.14 |
| 23a | Ma, 2013 [50] | China | Frozen | 78 | I-IV | 2 fold | qRT-PCR | >25 | OSu | | 1.64 | 0.71-3.79 |
| 23a | Frampton, 2014 [53] | UK | Frozen | 91 | IIA,IIB | Median | qRT-PCR | >48 | OSu | | 1.87 | 1.07-3.16 |
| 23a | Diao, 2018 [61] | China | Frozen | 30 | None | Median | qRT-PCR | 25 | OSu | | 2.55 | 1.10-5.92 |
| 23a | Wu, 2018 [62] | China | Tissue | 52 | None | 3.5 | qRT-PCR | >50 | OSu | | 3.64 | 1.56-8.47 |
| 29c | Jamieson, 2011 [46] | UK | Frozen | 48 | None | Median | qRT-PCR | >50 | OSm | 1.89 | | 0.68-5.26 |
| 29c | Jiang, 2015 [69] | TCGA | Frozen | 132 | I-IV | None | Downloaded | >50 | OSu | 1.59 | | 1.15-2.18 |
| 29c | Zou, 2015 [70] | China | FFPE | 105 | I-IV | Median | qRT-PCR | 30 | OSm | 1.14 | | 1.00-1.29 |
| 29c | Wang, 2019 [33] | GEO | Tissue | 178 | I-IV | None | Downloaded | >80 | OSu | 1.67 | | 1.05-2.63 |
| 126 | Liang, 2018 [68] | TCGA | FFPE | 175 | I-IV | Median | Downloaded | >83.3 | OSm | 1.58 | | 1.04-2.39 |
| 126 | Liao, 2018 [27] | TCGA | Tissue | 112 | I-II | None | Downloaded | >40 | OSu | 1.51 | | 0.98-2.32 |
| 126 | Yu, 2018 [82] | TCGA | Tissue | 168 | I-II | Median | Downloaded | 72.4 | OSm | 1.55 | | 1.07-2.24 |
| 155 | Ma, 2013 [50] | China | Frozen | 78 | I-IV | 2 fold | qRT-PCR | >25 | OSm | | 1.37 | 0.52-3.58 |
| 155 | Papaconstantinou, 2013 [51] | Greece | FFPE | 88 | None | Mean | qRT-PCR | >60 | OSm | | 3.14 | 1.09-9.09 |
| 155 | Mikamori, 2017 [14] | Japan | Tissue | 45 | I-II | Mean | qRT-PCR | >72 | OSm | | 2.63 | 1.07-6.46 |
| 200c | Yu, 2010 [109] | Japan | FFPE | 99 | I-IV | 0.64 | qRT-PCR | 101 | OSm | 2.25 | | 1.10-4.60 |
| 200c | Paik, 2015 [110] | Korea | FFPE | 84 | IB-III | 0.65 | qRT-PCR | 140 | OSm | 0.56 | | 0.34-0.93- |
| 200c | Liu, 2016 [111] | China | Tissue | 75 | I-IV | Mean | qRT-PCR | 60 | OSm | 2.31 | | 1.73-6.38 |
| 203 | Ikenaga, 2010 [112] | Japan | FFPE | 107 | I-IV | 0.054 | qRT-PCR | 98 | OSm | | 1.21 | 0.72-2.07 |
| 203 | Shao, 2017 [113] | TCGA | Tissue | 161 | I-IV | None | Downloaded | >80 | OSu | | 2.18 | 1.31-2.49 |
| 203 | Shi, 2018 [114] | TCGA | Tissue | 177 | None | Median | Downloaded | >72 | OSu | | 1.24 | 1.10-1.39 |
| 203 | Zhang, 2018 [59] | GEO | Tissue | 174 | I-IV | Median | Downloaded | >80 | OSu | | 2.27 | 1.57-3.27 |
| 218 | Li, 2013 [121] | China | FFPE | 28 | None | 1.5 fold | qRT-PCR | >20 | OSu | 1.86 | | 0.80-4.35 |
| 218 | Zhu, 2014 [122] | China | Frozen | 113 | I-IV | Mean | qRT-PCR | >50 | OSm | 2.12 | | 1.51-2.50 |
| 218 | Li, 2015 [123] | China | Frozen | 107 | I-IV | Median | qRT-PCR | 60 | OSm | 7.24 | | 2.01-18.28 |
| 221 | Jamieson, 2011 [46] | UK | Frozen | 48 | None | Median | qRT-PCR | >50 | OSm | | 0.92 | 0.34-2.54 |
| 221 | Ma, 2013 [50] | China | Frozen | 78 | I-IV | 2 fold | qRT-PCR | >25 | OSm | | 2.00 | 0.87-4.62 |
| 221 | Sarkar, 2013 [125] | USA | FFPE | 24 | None | None | qRT-PCR | >83.3 | OSu | | 1.36 | 0.52-3.51 |
| 221 | Wang, 2016 [126] | Germany | Frozen | 37 | I-II | 66.7% | qRT-PCR | >40 | OSu | | 2.85 | 1.20-6.77 |
| 222 | Schultz, 2012 [28] | Denmark | FFPE | 225 | I-II | Median | qRT-PCR | 24 | OSm | | 1.39 | 1.06-1.84 |
| 222 | Lee, 2013 [127] | China | Frozen | 60 | I-IV | Median | qRT-PCR | 15 | OSm | | 5.16 | 1.16-22.91 |
| 222 | Wang, 2016 [126] | Germany | Frozen | 37 | I-II | None | qRT-PCR | >40 | OSu | | 1.86 | 0.79-4.37 |
| HR (L/H): hazard ratios of low expression versus high expression of miRNAs; HR (H/L): hazard ratios of high expression versus low expression of miRNAs; CI: confidence intervals; TCGA: The Cancer Genome Atlas; GEO: Gene Expression Omnibus; FFPE: formalin-fixed paraffin-embedded; qRT-PCR: quantitative real-time polymerase chain reaction; ddPCR: droplet digital polymerase chain reaction; ISH: in-situ hybridization; OS: overall survival; uUnivariate analysis; mMultivariate analysis. |
Statistical analysis
All analyses were carried out employing Stata version 13.0 (StataCorp, College Station, TX, USA). OS was the primary and unique guideline for the prognosis of PC patients with miRNAs. The HR was regarded as significant at the P <0.05 level in case of the 95% CI not including the value 1. Furthermore, a single miRNA was considered a strong candidate if its HR was over 2. Most analyses used random-effects models other than fixed-effects models because of the dissimilarity of sample types from PC patients at dissimilar stages, cutoffs, and miRNA methods in single studies. Begg’s funnel plot was used to estimate publication bias. A two-tailed P value less than 0.05 was regarded as significant. If publication bias occurred, the trim and fill method was conducted. The sensitivity analysis was employed to assess how sensitive the entire effect size was to remove the impact of single investigations. If the point estimation was outside of the 95% CI of the entire effect value after it was excluded from the entire analysis, a single study was deemed to have undue influence.
Author Contributions
Study concept and design: Yue Zhang; Acquisition of data: Fei Zhao and Chao Wei; Analysis and interpretation of data: Fei Zhao, Chao Wei, Meng-Ying Cui, Qiang-Qiang Xia and Shuai-Bin Wang; Drafting of the manuscript: Yue Zhang; Revision of manuscript: Fei Zhao, Chao Wei, Meng-Ying Cui, Qiang-Qiang Xia, Shuai-Bin Wang and Yue Zhang; Supervision of work: Yue Zhang; All authors read and approved the final manuscript.
Conflicts of Interest
The authors declare that they have no conflicts of interest.
References
-
1.
Zou X, Wei J, Huang Z, Zhou X, Lu Z, Zhu W, Miao Y. Identification of a six-miRNA panel in serum benefiting pancreatic cancer diagnosis. Cancer Med. 2019; 8:2810–22. https://doi.org/10.1002/cam4.2145 [PubMed]
-
2.
Su Q, Zhu EC, Qu YL, Wang DY, Qu WW, Zhang CG, Wu T, Gao ZH. Serum level of co-expressed hub miRNAs as diagnostic and prognostic biomarkers for pancreatic ductal adenocarcinoma. J Cancer. 2018; 9:3991–99. https://doi.org/10.7150/jca.27697 [PubMed]
-
3.
Karasek P, Gablo N, Hlavsa J, Kiss I, Vychytilova-Faltejskova P, Hermanova M, Kala Z, Slaby O, Prochazka V. Pre-operative Plasma miR-21-5p Is a Sensitive Biomarker and Independent Prognostic Factor in Patients with Pancreatic Ductal Adenocarcinoma Undergoing Surgical Resection. Cancer Genomics Proteomics. 2018; 15:321–27. https://doi.org/10.21873/cgp.20090 [PubMed]
-
4.
Liu R, Chen X, Du Y, Yao W, Shen L, Wang C, Hu Z, Zhuang R, Ning G, Zhang C, Yuan Y, Li Z, Zen K, et al. Serum microRNA expression profile as a biomarker in the diagnosis and prognosis of pancreatic cancer. Clin Chem. 2012; 58:610–18. https://doi.org/10.1373/clinchem.2011.172767 [PubMed]
-
5.
Wang P, Zhuang L, Zhang J, Fan J, Luo J, Chen H, Wang K, Liu L, Chen Z, Meng Z. The serum miR-21 level serves as a predictor for the chemosensitivity of advanced pancreatic cancer, and miR-21 expression confers chemoresistance by targeting FasL. Mol Oncol. 2013; 7:334–45. https://doi.org/10.1016/j.molonc.2012.10.011 [PubMed]
-
6.
Abue M, Yokoyama M, Shibuya R, Tamai K, Yamaguchi K, Sato I, Tanaka N, Hamada S, Shimosegawa T, Sugamura K, Satoh K. Circulating miR-483-3p and miR-21 is highly expressed in plasma of pancreatic cancer. Int J Oncol. 2015; 46:539–47. https://doi.org/10.3892/ijo.2014.2743 [PubMed]
-
7.
Goto T, Fujiya M, Konishi H, Sasajima J, Fujibayashi S, Hayashi A, Utsumi T, Sato H, Iwama T, Ijiri M, Sakatani A, Tanaka K, Nomura Y, et al. An elevated expression of serum exosomal microRNA-191, -21, -451a of pancreatic neoplasm is considered to be efficient diagnostic marker. BMC Cancer. 2018; 18:116. https://doi.org/10.1186/s12885-018-4006-5 [PubMed]
-
8.
Kawamura S, Iinuma H, Wada K, Takahashi K, Minezaki S, Kainuma M, Shibuya M, Miura F, Sano K. Exosome-encapsulated microRNA-4525, microRNA-451a and microRNA-21 in portal vein blood is a high-sensitive liquid biomarker for the selection of high-risk pancreatic ductal adenocarcinoma patients. J Hepatobiliary Pancreat Sci. 2019; 26:63–72. https://doi.org/10.1002/jhbp.601 [PubMed]
-
9.
Liang C, Yu XJ, Guo XZ, Sun MH, Wang Z, Song Y, Ni QX, Li HY, Mukaida N, Li YY. MicroRNA-33a-mediated downregulation of Pim-3 kinase expression renders human pancreatic cancer cells sensitivity to gemcitabine. Oncotarget. 2015; 6:14440–55. https://doi.org/10.18632/oncotarget.3885 [PubMed]
-
10.
Long LM, Zhan JK, Wang HQ, Li S, Chen YY, Liu YS. The Clinical Significance of miR-34a in Pancreatic Ductal Carcinoma and Associated Molecular and Cellular Mechanisms. Pathobiology. 2017; 84:38–48. https://doi.org/10.1159/000447302 [PubMed]
-
11.
Imamura T, Komatsu S, Ichikawa D, Miyamae M, Okajima W, Ohashi T, Kiuchi J, Nishibeppu K, Konishi H, Shiozaki A, Morimura R, Ikoma H, Ochiai T, et al. Depleted tumor suppressor miR-107 in plasma relates to tumor progression and is a novel therapeutic target in pancreatic cancer. Sci Rep. 2017; 7:5708. https://doi.org/10.1038/s41598-017-06137-8 [PubMed]
-
12.
Sun B, Liu X, Gao Y, Li L, Dong Z. Downregulation of miR-124 predicts poor prognosis in pancreatic ductal adenocarcinoma patients. Br J Biomed Sci. 2016; 73:152–57. https://doi.org/10.1080/09674845.2016.1220706 [PubMed]
-
13.
Zhou X, Lu Z, Wang T, Huang Z, Zhu W, Miao Y. Plasma miRNAs in diagnosis and prognosis of pancreatic cancer: A miRNA expression analysis. Gene. 2018; 673:181–93. https://doi.org/10.1016/j.gene.2018.06.037 [PubMed]
-
14.
Mikamori M, Yamada D, Eguchi H, Hasegawa S, Kishimoto T, Tomimaru Y, Asaoka T, Noda T, Wada H, Kawamoto K, Gotoh K, Takeda Y, Tanemura M, et al. MicroRNA-155 Controls Exosome Synthesis and Promotes Gemcitabine Resistance in Pancreatic Ductal Adenocarcinoma. Sci Rep. 2017; 7:42339. https://doi.org/10.1038/srep42339 [PubMed]
-
15.
Chen Q, Yang L, Xiao Y, Zhu J, Li Z. Circulating microRNA-182 in plasma and its potential diagnostic and prognostic value for pancreatic cancer. Med Oncol. 2014; 31:225. https://doi.org/10.1007/s12032-014-0225-z [PubMed]
-
16.
Kong X, Du Y, Wang G, Gao J, Gong Y, Li L, Zhang Z, Zhu J, Jing Q, Qin Y, Li Z. Detection of differentially expressed microRNAs in serum of pancreatic ductal adenocarcinoma patients: miR-196a could be a potential marker for poor prognosis. Dig Dis Sci. 2011; 56:602–09. https://doi.org/10.1007/s10620-010-1285-3 [PubMed]
-
17.
Yu Q, Xu C, Yuan W, Wang C, Zhao P, Chen L, Ma J. Evaluation of Plasma MicroRNAs as Diagnostic and Prognostic Biomarkers in Pancreatic Adenocarcinoma: miR-196a and miR-210 Could Be Negative and Positive Prognostic Markers, Respectively. Biomed Res Int. 2017; 2017:6495867. https://doi.org/10.1155/2017/6495867 [PubMed]
-
18.
Ma J, Li X, Huang Q. High serum miR-203 predicts the poor prognosis in patients with pancreatic cancer. Int J Clin Exp Pathol. 2017; 10:4688–93.
-
19.
Michael Traeger M, Rehkaemper J, Ullerich H, Steinestel K, Wardelmann E, Senninger N, Abdallah Dhayat S. The ambiguous role of microRNA-205 and its clinical potential in pancreatic ductal adenocarcinoma. J Cancer Res Clin Oncol. 2018; 144:2419–31. https://doi.org/10.1007/s00432-018-2755-9 [PubMed]
-
20.
Li Z, Tao Y, Wang X, Jiang P, Li J, Peng M, Zhang X, Chen K, Liu H, Zhen P, Zhu J, Liu X, Liu X. Tumor-Secreted Exosomal miR-222 Promotes Tumor Progression via Regulating P27 Expression and Re-Localization in Pancreatic Cancer. Cell Physiol Biochem. 2018; 51:610–29. https://doi.org/10.1159/000495281 [PubMed]
-
21.
Wang X, Luo G, Zhang K, Cao J, Huang C, Jiang T, Liu B, Su L, Qiu Z. Hypoxic Tumor-Derived Exosomal miR-301a Mediates M2 Macrophage Polarization via PTEN/PI3Kγ to Promote Pancreatic Cancer Metastasis. Cancer Res. 2018; 78:4586–98. https://doi.org/10.1158/0008-5472.CAN-17-3841 [PubMed]
-
22.
Hua Y, Chen H, Wang L, Wang F, Wang P, Ning Z, Li Y, Liu L, Chen Z, Meng Z. Low serum miR-373 predicts poor prognosis in patients with pancreatic cancer. Cancer Biomark. 2017; 20:95–100. https://doi.org/10.3233/CBM-170231 [PubMed]
-
23.
Takahasi K, Iinuma H, Wada K, Minezaki S, Kawamura S, Kainuma M, Ikeda Y, Shibuya M, Miura F, Sano K. Usefulness of exosome-encapsulated microRNA-451a as a minimally invasive biomarker for prediction of recurrence and prognosis in pancreatic ductal adenocarcinoma. J Hepatobiliary Pancreat Sci. 2018; 25:155–61. https://doi.org/10.1002/jhbp.524 [PubMed]
-
24.
Li A, Yu J, Kim H, Wolfgang CL, Canto MI, Hruban RH, Goggins M. MicroRNA array analysis finds elevated serum miR-1290 accurately distinguishes patients with low-stage pancreatic cancer from healthy and disease controls. Clin Cancer Res. 2013; 19:3600–10. https://doi.org/10.1158/1078-0432.CCR-12-3092 [PubMed]
-
25.
Shi W, Lu Y, Gong R, Sun JJ, Liu G. Serum miR-629 is a novel molecular marker for diagnosis and the prognosis of pancreatic cancer. Eur Rev Med Pharmacol Sci. 2018; 22:5187–93. https://doi.org/10.26355/eurrev_201808_15715 [PubMed]
-
26.
Tavano F, Gioffreda D, Valvano MR, Palmieri O, Tardio M, Latiano TP, Piepoli A, Maiello E, Pirozzi F, Andriulli A. Droplet digital PCR quantification of miR-1290 as a circulating biomarker for pancreatic cancer. Sci Rep. 2018; 8:16389. https://doi.org/10.1038/s41598-018-34597-z [PubMed]
-
27.
Liao X, Wang X, Huang K, Yang C, Yu T, Han C, Zhu G, Su H, Huang R, Peng T. Genome-scale analysis to identify prognostic microRNA biomarkers in patients with early stage pancreatic ductal adenocarcinoma after pancreaticoduodenectomy. Cancer Manag Res. 2018; 10:2537–51. https://doi.org/10.2147/CMAR.S168351 [PubMed]
-
28.
Schultz NA, Andersen KK, Roslind A, Willenbrock H, Wøjdemann M, Johansen JS. Prognostic microRNAs in cancer tissue from patients operated for pancreatic cancer—five microRNAs in a prognostic index. World J Surg. 2012; 36:2699–707. https://doi.org/10.1007/s00268-012-1705-y [PubMed]
-
29.
Calatayud D, Dehlendorff C, Boisen MK, Hasselby JP, Schultz NA, Werner J, Immervoll H, Molven A, Hansen CP, Johansen JS. Tissue MicroRNA profiles as diagnostic and prognostic biomarkers in patients with resectable pancreatic ductal adenocarcinoma and periampullary cancers. Biomark Res. 2017; 5:8. https://doi.org/10.1186/s40364-017-0087-6 [PubMed]
-
30.
Cheng Q, Han LH, Zhao HJ, Li H, Li JB. Abnormal alterations of miR-1 and miR-214 are associated with clinicopathological features and prognosis of patients with PDAC. Oncol Lett. 2017; 14:4605–12. https://doi.org/10.3892/ol.2017.6819 [PubMed]
-
31.
Zhu W, Wang Y, Zhang D, Yu X, Leng X. MiR-7-5p functions as a tumor suppressor by targeting SOX18 in pancreatic ductal adenocarcinoma. Biochem Biophys Res Commun. 2018; 497:963–70. https://doi.org/10.1016/j.bbrc.2018.02.005 [PubMed]
-
32.
Wang J, Wang B, Ren H, Chen W. miR-9-5p inhibits pancreatic cancer cell proliferation, invasion and glutamine metabolism by targeting GOT1. Biochem Biophys Res Commun. 2019; 509:241–48. https://doi.org/10.1016/j.bbrc.2018.12.114 [PubMed]
-
33.
Wang W, Lou W, Ding B, Yang B, Lu H, Kong Q, Fan W. A novel mRNA-miRNA-lncRNA competing endogenous RNA triple sub-network associated with prognosis of pancreatic cancer. Aging (Albany NY). 2019; 11:2610–27. https://doi.org/10.18632/aging.101933 [PubMed]
-
34.
Xiong G, Huang H, Feng M, Yang G, Zheng S, You L, Zheng L, Hu Y, Zhang T, Zhao Y. MiR-10a-5p targets TFAP2C to promote gemcitabine resistance in pancreatic ductal adenocarcinoma. J Exp Clin Cancer Res. 2018; 37:76. https://doi.org/10.1186/s13046-018-0739-x [PubMed]
-
35.
Nakata K, Ohuchida K, Mizumoto K, Kayashima T, Ikenaga N, Sakai H, Lin C, Fujita H, Otsuka T, Aishima S, Nagai E, Oda Y, Tanaka M. MicroRNA-10b is overexpressed in pancreatic cancer, promotes its invasiveness, and correlates with a poor prognosis. Surgery. 2011; 150:916–22. https://doi.org/10.1016/j.surg.2011.06.017 [PubMed]
-
36.
Preis M, Gardner TB, Gordon SR, Pipas JM, Mackenzie TA, Klein EE, Longnecker DS, Gutmann EJ, Sempere LF, Korc M. MicroRNA-10b expression correlates with response to neoadjuvant therapy and survival in pancreatic ductal adenocarcinoma. Clin Cancer Res. 2011; 17:5812–21. https://doi.org/10.1158/1078-0432.CCR-11-0695 [PubMed]
-
37.
Nguyen HV, Gore J, Zhong X, Savant SS, Deitz-McElyea S, Schmidt CM, House MG, Korc M. MicroRNA Expression in a Readily Accessible Common Hepatic Artery Lymph Node Predicts Time to Pancreatic Cancer Recurrence Postresection. J Gastrointest Surg. 2016; 20:1699–706. https://doi.org/10.1007/s11605-016-3208-x [PubMed]
-
38.
Yang S, He P, Wang J, Schetter A, Tang W, Funamizu N, Yanaga K, Uwagawa T, Satoskar AR, Gaedcke J, Bernhardt M, Ghadimi BM, Gaida MM, et al. A Novel MIF Signaling Pathway Drives the Malignant Character of Pancreatic Cancer by Targeting NR3C2. Cancer Res. 2016; 76:3838–50. https://doi.org/10.1158/0008-5472.CAN-15-2841 [PubMed]
-
39.
Yu J, Ohuchida K, Mizumoto K, Fujita H, Nakata K, Tanaka M. MicroRNA miR-17-5p is overexpressed in pancreatic cancer, associated with a poor prognosis, and involved in cancer cell proliferation and invasion. Cancer Biol Ther. 2010; 10:748–57. https://doi.org/10.4161/cbt.10.8.13083 [PubMed]
-
40.
Gu J, Wang D, Zhang J, Zhu Y, Li Y, Chen H, Shi M, Wang X, Shen B, Deng X, Zhan Q, Wei G, Peng C. GFRα2 prompts cell growth and chemoresistance through down-regulating tumor suppressor gene PTEN via Mir-17-5p in pancreatic cancer. Cancer Lett. 2016; 380:434–41. https://doi.org/10.1016/j.canlet.2016.06.016 [PubMed]
-
41.
Zhu Y, Gu J, Li Y, Peng C, Shi M, Wang X, Wei G, Ge O, Wang D, Zhang B, Wu J, Zhong Y, Shen B, Chen H. MiR-17-5p enhances pancreatic cancer proliferation by altering cell cycle profiles via disruption of RBL2/E2F4-repressing complexes. Cancer Lett. 2018; 412:59–68. https://doi.org/10.1016/j.canlet.2017.09.044 [PubMed]
-
42.
Tan Y, Yin H, Zhang H, Fang J, Zheng W, Li D, Li Y, Cao W, Sun C, Liang Y, Zeng J, Zou H, Fu W, Yang X. Sp1-driven up-regulation of miR-19a decreases RHOB and promotes pancreatic cancer. Oncotarget. 2015; 6:17391–403. https://doi.org/10.18632/oncotarget.3975 [PubMed]
-
43.
Dillhoff M, Liu J, Frankel W, Croce C, Bloomston M. MicroRNA-21 is overexpressed in pancreatic cancer and a potential predictor of survival. J Gastrointest Surg. 2008; 12:2171–76. https://doi.org/10.1007/s11605-008-0584-x [PubMed]
-
44.
Giovannetti E, Funel N, Peters GJ, Del Chiaro M, Erozenci LA, Vasile E, Leon LG, Pollina LE, Groen A, Falcone A, Danesi R, Campani D, Verheul HM, Boggi U. MicroRNA-21 in pancreatic cancer: correlation with clinical outcome and pharmacologic aspects underlying its role in the modulation of gemcitabine activity. Cancer Res. 2010; 70:4528–38. https://doi.org/10.1158/0008-5472.CAN-09-4467 [PubMed]
-
45.
Hwang JH, Voortman J, Giovannetti E, Steinberg SM, Leon LG, Kim YT, Funel N, Park JK, Kim MA, Kang GH, Kim SW, Del Chiaro M, Peters GJ, Giaccone G. Identification of microRNA-21 as a biomarker for chemoresistance and clinical outcome following adjuvant therapy in resectable pancreatic cancer. PLoS One. 2010; 5:e10630. https://doi.org/10.1371/journal.pone.0010630 [PubMed]
-
46.
Jamieson NB, Morran DC, Morton JP, Ali A, Dickson EJ, Carter CR, Sansom OJ, Evans TR, McKay CJ, Oien KA. MicroRNA molecular profiles associated with diagnosis, clinicopathologic criteria, and overall survival in patients with resectable pancreatic ductal adenocarcinoma. Clin Cancer Res. 2012; 18:534–45. https://doi.org/10.1158/1078-0432.CCR-11-0679 [PubMed]
-
47.
Nagao Y, Hisaoka M, Matsuyama A, Kanemitsu S, Hamada T, Fukuyama T, Nakano R, Uchiyama A, Kawamoto M, Yamaguchi K, Hashimoto H. Association of microRNA-21 expression with its targets, PDCD4 and TIMP3, in pancreatic ductal adenocarcinoma. Mod Pathol. 2012; 25:112–21. https://doi.org/10.1038/modpathol.2011.142 [PubMed]
-
48.
Caponi S, Funel N, Frampton AE, Mosca F, Santarpia L, Van der Velde AG, Jiao LR, De Lio N, Falcone A, Kazemier G, Meijer GA, Verheul HM, Vasile E, et al. The good, the bad and the ugly: a tale of miR-101, miR-21 and miR-155 in pancreatic intraductal papillary mucinous neoplasms. Ann Oncol. 2013; 24:734–41. https://doi.org/10.1093/annonc/mds513 [PubMed]
-
49.
Kadera BE, Li L, Toste PA, Wu N, Adams C, Dawson DW, Donahue TR. MicroRNA-21 in pancreatic ductal adenocarcinoma tumor-associated fibroblasts promotes metastasis. PLoS One. 2013; 8:e71978. https://doi.org/10.1371/journal.pone.0071978 [PubMed]
-
50.
Ma MZ, Kong X, Weng MZ, Cheng K, Gong W, Quan ZW, Peng CH. Candidate microRNA biomarkers of pancreatic ductal adenocarcinoma: meta-analysis, experimental validation and clinical significance. J Exp Clin Cancer Res. 2013; 32:71. https://doi.org/10.1186/1756-9966-32-71 [PubMed]
-
51.
Papaconstantinou IG, Manta A, Gazouli M, Lyberopoulou A, Lykoudis PM, Polymeneas G, Voros D. Expression of microRNAs in patients with pancreatic cancer and its prognostic significance. Pancreas. 2013; 42:67–71. https://doi.org/10.1097/MPA.0b013e3182592ba7 [PubMed]
-
52.
Donahue TR, Nguyen AH, Moughan J, Li L, Tatishchev S, Toste P, Farrell JJ. Stromal microRNA-21 levels predict response to 5-fluorouracil in patients with pancreatic cancer. J Surg Oncol. 2014; 110:952–59. https://doi.org/10.1002/jso.23750 [PubMed]
-
53.
Frampton AE, Castellano L, Colombo T, Giovannetti E, Krell J, Jacob J, Pellegrino L, Roca-Alonso L, Funel N, Gall TM, De Giorgio A, Pinho FG, Fulci V, et al. MicroRNAs cooperatively inhibit a network of tumor suppressor genes to promote pancreatic tumor growth and progression. Gastroenterology. 2014; 146:268–77.e18. https://doi.org/10.1053/j.gastro.2013.10.010 [PubMed]
-
54.
Mitsuhashi K, Nosho K, Sukawa Y, Matsunaga Y, Ito M, Kurihara H, Kanno S, Igarashi H, Naito T, Adachi Y, Tachibana M, Tanuma T, Maguchi H, et al. Association of Fusobacterium species in pancreatic cancer tissues with molecular features and prognosis. Oncotarget. 2015; 6:7209–20. https://doi.org/10.18632/oncotarget.3109 [PubMed]
-
55.
Vychytilova-Faltejskova P, Kiss I, Klusova S, Hlavsa J, Prochazka V, Kala Z, Mazanec J, Hausnerova J, Kren L, Hermanova M, Lenz J, Karasek P, Vyzula R, Slaby O. MiR-21, miR-34a, miR-198 and miR-217 as diagnostic and prognostic biomarkers for chronic pancreatitis and pancreatic ductal adenocarcinoma. Diagn Pathol. 2015; 10:38. https://doi.org/10.1186/s13000-015-0272-6 [PubMed]
-
56.
Morinaga S, Nakamura Y, Atsumi Y, Murakawa M, Yamaoku K, Aoyama T, Kobayashi S, Ueno M, Morimoto M, Yokose T, Miyagi Y. Locked Nucleic Acid In Situ Hybridization Analysis of MicroRNA-21 Predicts Clinical Outcome in Patients After Resection for Pancreatic Cancer Treated with Adjuvant Gemcitabine Monotherapy. Anticancer Res. 2016; 36:1083–88. [PubMed]
-
57.
Benesova L, Halkova T, Bunganic B, Belsanova B, Zavoral M, Traboulsi E, Minarik M. Comparison of Native Aspirates and Cytological Smears Obtained by EUS-Guided Biopsies for Effective DNA/RNA Marker Testing in Pancreatic Cancer. Pathol Oncol Res. 2020; 26:379–85. https://doi.org/10.1007/s12253-018-0490-9 [PubMed]
-
58.
Xi J, Huang Q, Wang L, Ma X, Deng Q, Kumar M, Zhou Z, Li L, Zeng Z, Young KH, Zhang M, Li Y. miR-21 depletion in macrophages promotes tumoricidal polarization and enhances PD-1 immunotherapy. Oncogene. 2018; 37:3151–65. https://doi.org/10.1038/s41388-018-0178-3 [PubMed]
-
59.
Zhang Y, Zhang R, Ding X, Ai K. EFNB2 acts as the target of miR-557 to facilitate cell proliferation, migration and invasion in pancreatic ductal adenocarcinoma by bioinformatics analysis and verification. Am J Transl Res. 2018; 10:3514–28. [PubMed]
-
60.
Zhao Q, Chen S, Zhu Z, Yu L, Ren Y, Jiang M, Weng J, Li B. miR-21 promotes EGF-induced pancreatic cancer cell proliferation by targeting Spry2. Cell Death Dis. 2018; 9:1157. https://doi.org/10.1038/s41419-018-1182-9 [PubMed]
-
61.
Diao H, Ye Z, Qin R. miR-23a acts as an oncogene in pancreatic carcinoma by targeting FOXP2. J Investig Med. 2018; 66:676–83. https://doi.org/10.1136/jim-2017-000598 [PubMed]
-
62.
Wu G, Li Z, Jiang P, Zhang X, Xu Y, Chen K, Li X. MicroRNA-23a promotes pancreatic cancer metastasis by targeting epithelial splicing regulator protein 1. Oncotarget. 2017; 8:82854–71. https://doi.org/10.18632/oncotarget.20692 [PubMed]
-
63.
Zhang J, Bai R, Li M, Ye H, Wu C, Wang C, Li S, Tan L, Mai D, Li G, Pan L, Zheng Y, Su J, et al. Excessive miR-25-3p maturation via N6-methyladenosine stimulated by cigarette smoke promotes pancreatic cancer progression. Nat Commun. 2019; 10:1858. https://doi.org/10.1038/s41467-019-09712-x [PubMed]
-
64.
Deng J, He M, Chen L, Chen C, Zheng J, Cai Z. The loss of miR-26a-mediated post-transcriptional regulation of cyclin E2 in pancreatic cancer cell proliferation and decreased patient survival. PLoS One. 2013; 8:e76450. https://doi.org/10.1371/journal.pone.0076450 [PubMed]
-
65.
Liang C, Shi S, Meng Q, Liang D, Hua J, Qin Y, Zhang B, Xu J, Ni Q, Yu X. MiR-29a, targeting caveolin 2 expression, is responsible for limitation of pancreatic cancer metastasis in patients with normal level of serum CA125. Int J Cancer. 2018; 143:2919–31. https://doi.org/10.1002/ijc.31654 [PubMed]
-
66.
Li C, Dong Q, Che X, Xu L, Li Z, Fan Y, Hou K, Wang S, Qu J, Xu L, Wen T, Yang X, Qu X, Liu Y. MicroRNA-29b-2-5p inhibits cell proliferation by directly targeting Cbl-b in pancreatic ductal adenocarcinoma. BMC Cancer. 2018; 18:681. https://doi.org/10.1186/s12885-018-4526-z [PubMed]
-
67.
Sun Y, Wang P, Yang W, Shan Y, Zhang Q, Wu H. The role of lncRNA MSC-AS1/miR-29b-3p axis-mediated CDK14 modulation in pancreatic cancer proliferation and Gemcitabine-induced apoptosis. Cancer Biol Ther. 2019; 20:729–39. https://doi.org/10.1080/15384047.2018.1529121 [PubMed]
-
68.
Liang L, Wei DM, Li JJ, Luo DZ, Chen G, Dang YW, Cai XY. Prognostic microRNAs and their potential molecular mechanism in pancreatic cancer: A study based on The Cancer Genome Atlas and bioinformatics investigation. Mol Med Rep. 2018; 17:939–51. https://doi.org/10.3892/mmr.2017.7945 [PubMed]
-
69.
Jiang J, Yu C, Chen M, Zhang H, Tian S, Sun C. Reduction of miR-29c enhances pancreatic cancer cell migration and stem cell-like phenotype. Oncotarget. 2015; 6:2767–78. https://doi.org/10.18632/oncotarget.3089 [PubMed]
-
70.
Zou Y, Li J, Chen Z, Li X, Zheng S, Yi D, Zhong A, Chen J. miR-29c suppresses pancreatic cancer liver metastasis in an orthotopic implantation model in nude mice and affects survival in pancreatic cancer patients. Carcinogenesis. 2015; 36:676–84. https://doi.org/10.1093/carcin/bgv027 [PubMed]
-
71.
Zhang ZL, Bai ZH, Wang XB, Bai L, Miao F, Pei HH. miR-186 and 326 predict the prognosis of pancreatic ductal adenocarcinoma and affect the proliferation and migration of cancer cells. PLoS One. 2015; 10:e0118814. https://doi.org/10.1371/journal.pone.0118814 [PubMed]
-
72.
Xiong Y, Wang Y, Wang L, Huang Y, Xu Y, Xu L, Guo Y, Lu J, Li X, Zhu M, Qian H. MicroRNA-30b targets Snail to impede epithelial-mesenchymal transition in pancreatic cancer stem cells. J Cancer. 2018; 9:2147–59. https://doi.org/10.7150/jca.25006 [PubMed]
-
73.
Sun Z, Zhang B, Cui T. Long non-coding RNA XIST exerts oncogenic functions in pancreatic cancer via miR-34a-5p. Oncol Rep. 2018; 39:1591–600. https://doi.org/10.3892/or.2018.6245 [PubMed]
-
74.
Liu C, Cheng H, Shi S, Cui X, Yang J, Chen L, Cen P, Cai X, Lu Y, Wu C, Yao W, Qin Y, Liu L, et al. MicroRNA-34b inhibits pancreatic cancer metastasis through repressing Smad3. Curr Mol Med. 2013; 13:467–78. https://doi.org/10.2174/1566524011313040001 [PubMed]
-
75.
Long M, Zhan M, Xu S, Yang R, Chen W, Zhang S, Shi Y, He Q, Mohan M, Liu Q, Wang J. miR-92b-3p acts as a tumor suppressor by targeting Gabra3 in pancreatic cancer. Mol Cancer. 2017; 16:167. https://doi.org/10.1186/s12943-017-0723-7 [PubMed]
-
76.
Li C, Du X, Tai S, Zhong X, Wang Z, Hu Z, Zhang L, Kang P, Ji D, Jiang X, Zhou Q, Wan M, Jiang G, Cui Y. GPC1 regulated by miR-96-5p, rather than miR-182-5p, in inhibition of pancreatic carcinoma cell proliferation. Int J Mol Sci. 2014; 15:6314–27. https://doi.org/10.3390/ijms15046314 [PubMed]
-
77.
Ottaviani S, Stebbing J, Frampton AE, Zagorac S, Krell J, de Giorgio A, Trabulo SM, Nguyen VT, Magnani L, Feng H, Giovannetti E, Funel N, Gress TM, et al. TGF-β induces miR-100 and miR-125b but blocks let-7a through LIN28B controlling PDAC progression. Nat Commun. 2018; 9:1845. https://doi.org/10.1038/s41467-018-03962-x [PubMed]
-
78.
Jiang W, Gu W, Qiu R, He S, Shen C, Wu Y, Zhang J, Zhou J, Guo Y, Wan D, Li Z, Deng J, Zeng L, et al. miRNA-101 Suppresses Epithelial-to-Mesenchymal Transition by Targeting HMGA2 in Pancreatic Cancer Cells. Anticancer Agents Med Chem. 2016; 16:432–39. https://doi.org/10.2174/1871520615666150507122142 [PubMed]
-
79.
Xu L, Yuan X, Ni J, Shen L, Cai M, Jiang D. Gain of microRNA-103 triggers metastatic behavior by targeting ubiquitin specific peptidase 10 in pancreatic cancer. Int J Clin Exp Pathol. 2019; 12:1214–23. [PubMed]
-
80.
Xiong J, Wang D, Wei A, Lu H, Tan C, Li A, Tang J, Wang Y, He S, Liu X, Hu W. Deregulated expression of miR-107 inhibits metastasis of PDAC through inhibition PI3K/Akt signaling via caveolin-1 and PTEN. Exp Cell Res. 2017; 361:316–23. https://doi.org/10.1016/j.yexcr.2017.10.033 [PubMed]
-
81.
Wang P, Chen L, Zhang J, Chen H, Fan J, Wang K, Luo J, Chen Z, Meng Z, Liu L. Methylation-mediated silencing of the miR-124 genes facilitates pancreatic cancer progression and metastasis by targeting Rac1. Oncogene. 2014; 33:514–24. https://doi.org/10.1038/onc.2012.598 [PubMed]
-
82.
Yu Y, Feng X, Cang S. A two-microRNA signature as a diagnostic and prognostic marker of pancreatic adenocarcinoma. Cancer Manag Res. 2018; 10:1507–15. https://doi.org/10.2147/CMAR.S158712 [PubMed]
-
83.
Zhao G, Zhang JG, Shi Y, Qin Q, Liu Y, Wang B, Tian K, Deng SC, Li X, Zhu S, Gong Q, Niu Y, Wang CY. MiR-130b is a prognostic marker and inhibits cell proliferation and invasion in pancreatic cancer through targeting STAT3. PLoS One. 2013; 8:e73803. https://doi.org/10.1371/journal.pone.0073803 [PubMed]
-
84.
Chen Y, Zhu H, Wang Y, Song Y, Zhang P, Wang Z, Gao J, Li Z, Du Y. MicroRNA-132 Plays an Independent Prognostic Role in Pancreatic Ductal Adenocarcinoma and Acts as a Tumor Suppressor. Technol Cancer Res Treat. 2019; 18:1533033818824314. https://doi.org/10.1177/1533033818824314 [PubMed]
-
85.
Qin Y, Dang X, Li W, Ma Q. miR-133a functions as a tumor suppressor and directly targets FSCN1 in pancreatic cancer. Oncol Res. 2013; 21:353–63. https://doi.org/10.3727/096504014X14024160459122 [PubMed]
-
86.
Han X, Saiyin H, Zhao J, Fang Y, Rong Y, Shi C, Lou W, Kuang T. Overexpression of miR-135b-5p promotes unfavorable clinical characteristics and poor prognosis via the repression of SFRP4 in pancreatic cancer. Oncotarget. 2017; 8:62195–207. https://doi.org/10.18632/oncotarget.19150 [PubMed]
-
87.
Zhang Z, Che X, Yang N, Bai Z, Wu Y, Zhao L, Pei H. miR-135b-5p Promotes migration, invasion and EMT of pancreatic cancer cells by targeting NR3C2. Biomed Pharmacother. 2017; 96:1341–48. https://doi.org/10.1016/j.biopha.2017.11.074 [PubMed]
-
88.
Jiang W, Zhao S, Shen J, Guo L, Sun Y, Zhu Y, Ma Z, Zhang X, Hu Y, Xiao W, Li K, Li S, Zhou L, et al. The MiR-135b-BMAL1-YY1 loop disturbs pancreatic clockwork to promote tumourigenesis and chemoresistance. Cell Death Dis. 2018; 9:149. https://doi.org/10.1038/s41419-017-0233-y [PubMed]
-
89.
Ding F, Zhang S, Gao S, Shang J, Li Y, Cui N, Zhao Q. MiR-137 functions as a tumor suppressor in pancreatic cancer by targeting MRGBP. J Cell Biochem. 2018; 119:4799–807. https://doi.org/10.1002/jcb.26676 [PubMed]
-
90.
Ma J, Zhang J, Weng YC, Wang JC. EZH2-Mediated microRNA-139-5p Regulates Epithelial-Mesenchymal Transition and Lymph Node Metastasis of Pancreatic Cancer. Mol Cells. 2018; 41:868–80. https://doi.org/10.14348/molcells.2018.0109 [PubMed]
-
91.
Pei YF, Yin XM, Liu XQ. TOP2A induces malignant character of pancreatic cancer through activating β-catenin signaling pathway. Biochim Biophys Acta Mol Basis Dis. 2018; 1864:197–207. https://doi.org/10.1016/j.bbadis.2017.10.019 [PubMed]
-
92.
Zhao G, Wang B, Liu Y, Zhang JG, Deng SC, Qin Q, Tian K, Li X, Zhu S, Niu Y, Gong Q, Wang CY. miRNA-141, downregulated in pancreatic cancer, inhibits cell proliferation and invasion by directly targeting MAP4K4. Mol Cancer Ther. 2013; 12:2569–80. https://doi.org/10.1158/1535-7163.MCT-13-0296 [PubMed]
-
93.
Zhu ZM, Xu YF, Su QJ, Du JD, Tan XL, Tu YL, Tan JW, Jiao HB. Prognostic significance of microRNA-141 expression and its tumor suppressor function in human pancreatic ductal adenocarcinoma. Mol Cell Biochem. 2014; 388:39–49. https://doi.org/10.1007/s11010-013-1897-y [PubMed]
-
94.
Godfrey JD, Morton JP, Wilczynska A, Sansom OJ, Bushell MD. MiR-142-3p is downregulated in aggressive p53 mutant mouse models of pancreatic ductal adenocarcinoma by hypermethylation of its locus. Cell Death Dis. 2018; 9:644. https://doi.org/10.1038/s41419-018-0628-4 [PubMed]
-
95.
Ohuchida K, Mizumoto K, Kayashima T, Fujita H, Moriyama T, Ohtsuka T, Ueda J, Nagai E, Hashizume M, Tanaka M. MicroRNA expression as a predictive marker for gemcitabine response after surgical resection of pancreatic cancer. Ann Surg Oncol. 2011; 18:2381–87. https://doi.org/10.1245/s10434-011-1602-x [PubMed]
-
96.
Zhao G, Zhang JG, Liu Y, Qin Q, Wang B, Tian K, Liu L, Li X, Niu Y, Deng SC, Wang CY. miR-148b functions as a tumor suppressor in pancreatic cancer by targeting AMPKα1. Mol Cancer Ther. 2013; 12:83–93. https://doi.org/10.1158/1535-7163.MCT-12-0534-T [PubMed]
-
97.
Yang K, He M, Cai Z, Ni C, Deng J, Ta N, Xu J, Zheng J. A decrease in miR-150 regulates the malignancy of pancreatic cancer by targeting c-Myb and MUC4. Pancreas. 2015; 44:370–79. https://doi.org/10.1097/MPA.0000000000000283 [PubMed]
-
98.
Bai Z, Sun J, Wang X, Wang H, Pei H, Zhang Z. MicroRNA-153 is a prognostic marker and inhibits cell migration and invasion by targeting SNAI1 in human pancreatic ductal adenocarcinoma. Oncol Rep. 2015; 34:595–602. https://doi.org/10.3892/or.2015.4051 [PubMed]
-
99.
Liu F, Liu B, Qian J, Wu G, Li J, Ma Z. miR-153 enhances the therapeutic effect of gemcitabine by targeting Snail in pancreatic cancer. Acta Biochim Biophys Sin (Shanghai). 2017; 49:520–29. https://doi.org/10.1093/abbs/gmx039 [PubMed]
-
100.
Chen M, Wang M, Xu S, Guo X, Jiang J. Upregulation of miR-181c contributes to chemoresistance in pancreatic cancer by inactivating the Hippo signaling pathway. Oncotarget. 2015; 6:44466–79. https://doi.org/10.18632/oncotarget.6298 [PubMed]
-
101.
Zhou L, Zhang WG, Wang DS, Tao KS, Song WJ, Dou KF. MicroRNA-183 is involved in cell proliferation, survival and poor prognosis in pancreatic ductal adenocarcinoma by regulating Bmi-1. Oncol Rep. 2014; 32:1734–40. https://doi.org/10.3892/or.2014.3374 [PubMed]
-
102.
Song Z, Ren H, Gao S, Zhao X, Zhang H, Hao J. The clinical significance and regulation mechanism of hypoxia-inducible factor-1 and miR-191 expression in pancreatic cancer. Tumour Biol. 2014; 35:11319–28. https://doi.org/10.1007/s13277-014-2452-5 [PubMed]
-
103.
Botla SK, Savant S, Jandaghi P, Bauer AS, Mücke O, Moskalev EA, Neoptolemos JP, Costello E, Greenhalf W, Scarpa A, Gaida MM, Büchler MW, Strobel O, et al. Early Epigenetic Downregulation of microRNA-192 Expression Promotes Pancreatic Cancer Progression. Cancer Res. 2016; 76:4149–59. https://doi.org/10.1158/0008-5472.CAN-15-0390 [PubMed]
-
104.
Zhou B, Sun C, Hu X, Zhan H, Zou H, Feng Y, Qiu F, Zhang S, Wu L, Zhang B. MicroRNA-195 Suppresses the Progression of Pancreatic Cancer by Targeting DCLK1. Cell Physiol Biochem. 2017; 44:1867–81. https://doi.org/10.1159/000485876 [PubMed]
-
105.
Bloomston M, Frankel WL, Petrocca F, Volinia S, Alder H, Hagan JP, Liu CG, Bhatt D, Taccioli C, Croce CM. MicroRNA expression patterns to differentiate pancreatic adenocarcinoma from normal pancreas and chronic pancreatitis. JAMA. 2007; 297:1901–08. https://doi.org/10.1001/jama.297.17.1901 [PubMed]
-
106.
Kanno S, Nosho K, Ishigami K, Yamamoto I, Koide H, Kurihara H, Mitsuhashi K, Shitani M, Motoya M, Sasaki S, Tanuma T, Maguchi H, Hasegawa T, et al. MicroRNA-196b is an independent prognostic biomarker in patients with pancreatic cancer. Carcinogenesis. 2017; 38:425–31. https://doi.org/10.1093/carcin/bgx013 [PubMed]
-
107.
Marin-Muller C, Li D, Bharadwaj U, Li M, Chen C, Hodges SE, Fisher WE, Mo Q, Hung MC, Yao Q. A tumorigenic factor interactome connected through tumor suppressor microRNA-198 in human pancreatic cancer. Clin Cancer Res. 2013; 19:5901–13. https://doi.org/10.1158/1078-0432.CCR-12-3776 [PubMed]
-
108.
Zhuo M, Yuan C, Han T, Cui J, Jiao F, Wang L. A novel feedback loop between high MALAT-1 and low miR-200c-3p promotes cell migration and invasion in pancreatic ductal adenocarcinoma and is predictive of poor prognosis. BMC Cancer. 2018; 18:1032. https://doi.org/10.1186/s12885-018-4954-9 [PubMed]
-
109.
Yu J, Ohuchida K, Mizumoto K, Sato N, Kayashima T, Fujita H, Nakata K, Tanaka M. MicroRNA, hsa-miR-200c, is an independent prognostic factor in pancreatic cancer and its upregulation inhibits pancreatic cancer invasion but increases cell proliferation. Mol Cancer. 2010; 9:169. https://doi.org/10.1186/1476-4598-9-169 [PubMed]
-
110.
Paik WH, Song BJ, Kim HW, Kim HR, Hwang JH. MicroRNA-200c as a Prognostic Biomarker for Pancreatic Cancer. Korean J Gastroenterol. 2015; 66:215–20. https://doi.org/10.4166/kjg.2015.66.4.215 [PubMed]
-
111.
Liu JP, Shang J, Kang Y, Mao CS, Ning HB, Ma C. Expression of microRNA-200c in human pancreatic ductal adenocarcinoma and its prognostic significance. Int J Clin Exp Pathol. 2016; 9:9455–60.
-
112.
Ikenaga N, Ohuchida K, Mizumoto K, Yu J, Kayashima T, Sakai H, Fujita H, Nakata K, Tanaka M. MicroRNA-203 expression as a new prognostic marker of pancreatic adenocarcinoma. Ann Surg Oncol. 2010; 17:3120–28. https://doi.org/10.1245/s10434-010-1188-8 [PubMed]
-
113.
Shao Y, Gu W, Ning Z, Song X, Pei H, Jiang J. Evaluating the Prognostic Value of microRNA-203 in Solid Tumors Based on a Meta-Analysis and the Cancer Genome Atlas (TCGA) Datasets. Cell Physiol Biochem. 2017; 41:1468–80. https://doi.org/10.1159/000470649 [PubMed]
-
114.
Shi XH, Li X, Zhang H, He RZ, Zhao Y, Zhou M, Pan ST, Zhao CL, Feng YC, Wang M, Guo XJ, Qin RY. A Five-microRNA Signature for Survival Prognosis in Pancreatic Adenocarcinoma based on TCGA Data. Sci Rep. 2018; 8:7638. https://doi.org/10.1038/s41598-018-22493-5 [PubMed]
-
115.
Ye ZH, Wen DY, Cai XY, Liang L, Wu PR, Qin H, Yang H, He Y, Chen G. The protective value of miR-204-5p for prognosis and its potential gene network in various malignancies: a comprehensive exploration based on RNA-seq high-throughput data and bioinformatics. Oncotarget. 2017; 8:104960–80. https://doi.org/10.18632/oncotarget.21950 [PubMed]
-
116.
Zhuang L, Guo J, Yao Y, Li Z. miR-205 targets runt-related transcription factor 2 to inhibit human pancreatic cancer progression. Oncol Lett. 2019; 17:843–48. https://doi.org/10.3892/ol.2018.9689 [PubMed]
-
117.
Giovannetti E, van der Velde A, Funel N, Vasile E, Perrone V, Leon LG, De Lio N, Avan A, Caponi S, Pollina LE, Gallá V, Sudo H, Falcone A, et al. High-throughput microRNA (miRNAs) arrays unravel the prognostic role of MiR-211 in pancreatic cancer. PLoS One. 2012; 7:e49145. https://doi.org/10.1371/journal.pone.0049145 [PubMed]
-
118.
Yue H, Liu L, Song Z. miR-212 regulated by HIF-1α promotes the progression of pancreatic cancer. Exp Ther Med. 2019; 17:2359–65. https://doi.org/10.3892/etm.2019.7213 [PubMed]
-
119.
You Y, Tan J, Gong Y, Dai H, Chen H, Xu X, Yang A, Zhang Y, Bie P. MicroRNA-216b-5p Functions as a Tumor-suppressive RNA by Targeting TPT1 in Pancreatic Cancer Cells. J Cancer. 2017; 8:2854–65. https://doi.org/10.7150/jca.18931 [PubMed]
-
120.
Wu X, Chen W, Cai H, Hu J, Wu B, Jiang Y, Chen X, Sun D, An Y. MiR-216b inhibits pancreatic cancer cell progression and promotes apoptosis by down-regulating KRAS.. Arch Med Sci. 2018; 14:1321–32. https://doi.org/10.5114/aoms.2018.72564 [PubMed]
-
121.
Li CH, To KF, Tong JH, Xiao Z, Xia T, Lai PB, Chow SC, Zhu YX, Chan SL, Marquez VE, Chen Y. Enhancer of zeste homolog 2 silences microRNA-218 in human pancreatic ductal adenocarcinoma cells by inducing formation of heterochromatin. Gastroenterology. 2013; 144:1086–1097.e9. https://doi.org/10.1053/j.gastro.2013.01.058 [PubMed]
-
122.
Zhu Z, Xu Y, Du J, Tan J, Jiao H. Expression of microRNA-218 in human pancreatic ductal adenocarcinoma and its correlation with tumor progression and patient survival. J Surg Oncol. 2014; 109:89–94. https://doi.org/10.1002/jso.23475 [PubMed]
-
123.
Li BS, Liu H, Yang WL. Reduced miRNA-218 expression in pancreatic cancer patients as a predictor of poor prognosis. Genet Mol Res. 2015; 14:16372–78. https://doi.org/10.4238/2015.December.9.5 [PubMed]
-
124.
Zhao L, Zou D, Wei X, Wang L, Zhang Y, Liu S, Si Y, Zhao H, Wang F, Yu J, Ma Y, Sun G. MiRNA-221-3p desensitizes pancreatic cancer cells to 5-fluorouracil by targeting RB1. Tumour Biol. 2016; 37:16053–63. https://doi.org/10.1007/s13277-016-5445-8 [PubMed]
-
125.
Sarkar S, Dubaybo H, Ali S, Goncalves P, Kollepara SL, Sethi S, Philip PA, Li Y. Down-regulation of miR-221 inhibits proliferation of pancreatic cancer cells through up-regulation of PTEN, p27(kip1), p57(kip2), and PUMA. Am J Cancer Res. 2013; 3:465–77. [PubMed]
-
126.
Wang J, Yang S, He P, Schetter AJ, Gaedcke J, Ghadimi BM, Ried T, Yfantis HG, Lee DH, Gaida MM, Hanna N, Alexander HR, Hussain SP. Endothelial Nitric Oxide Synthase Traffic Inducer (NOSTRIN) is a Negative Regulator of Disease Aggressiveness in Pancreatic Cancer. Clin Cancer Res. 2016; 22:5992–6001. https://doi.org/10.1158/1078-0432.CCR-16-0511 [PubMed]
-
127.
Lee C, He H, Jiang Y, Di Y, Yang F, Li J, Jin C, Fu D. Elevated expression of tumor miR-222 in pancreatic cancer is associated with Ki67 and poor prognosis. Med Oncol. 2013; 30:700. https://doi.org/10.1007/s12032-013-0700-y [PubMed]
-
128.
He D, Huang C, Zhou Q, Liu D, Xiong L, Xiang H, Ma G, Zhang Z. HnRNPK/miR-223/FBXW7 feedback cascade promotes pancreatic cancer cell growth and invasion. Oncotarget. 2017; 8:20165–78. https://doi.org/10.18632/oncotarget.15529 [PubMed]
-
129.
Xia X, Zhang K, Cen G, Jiang T, Cao J, Huang K, Huang C, Zhao Q, Qiu Z. MicroRNA-301a-3p promotes pancreatic cancer progression via negative regulation of SMAD4. Oncotarget. 2015; 6:21046–63. https://doi.org/10.18632/oncotarget.4124 [PubMed]
-
130.
Wang C, Liu P, Wu H, Cui P, Li Y, Liu Y, Liu Z, Gou S. MicroRNA-323-3p inhibits cell invasion and metastasis in pancreatic ductal adenocarcinoma via direct suppression of SMAD2 and SMAD3. Oncotarget. 2016; 7:14912–24. https://doi.org/10.18632/oncotarget.7482 [PubMed]
-
131.
Wang X, Lu X, Zhang T, Wen C, Shi M, Tang X, Chen H, Peng C, Li H, Fang Y, Deng X, Shen B. mir-329 restricts tumor growth by targeting grb2 in pancreatic cancer. Oncotarget. 2016; 7:21441–53. https://doi.org/10.18632/oncotarget.7375 [PubMed]
-
132.
Zhang R, Zheng S, Du Y, Wang Y, Zang W, Zhao G. Levels of HOXB7 and miR-337 in pancreatic ductal adenocarcinoma patients. Diagn Pathol. 2014; 9:61. https://doi.org/10.1186/1746-1596-9-61 [PubMed]
-
133.
Ma L, Fan Z, Du G, Wang H. Leptin-elicited miRNA-342-3p potentiates gemcitabine resistance in pancreatic ductal adenocarcinoma. Biochem Biophys Res Commun. 2019; 509:845–53. https://doi.org/10.1016/j.bbrc.2019.01.030 [PubMed]
-
134.
Hu J, Li L, Chen H, Zhang G, Liu H, Kong R, Chen H, Wang Y, Li Y, Tian F, Lv X, Li G, Sun B. MiR-361-3p regulates ERK1/2-induced EMT via DUSP2 mRNA degradation in pancreatic ductal adenocarcinoma. Cell Death Dis. 2018; 9:807. https://doi.org/10.1038/s41419-018-0839-8 [PubMed]
-
135.
Zhu Z, Xu Y, Zhao J, Liu Q, Feng W, Fan J, Wang P. miR-367 promotes epithelial-to-mesenchymal transition and invasion of pancreatic ductal adenocarcinoma cells by targeting the Smad7-TGF-β signalling pathway. Br J Cancer. 2015; 112:1367–75. https://doi.org/10.1038/bjc.2015.102 [PubMed]
-
136.
He D, Miao H, Xu Y, Xiong L, Wang Y, Xiang H, Zhang H, Zhang Z. MiR-371-5p facilitates pancreatic cancer cell proliferation and decreases patient survival. PLoS One. 2014; 9:e112930. https://doi.org/10.1371/journal.pone.0112930 [PubMed]
-
137.
Sun D, Wang X, Sui G, Chen S, Yu M, Zhang P. Downregulation of miR-374b-5p promotes chemotherapeutic resistance in pancreatic cancer by upregulating multiple anti-apoptotic proteins. Int J Oncol. 2018; 52:1491–503. https://doi.org/10.3892/ijo.2018.4315 [PubMed]
-
138.
Chang W, Liu M, Xu J, Fu H, Zhou B, Yuan T, Chen P. MiR-377 inhibits the proliferation of pancreatic cancer by targeting Pim-3. Tumour Biol. 2016; 37:14813–24. https://doi.org/10.1007/s13277-016-5295-4 [PubMed]
-
139.
Xiong J, Wang D, Wei A, Ke N, Wang Y, Tang J, He S, Hu W, Liu X. MicroRNA-410-3p attenuates gemcitabine resistance in pancreatic ductal adenocarcinoma by inhibiting HMGB1-mediated autophagy. Oncotarget. 2017; 8:107500–12. https://doi.org/10.18632/oncotarget.22494 [PubMed]
-
140.
Song B, Zheng K, Ma H, Liu A, Jing W, Shao C, Li G, Jin G. miR-429 determines poor outcome and inhibits pancreatic ductal adenocarcinoma growth by targeting TBK1. Cell Physiol Biochem. 2015; 35:1846–56. https://doi.org/10.1159/000373995 [PubMed]
-
141.
Yu DL, Zhang T, Wu K, Li Y, Wang J, Chen J, Li XQ, Peng XG, Wang JN, Tan LG. MicroRNA-448 suppresses metastasis of pancreatic ductal adenocarcinoma through targeting JAK1/STAT3 pathway. Oncol Rep. 2017; 38:1075–82. https://doi.org/10.3892/or.2017.5781 [PubMed]
-
142.
Guo R, Gu J, Zhang Z, Wang Y, Gu C. MiR-451 Promotes Cell Proliferation and Metastasis in Pancreatic Cancer through Targeting CAB39. Biomed Res Int. 2017; 2017:2381482. https://doi.org/10.1155/2017/2381482 [PubMed]
-
143.
Wang C, Sun Y, Wu H, Yu S, Zhang L, Meng Y, Liu M, Yang H, Liu P, Mao X, Lu Z, Chen J. Elevated miR-483-3p expression is an early event and indicates poor prognosis in pancreatic ductal adenocarcinoma. Tumour Biol. 2015; 36:9447–56. https://doi.org/10.1007/s13277-015-3690-x [PubMed]
-
144.
Li L, Li Z, Kong X, Xie D, Jia Z, Jiang W, Cui J, Du Y, Wei D, Huang S, Xie K. Down-regulation of microRNA-494 via loss of SMAD4 increases FOXM1 and β-catenin signaling in pancreatic ductal adenocarcinoma cells. Gastroenterology. 2014; 147:485–97.e18. https://doi.org/10.1053/j.gastro.2014.04.048 [PubMed]
-
145.
Liu Y, Li X, Zhu S, Zhang JG, Yang M, Qin Q, Deng SC, Wang B, Tian K, Liu L, Niu Y, Wang CY, Zhao G. Ectopic expression of miR-494 inhibited the proliferation, invasion and chemoresistance of pancreatic cancer by regulating SIRT1 and c-Myc. Gene Ther. 2015; 22:729–38. https://doi.org/10.1038/gt.2015.39 [PubMed]
-
146.
Ma YB, Li GX, Hu JX, Liu X, Shi BM. Correlation of miR-494 expression with tumor progression and patient survival in pancreatic cancer. Genet Mol Res. 2015; 14:18153–59. https://doi.org/10.4238/2015.December.23.2 [PubMed]
-
147.
Yang Y, Wang Y, Liu S, Zhao X, Jia R, Xiao Y, Zhang M, Li X, Li J, Wang W. How hsa-miR-495 performed in the tumorigenesis of pancreatic adenocarcinoma by bioinformatics analysis. J Cell Biochem. 2018. [Epub ahead of print]. https://doi.org/10.1002/jcb.28055 [PubMed]
-
148.
Xu J, Wang T, Cao Z, Huang H, Li J, Liu W, Liu S, You L, Zhou L, Zhang T, Zhao Y. MiR-497 downregulation contributes to the malignancy of pancreatic cancer and associates with a poor prognosis. Oncotarget. 2014; 5:6983–93. https://doi.org/10.18632/oncotarget.2184 [PubMed]
-
149.
Ling Q, Xu X, Ye P, Xie H, Gao F, Hu Q, Liu Z, Wei X, Röder C, Trauzold A, Kalthoff H, Zheng S. The prognostic relevance of primary tumor location in patients undergoing resection for pancreatic ductal adenocarcinoma. Oncotarget. 2017; 8:15159–67. https://doi.org/10.18632/oncotarget.14768 [PubMed]
-
150.
Li J, Wu H, Li W, Yin L, Guo S, Xu X, Ouyang Y, Zhao Z, Liu S, Tian Y, Tian Z, Ju J, Ni B, Wang H. Downregulated miR-506 expression facilitates pancreatic cancer progression and chemoresistance via SPHK1/Akt/NF-κB signaling. Oncogene. 2016; 35:5501–14. https://doi.org/10.1038/onc.2016.90 [PubMed]
-
151.
Hiramoto H, Muramatsu T, Ichikawa D, Tanimoto K, Yasukawa S, Otsuji E, Inazawa J. miR-509-5p and miR-1243 increase the sensitivity to gemcitabine by inhibiting epithelial-mesenchymal transition in pancreatic cancer. Sci Rep. 2017; 7:4002. https://doi.org/10.1038/s41598-017-04191-w [PubMed]
-
152.
Yu H, Song H, Ma Z, Ji W. Down-regulation of miR-539 indicates poor prognosis in patients with pancreatic cancer. Open Life Sci. 2018; 13:497–503. https://doi.org/10.1515/biol-2018-0059
-
153.
Song B, Ji W, Guo S, Liu A, Jing W, Shao C, Li G, Jin G. miR-545 inhibited pancreatic ductal adenocarcinoma growth by targeting RIG-I. FEBS Lett. 2014; 588:4375–81. https://doi.org/10.1016/j.febslet.2014.10.004 [PubMed]
-
154.
Zhu S, He C, Deng S, Li X, Cui S, Zeng Z, Liu M, Zhao S, Chen J, Jin Y, Chen H, Deng S, Liu Y, et al. MiR-548an, Transcriptionally Downregulated by HIF1α/HDAC1, Suppresses Tumorigenesis of Pancreatic Cancer by Targeting Vimentin Expression. Mol Cancer Ther. 2016; 15:2209–19. https://doi.org/10.1158/1535-7163.MCT-15-0877 [PubMed]
-
155.
Cai H, Yao J, An Y, Chen X, Chen W, Wu D, Luo B, Yang Y, Jiang Y, Sun D, He X. LncRNA HOTAIR acts a competing endogenous RNA to control the expression of notch3 via sponging miR-613 in pancreatic cancer. Oncotarget. 2017; 8:32905–17. https://doi.org/10.18632/oncotarget.16462 [PubMed]
-
156.
Sun Y, Zhang T, Wang C, Jin X, Jia C, Yu S, Chen J. MiRNA-615-5p functions as a tumor suppressor in pancreatic ductal adenocarcinoma by targeting AKT2. PLoS One. 2015; 10:e0119783. https://doi.org/10.1371/journal.pone.0119783 [PubMed]
-
157.
Lv F, Zheng K, Yu J, Huang Z. MicroRNA-661 expression is upregulated in pancreatic ductal adenocarcinoma and promotes cell proliferation. Oncol Lett. 2018; 16:6293–98. https://doi.org/10.3892/ol.2018.9454 [PubMed]
-
158.
Zang W, Wang Y, Wang T, Du Y, Chen X, Li M, Zhao G. miR-663 attenuates tumor growth and invasiveness by targeting eEF1A2 in pancreatic cancer. Mol Cancer. 2015; 14:37. https://doi.org/10.1186/s12943-015-0315-3 [PubMed]
-
159.
Wang Q, Wang J, Niu S, Wang S, Liu Y, Wang X. MicroRNA-664 targets paired box protein 6 to inhibit the oncogenicity of pancreatic ductal adenocarcinoma. Int J Oncol. 2019; 54:1884–96. https://doi.org/10.3892/ijo.2019.4759 [PubMed]
-
160.
Wang J, Zhang Y, Wei H, Zhang X, Wu Y, Gong A, Xia Y, Wang W, Xu M. The mir-675-5p regulates the progression and development of pancreatic cancer via the UBQLN1-ZEB1-mir200 axis. Oncotarget. 2017; 8:24978–87. https://doi.org/10.18632/oncotarget.15330 [PubMed]
-
161.
Huang S, Guo H, Cao Y, Xiong J. MiR-708-5p inhibits the progression of pancreatic ductal adenocarcinoma by targeting Sirt3. Pathol Res Pract. 2019; 215:794–800. https://doi.org/10.1016/j.prp.2019.01.026 [PubMed]
-
162.
Zhou W, Li Y, Gou S, Xiong J, Wu H, Wang C, Yan H, Liu T. MiR-744 increases tumorigenicity of pancreatic cancer by activating Wnt/β-catenin pathway. Oncotarget. 2015; 6:37557–69. https://doi.org/10.18632/oncotarget.5317 [PubMed]
-
163.
Dong Q, Li C, Che X, Qu J, Fan Y, Li X, Li Y, Wang Q, Liu Y, Yang X, Qu X. MicroRNA-891b is an independent prognostic factor of pancreatic cancer by targeting Cbl-b to suppress the growth of pancreatic cancer cells. Oncotarget. 2016; 7:82338–53. https://doi.org/10.18632/oncotarget.11001 [PubMed]
-
164.
Song B, Zhang C, Li G, Jin G, Liu C. MiR-940 inhibited pancreatic ductal adenocarcinoma growth by targeting MyD88. Cell Physiol Biochem. 2015; 35:1167–77. https://doi.org/10.1159/000373941 [PubMed]
-
165.
Jiang J, Li Z, Yu C, Chen M, Tian S, Sun C. MiR-1181 inhibits stem cell-like phenotypes and suppresses SOX2 and STAT3 in human pancreatic cancer. Cancer Lett. 2015 (2 Pt B); 356:962–70. https://doi.org/10.1016/j.canlet.2014.11.007 [PubMed]
-
166.
Hasegawa S, Eguchi H, Nagano H, Konno M, Tomimaru Y, Wada H, Hama N, Kawamoto K, Kobayashi S, Nishida N, Koseki J, Nishimura T, Gotoh N, et al. MicroRNA-1246 expression associated with CCNG2-mediated chemoresistance and stemness in pancreatic cancer. Br J Cancer. 2014; 111:1572–80. https://doi.org/10.1038/bjc.2014.454 [PubMed]
-
167.
Shi S, Lu Y, Qin Y, Li W, Cheng H, Xu Y, Xu J, Long J, Liu L, Liu C, Yu X. miR-1247 is correlated with prognosis of pancreatic cancer and inhibits cell proliferation by targeting neuropilins. Curr Mol Med. 2014; 14:316–27. https://doi.org/10.2174/1566524014666140228120014 [PubMed]
-
168.
Zhang X, Ren D, Wu X, Lin X, Ye L, Lin C, Wu S, Zhu J, Peng X, Song L. miR-1266 Contributes to Pancreatic Cancer Progression and Chemoresistance by the STAT3 and NF-κB Signaling Pathways. Mol Ther Nucleic Acids. 2018; 11:142–58. https://doi.org/10.1016/j.omtn.2018.01.004 [PubMed]
-
169.
Yang RM, Zhan M, Xu SW, Long MM, Yang LH, Chen W, Huang S, Liu Q, Zhou J, Zhu J, Wang J. miR-3656 expression enhances the chemosensitivity of pancreatic cancer to gemcitabine through modulation of the RHOF/EMT axis. Cell Death Dis. 2017; 8:e3129. https://doi.org/10.1038/cddis.2017.530 [PubMed]
-
170.
Siegel R, Naishadham D, Jemal A. Cancer statistics, 2012. CA Cancer J Clin. 2012; 62:10–29. https://doi.org/10.3322/caac.20138 [PubMed]
-
171.
Hidalgo M. Pancreatic cancer. N Engl J Med. 2010; 362:1605–17. https://doi.org/10.1056/NEJMra0901557 [PubMed]
-
172.
Rhim AD, Mirek ET, Aiello NM, Maitra A, Bailey JM, McAllister F, Reichert M, Beatty GL, Rustgi AK, Vonderheide RH, Leach SD, Stanger BZ. EMT and dissemination precede pancreatic tumor formation. Cell. 2012; 148:349–61. https://doi.org/10.1016/j.cell.2011.11.025 [PubMed]
-
173.
Benjamini Y, Hochberg Y. Controlling the false discovery rate: a practical and powerful approach to multiple testing. J R Stat Soc. 1995; 57:289–300. https://doi.org/10.1111/j.2517-6161.1995.tb02031.x
-
174.
Ma S, Huang J. Regularized gene selection in cancer microarray meta-analysis. BMC Bioinformatics 2009; 10:1. https://doi.org/10.1186/1471-2105-10-1 [PubMed]
-
175.
Harsha HC, Kandasamy K, Ranganathan P, Rani S, Ramabadran S, Gollapudi S, Balakrishnan L, Dwivedi SB, Telikicherla D, Selvan LD, Goel R, Mathivanan S, Marimuthu A, et al. A compendium of potential biomarkers of pancreatic cancer. PLoS Med. 2009; 6:e1000046. https://doi.org/10.1371/journal.pmed.1000046 [PubMed]
-
176.
Grützmann R, Boriss H, Ammerpohl O, Lüttges J, Kalthoff H, Schackert HK, Klöppel G, Saeger HD, Pilarsky C. Meta-analysis of microarray data on pancreatic cancer defines a set of commonly dysregulated genes. Oncogene. 2005; 24:5079–88. https://doi.org/10.1038/sj.onc.1208696 [PubMed]
-
177.
Kanehisa M, Goto S, Furumichi M, Tanabe M, Hirakawa M. KEGG for representation and analysis of molecular networks involving diseases and drugs. Nucleic Acids Res. 2010 (suppl_1); 38:D355–60. https://doi.org/10.1093/nar/gkp896 [PubMed]
-
178.
Zhang Y, Guan DH, Bi RX, Xie J, Yang CH, Jiang YH. Prognostic value of microRNAs in gastric cancer: a meta-analysis. Oncotarget. 2017; 8:55489–510. https://doi.org/10.18632/oncotarget.18590 [PubMed]
-
179.
Gao S, Zhao ZY, Zhang ZY, Zhang Y, Wu R. Prognostic Value of MicroRNAs in Esophageal Carcinoma: A Meta-Analysis. Clin Transl Gastroenterol. 2018; 9:203. https://doi.org/10.1038/s41424-018-0070-z [PubMed]
-
180.
Stang A. Critical evaluation of the Newcastle-Ottawa scale for the assessment of the quality of nonrandomized studies in meta-analyses. Eur J Epidemiol. 2010; 25:603–05. https://doi.org/10.1007/s10654-010-9491-z [PubMed]
-
181.
Wong WC, Cheung CS, Hart GJ. Development of a quality assessment tool for systematic reviews of observational studies (QATSO) of HIV prevalence in men having sex with men and associated risk behaviours. Emerg Themes Epidemiol. 2008; 5:23. https://doi.org/10.1186/1742-7622-5-23 [PubMed]