


Introduction
As of May 25, 2020, more than 5.5 million CoVID-19 cases and about340,000 deaths have been reported from almost every country and territory around the globe [1, 2]. The ongoing CoVID-19 pandemic has imposed a substantial burden on health systems, economies, and societies globally, and there are strong indicators pointing to a disproportionate impact on low- and middle-income countries [3–5]. Since its initial outbreak in China, the world has tracked the CoVID-19 pandemic proliferating across Europe and Asia, and later seeding hotspots in North America, the Middle East, and more recently in Latin America [6]. Brazil reported its first case on February 26, 2020 [7]. Neighboring countries started to report CoVID-19 cases in subsequent days; South America has registered more than 600,000 cases and 30,600 deaths as of May 24, 2020 [1]. Although many South American countries imposed strict control measures, including travel bans, school closures, and lockdowns early in the epidemic, the magnitude of their epidemics now rival those observed in European hotspots, with CoVID-19 cases and death counts increasing rapidly in the region [1, 5]. Other factors, including high poverty rates, informal economies, frail healthcare systems, insufficient medical supplies as well as inadequate water, sanitation, and hygiene infrastructure further exacerbate the health and socioeconomic impacts of the CoVID-19 pandemic [5, 8–10]. Governments in South America are now facing the social and economic consequences from SARS-COV-2 containment measures, while struggling to contain the rapidly expanding outbreaks of the deadly virus [9].
Peru, a country of about 30 million people, is experiencing one of the largest CoVID-19 epidemics in Latin America. With a rapidly rising case tally, Peru has reported almost 129,148 cases and 7660 deaths as of May 25, 2020 [11]. The majority (63%) of CoVID-19 cases have been confirmed in Lima, the capital of Peru [11]. The government of Peru initiated social distancing measures soon after the confirmation of the first imported case in Peru on March 6, 2020 [12]. The initial epidemic control measures included school closures on March 11, 2020 followed by the suspension of large gatherings and flights from Europe and Asia the next day. Subsequently the government declared a national emergency and closed its borders on March 16, 2020 [13]. Despite these forthcoming and swift control measures, untraced community transmission was reported by March 17, 2020, forcing the implementation of a night time curfew as of March 18, 2020 [13].
Estimates of the reproduction number from the early stage of the epidemic in Peru (March 2020) showed sustained transmission in Lima with a reproduction number R estimated at 2.3 (95% CI: 2.0, 2.5) [14]. Moreover, the 20-days ahead forecast for Lima suggested that the prompt social distancing measures had significantly slowed down the initial spread of the virus in the region [14]. Despite the implementation of non-pharmaceutical interventions in Peru, case and death counts have continued to rise rapidly. The crude case fatality risk (CFR), defined as the number of cumulative deaths and cases as of May 25, 2020, in Peru is estimated at 5.9%, which is in good agreement with the global crude CFR average of 6.3% [15]. Statistical analyses and mathematical models using data from Peru suggest that under current epidemic growth trends, the number of CoVID-19 infected individuals could surpass the country’s healthcare system capacity [16].
The clinical spectrum of CoVID-19 ranges from asymptomatic cases to clinical conditions characterized by respiratory failure, to multiorgan and systemic manifestations which can cause death [17–19]. The SARS-CoV-2 virus is more likely to generate severe disease among individuals ≥60 years of age, especially those with preexisting medical conditions that include heart disease, lung disease, diabetes or cancer [20]. Further, CoVID-19 associated deaths occur more frequently (about 80% of total deaths) in persons aged ≥65 years based on data from the USA, and consistent with data from China indicating that >80% CoVID-19 deaths occur among persons aged ≥60 years [21]. Moreover, a higher crude fatality risk has been reported among men (2.8% for men versus 1.7% for women) in China [22]. Age adjusted CFR estimates from Peru can be useful to gauge the mortality impact of the pandemic and assess whether the severity patterns are consistent in the South America, a region with fragmented health systems, vast inequality, and high poverty rates.
CFR is a key epidemiological metric that quantifies the severity of an epidemic [23], aiding public health officials assess the type and intensity of interventions that need to be implemented to mitigate its impact [24]. However, it becomes challenging to estimate CFR during an epidemic as CFR estimates are sensitive to right censoring of the data that occurs because of the time lag between the symptoms onset and death [25–27]. Moreover, under-reporting of cases because mild or asymptomatic cases can go undetected by disease surveillance systems also overestimates CFR [25, 28], while CFR estimates by subgroup are less prone to sampling bias and help identify the most vulnerable subpopulations. For comparison, the infection fatality risk (IFR) is calculated by the ratio of cumulative deaths over the cumulative number of infected individuals.
Given the importance of timely CFR estimates for public health decision making, we provide real-time estimates of adjusted age-specific CFR during the CoVID-19 epidemic in Peru, through May 25, 2020 to assess the pandemic’s severity variation in this southern hemisphere setting, which helps pinpoint the most vulnerable segments of the population and tailor public health interventions.
Results
As of May 25, a total of 129,148 cases and 7,660 deaths due to CoVID-19 have been reported by the Ministry of Health, Peru. Among men, reported cases were mostly observed among individuals aged 30-39 years (23.1%), followed by those aged 40-49 years (20.8%), and those aged 20-29 years (18.3%). In contrast, most deaths were reported among those aged 50 years and above, especially among men aged 60-69 (29.3%) followed by those aged 70-79 (23.2%), aged 50-59 years (20.1%), and aged 80 years and above (14.3%). (Table 1, Figure 1A, 1B). Data show a similar pattern for women. The majority of reported cases occur in females aged 20-69 years, and the majority of reported deaths occur among women aged 50 years or more. More specifically, most reported cases occur among women aged 30-39 (22.6%), followed by women aged 40-49 (19.7%), and 50-59 year olds (16.0%). In contrast, most deaths are reported among those aged 60-69 (30.2%), followed by women aged 70-79 (25.9%), and lastly, women aged 80 years and above (18.4%). Regarding CoVID-19 mortality per 100,000 population, seniors (individuals >70 years of age) were the most affected age group; mortality burden per 100,000 is 279.2 among men aged 80 years and above, and 207.6 among men aged 70-79 years. For women of 80 years of age or more mortality is 108.8 and 85.1 for women aged 70-79 years (Table 1, Figure 1F).
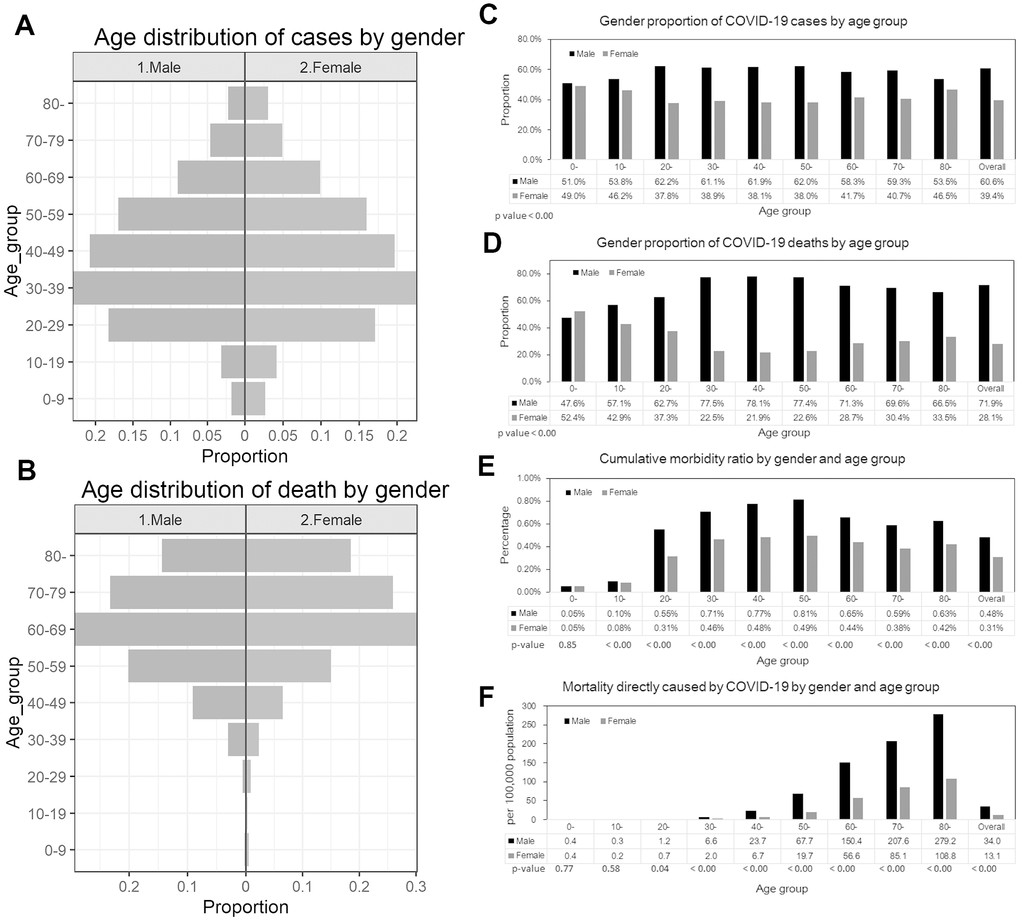
Figure 1. Epidemiological characterization of CoVID-19 in Peru, as of May 25, 2020. (A) Age distribution of reported cases by gender, (B) Age distribution of reported deaths by gender. (C) Gender proportion of CoVID-19 cases by age group, (D) Gender proportion of CoVID-19 deaths by age group, (E) Cumulative morbidity risk by gender and age group, (F) Mortality directly caused by CoVID-19 by gender and age group.
Table 1. Distribution of the cases by sex and age groups, as of May 25, 2020.
| Age group | Men | Women | |||||||
| Cases (%) | Deaths (%) | cCFR (%) | Mortality per 100,000 population | Cases (%) | Deaths (%) | cCFR(%) | Mortality per 100,000 population | ||
| All | 78264 | 5508 | 7.0% | 34.0 | 50884 | 2152 | 4.2 | 13.1 | |
| (100) | (100) | (100) | (100) | ||||||
| 0-9 | 1416 | 10 | 0.7 | 0.4 | 1362 | 11 | 0.8 | 0.4 | |
| (1.8) | (0.2) | (2.7) | (0.5) | ||||||
| 10-19 | 2475 | 8 | 0.3 | 0.3 | 2128 | 6 | 0.3 | 0.2 | |
| (3.2) | (0.1) | (4.2) | (0.3) | ||||||
| 20-29 | 14306 | 32 | 0.2 | 1.2 | 8707 | 19 | 0.2 | 0.7 | |
| (18.3) | (0.6) | (17.1) | (0.9) | ||||||
| 30-39 | 18052 | 169 | 0.9 | 6.6 | 11487 | 49 | 0.4 | 2.0 | |
| (23.1) | (3.1) | (22.6) | (2.3) | ||||||
| 40-49 | 16258 | 499 | 3.1 | 23.7 | 10005 | 140 | 1.4 | 6.7 | |
| (20.8) | (9.1) | (19.7) | (6.5) | ||||||
| 50-59 | 13274 | 1107 | 8.3 | 67.7 | 8124 | 323 | 4.0 | 19.7 | |
| (17.0) | (20.1) | (16.0) | (15.0) | ||||||
| 60-69 | 7034 | 1615 | 23.0 | 150.4 | 5023 | 649 | 12.9 | 56.6 | |
| (9.0) | (29.3) | (9.9) | (30.2) | ||||||
| 70-79 | 3620 | 1279 | 35.3 | 207.6 | 2488 | 558 | 22.4 | 85.1 | |
| (4.6) | (23.2) | (4.9) | (25.9) | ||||||
| 80 - | 1769 | 789 | 44.6 | 279.2 | 1536 | 397 | 25.8 | 108.8 | |
| (2.3) | (14.3) | (3.0) | (18.4) | ||||||
The gender proportions of reported cases by age groups are presented in Figure 1C and Figure 1D. The proportion of cases among men is higher than 50% across all age groups (χ2 test, p-value<0.001). Similarly, the proportion of male deaths is also higher than 50% except for those aged 10-19 years (χ2 test, p-value<0.001). Cumulative morbidity ratio by gender and age group is presented in Figure 1E, indicating that cumulative morbidity ratio among men is higher than women across all age groups (proportion test, p-value < 0.001) except for individuals aged 0-9 years (proportion test, p-value =0.85). Figure 1F illustrates the mortality per 100,000 population directly caused by CoVID-19 by gender and age group. Mortality is higher than among females aged 20 years and above (proportion test, p-value <0.05), and it is not significantly different among those aged 0-19 years.
Figure 2 shows the cumulative cases and deaths of CoVID-19 by age group for males and females (A through J) over time. The figure suggests cumulative deaths increases after an increase in cumulative cases. The growth curve for overall cumulative cases (all age groups) for men and women appears to increase exponentially until around day 60 (April 29th, 2020), while exponential growth in cumulative deaths overall (all age groups) for men and women appears to occur until around day 70 (May 9th, 2020).
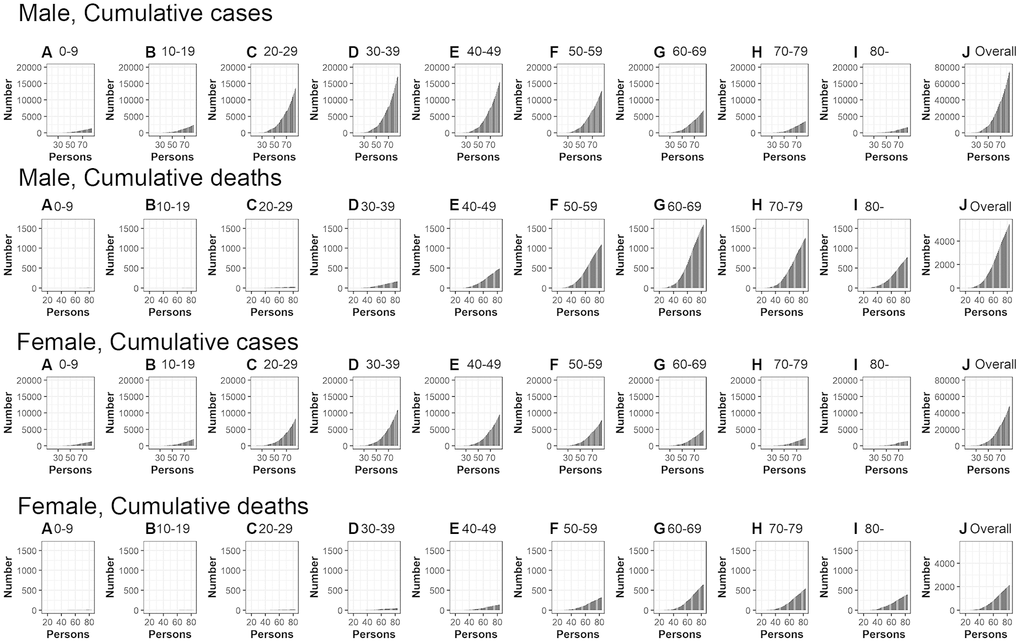
Figure 2. Temporal distribution of cases and deaths by age group due to CoVID-19, March-May 2020, Peru. Top: Male, cumulative cases, Second top: Male, cumulative cases, Second bottom: Female, cumulative cases, Bottom: Female cumulative deaths (A) aged 0-9, (B) aged 10-19, (C) aged 20-29, (D) aged 30-39, (E) aged 40-49, (F) aged 50-59, (G) aged 60-69, (H) aged 70-79, (I) aged 80- and (J) Overall (all age groups). Day 1 corresponds to March 1st in 2020.
Figure 3 illustrates observed and model based posterior estimates of the crude CFR by age group (A-J) and time-delay adjusted CFR by age group (K-T) for men and women. Black dots show crude case fatality risks, and light and dark indicate 95% and 50% credible intervals (CrI) for posterior estimates, respectively.
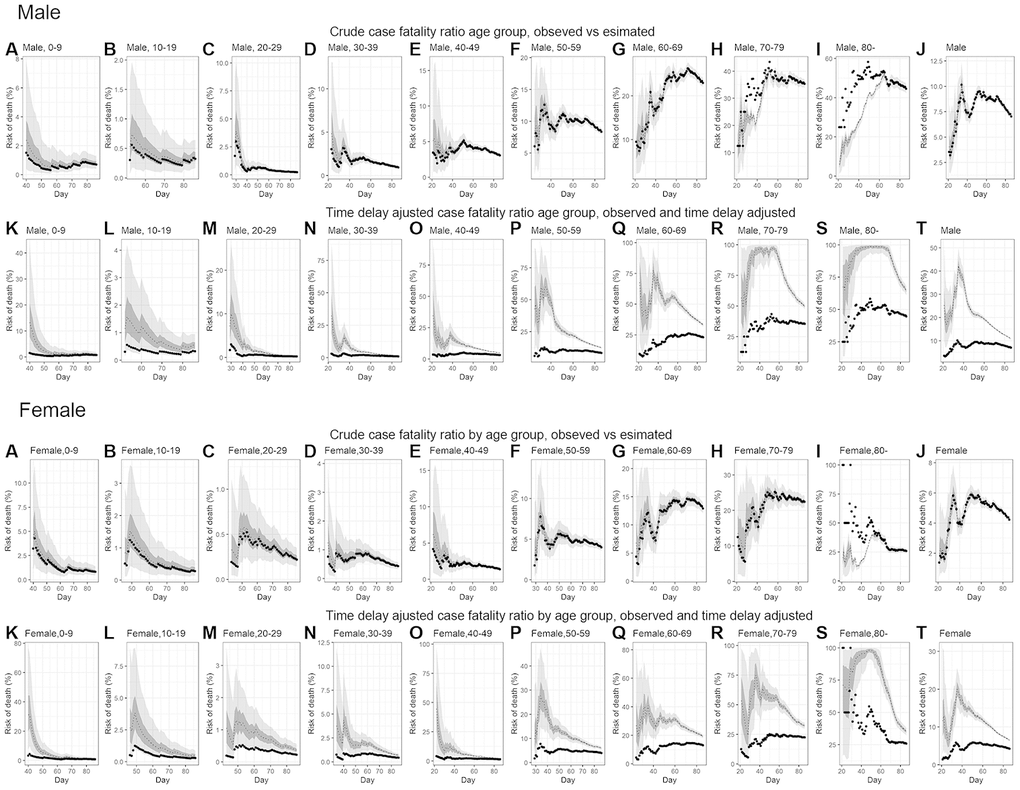
Figure 3. Temporal variation of male and female risk of death by age group caused by CoVID-19, March-May 2020, Peru. Upper two rows; Male risk of deaths, Lower two rows; Female risk of deaths. Observed and posterior estimated of crude case fatality risk of (A) aged 0-9, (B) aged 10-19, (C) aged 20-29, (D) aged 30-39, (E) aged 40-49, (F) aged 50-59, (G) aged 60-69, (H) aged 70-79, (I) aged 80-, (J) all age groups and time-delay adjusted case fatality risk of (K) aged 0-9, (L) aged 10-19, (M) aged 20-29, (N) aged 30-39, (O) aged 40-49, (P) aged 50-59, (Q) aged 60-69, (R) aged 70-79, (S) aged 80-, (T) all age groups. Day 1 corresponds to March 1st in 2020. Black dots show crude case fatality risk, and light and dark indicates 95% and 50% credible intervals for posterior estimates, respectively.
Overall, our model based crude CFR fitted the observed data well, except for individuals aged 80 years and above, probably influenced by low reporting rate/ascertainment bias of cases at an early stage. Crude CFR for most of age groups increased at the early stage of the epidemic, peaked amidst the outbreak day 34 (April 3rd, 2020) and followed a decreasing trend turning into an almost flat curve.
Overall, our model-based posterior estimates for the time-delay adjusted CFR are substantially higher than the crude observed CFR. These estimates fluctuated at the early stage of the epidemic and then followed a decreasing trend.
The most recent estimates, as of May 25, 2020, of the time-delay adjusted CFR for men and women are 10.8% (95%CrI: 10.5-11.1%) and 6.5% (95%CrI: 6.2-6.8%), respectively, while overall national estimate is 9.1% (95%CrI: 8.9-9.3%) (Figure 4 and Table 2). Among men, senior citizens appear to be severely affected; the adjusted CFR is 33.1% (95%CrI: 31.7-34.6%) for men aged 60-69 years, 49.4% (95%CrI: 47.3-51.6%) for those aged 70-79 years, and 64.3% (95%CrI: 60.9-67.8%) for those 80 years old and above. We observe a similar pattern for women. The adjusted CFR is 19.2% (95%CrI: 17.9-20.6%) for women aged 60-69 years, 32.2% (95%CrI: 29.9-34.7%) for those aged 70-79 years, and 35.1% (95%CrI: 32.1-38.1%) for women aged 80 years old or more.
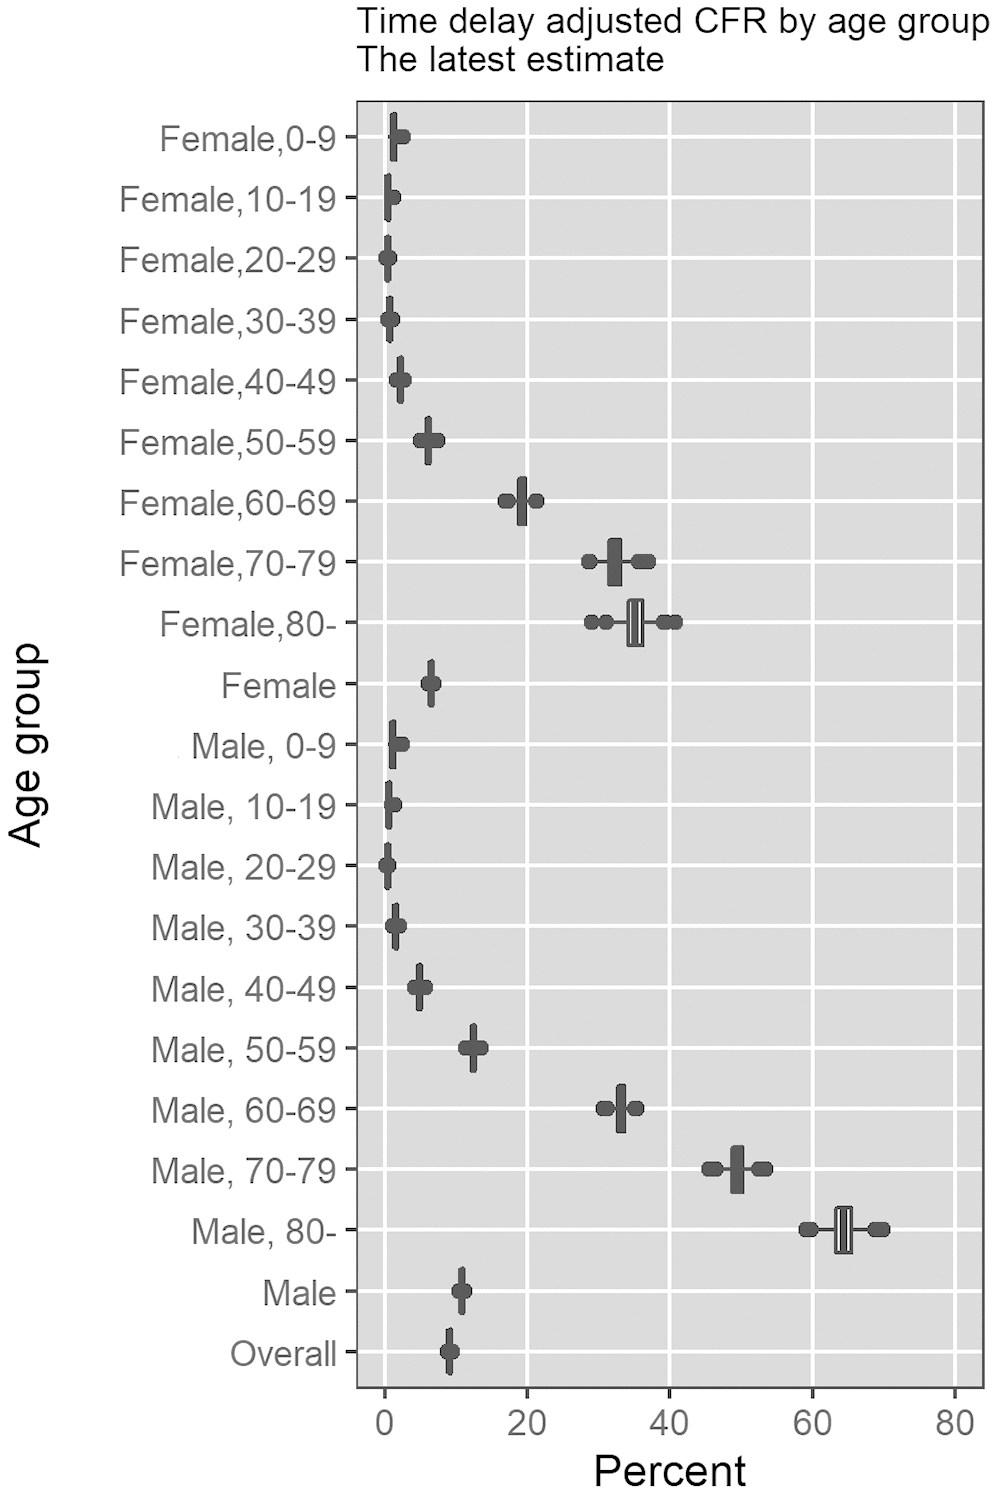
Figure 4. Most recent estimates of time-delay adjusted risk of death caused by CoVID-19 by age group and gender, March-May 2020, Peru. Distribution of time-delay adjusted risk of death from the latest estimates (May 25, 2020) is presented. Top to bottom: female aged 0-9, female aged 10-19, female aged 20-29, female aged 30-39, female aged 40-49, female aged 50-59, female aged 60-69, female aged 70-79, female aged 80 and over, female overall.
Table 2. Summary results of time-delay adjusted case fatality risk of CoVID-19 in each age group in Peru, 2020 as of May 25, 2020.
| Age group | Gender | Latest estimate | Range of median estimates | Crude case fatality rate | |||||||||||||||||||||||||||||||||||||||||||||||||||||||||||||||||||||||||||||||||||||||||||||||
| Overall | 9.1% (95%CrIa: 8.9-9.3%) | 9.1-32.0% | 5.9% (95%CIb: 5.8-6.1%) | ||||||||||||||||||||||||||||||||||||||||||||||||||||||||||||||||||||||||||||||||||||||||||||||||
| 7660/129148 c | |||||||||||||||||||||||||||||||||||||||||||||||||||||||||||||||||||||||||||||||||||||||||||||||||||
| Male | 10.8% (95%CrI: 10.5-11.1%) | 10.8-42.3% | 7.0% (95%CI: 6.9-7.2%) | ||||||||||||||||||||||||||||||||||||||||||||||||||||||||||||||||||||||||||||||||||||||||||||||||
| 5508/78264 | |||||||||||||||||||||||||||||||||||||||||||||||||||||||||||||||||||||||||||||||||||||||||||||||||||
| Female | 6.5% (95%CrI: 6.2-6.8%) | 6.4-20.0% | 4.2% (95%CI: 4.1-4.4%) | ||||||||||||||||||||||||||||||||||||||||||||||||||||||||||||||||||||||||||||||||||||||||||||||||
| 2152/50884 | |||||||||||||||||||||||||||||||||||||||||||||||||||||||||||||||||||||||||||||||||||||||||||||||||||
| 0-9 | Male | 1.1% (95%CrI: 0.5-1.8%) | 1.0-13.3% | 0.7% (95%CI:0.3-1.3%) | |||||||||||||||||||||||||||||||||||||||||||||||||||||||||||||||||||||||||||||||||||||||||||||||
| 10/1416 | |||||||||||||||||||||||||||||||||||||||||||||||||||||||||||||||||||||||||||||||||||||||||||||||||||
| Female | 1.2% (95%CrI: 0.7-2.0%) | 1.2-31.4% | 0.8% (95%CI: 0.4-1.4%) | ||||||||||||||||||||||||||||||||||||||||||||||||||||||||||||||||||||||||||||||||||||||||||||||||
| 11/1362 | |||||||||||||||||||||||||||||||||||||||||||||||||||||||||||||||||||||||||||||||||||||||||||||||||||
| 10-19 | Male | 0.5% (95%CrI: 0.3-1.0%) | 0.4-1.6% | 0.3% (95%CI: 0.1-0.6%) | |||||||||||||||||||||||||||||||||||||||||||||||||||||||||||||||||||||||||||||||||||||||||||||||
| 8/2475 | |||||||||||||||||||||||||||||||||||||||||||||||||||||||||||||||||||||||||||||||||||||||||||||||||||
| Female | 0.5% (95%CrI: 0.2-0.9%) | 0.4-3.8% | 0.3% (95%CI: 0.1-0.6%) | ||||||||||||||||||||||||||||||||||||||||||||||||||||||||||||||||||||||||||||||||||||||||||||||||
| 6/2128 | |||||||||||||||||||||||||||||||||||||||||||||||||||||||||||||||||||||||||||||||||||||||||||||||||||
| 20-29 | Male | 0.4% (95%CrI: 0.2-0.5%) | 0.4-10.0% | 0.2% (95%CI: 0.2-0.3%) | |||||||||||||||||||||||||||||||||||||||||||||||||||||||||||||||||||||||||||||||||||||||||||||||
| 32/14306 | |||||||||||||||||||||||||||||||||||||||||||||||||||||||||||||||||||||||||||||||||||||||||||||||||||
| Female | 0.4% (95%CrI: 0.2-0.6%) | 0.4-1.3% | 0.2% (95%CI: 0.1-0.3%) | ||||||||||||||||||||||||||||||||||||||||||||||||||||||||||||||||||||||||||||||||||||||||||||||||
| 19/8707 | |||||||||||||||||||||||||||||||||||||||||||||||||||||||||||||||||||||||||||||||||||||||||||||||||||
| 30-39 | Male | 1.5% (95%CrI: 1.3-1.7%) | 1.5-32.3% | 0.9% (95%CI: 0.8-1.1%) | |||||||||||||||||||||||||||||||||||||||||||||||||||||||||||||||||||||||||||||||||||||||||||||||
| 169/18052 | |||||||||||||||||||||||||||||||||||||||||||||||||||||||||||||||||||||||||||||||||||||||||||||||||||
| Female | 0.7% (95%CrI: 0.5-0.9%) | 0.9-4.4% | 0.4% (95%CI: 0.3-0.6%) | ||||||||||||||||||||||||||||||||||||||||||||||||||||||||||||||||||||||||||||||||||||||||||||||||
| 49/11487 | |||||||||||||||||||||||||||||||||||||||||||||||||||||||||||||||||||||||||||||||||||||||||||||||||||
| 40-49 | Male | 4.8% (95%CrI: 4.4-5.2%) | 4.8-34.7% | 3.1% (95%CI: 2.8-3.3%) | |||||||||||||||||||||||||||||||||||||||||||||||||||||||||||||||||||||||||||||||||||||||||||||||
| 499/16258 | |||||||||||||||||||||||||||||||||||||||||||||||||||||||||||||||||||||||||||||||||||||||||||||||||||
| Female | 2.2% (95%CrI: 1.8-2.5%) | 2.2-44.6% | 1.4% (95%CI: 1.2-1.6%) | ||||||||||||||||||||||||||||||||||||||||||||||||||||||||||||||||||||||||||||||||||||||||||||||||
| 140/10005 | |||||||||||||||||||||||||||||||||||||||||||||||||||||||||||||||||||||||||||||||||||||||||||||||||||
| 50-59 | Male | 12.4% (95%CrI: 11.7-13.1%) | 12.4-60.0% | 8.3% (95%CI: 7.9-8.8%) | |||||||||||||||||||||||||||||||||||||||||||||||||||||||||||||||||||||||||||||||||||||||||||||||
| 1107/13274 | |||||||||||||||||||||||||||||||||||||||||||||||||||||||||||||||||||||||||||||||||||||||||||||||||||
| Female | 6.0% (95%CrI: 5.4-6.7%) | 7.5-27.7% | 4.0% (95%CI: 3.6-4.4%) | ||||||||||||||||||||||||||||||||||||||||||||||||||||||||||||||||||||||||||||||||||||||||||||||||
| 323/8124 | |||||||||||||||||||||||||||||||||||||||||||||||||||||||||||||||||||||||||||||||||||||||||||||||||||
| 60-69 | Male | 33.1% (95%CrI: 31.7-34.6%) | 33.1-77.8% | 23.0% (95%CI: 22.0-24.0%) | |||||||||||||||||||||||||||||||||||||||||||||||||||||||||||||||||||||||||||||||||||||||||||||||
| 1615/7034 | |||||||||||||||||||||||||||||||||||||||||||||||||||||||||||||||||||||||||||||||||||||||||||||||||||
| Female | 19.2% (95%CrI: 17.9-20.6%) | 19.2-40.9% | 12.9% (95%CI: 12.0-13.9%) | ||||||||||||||||||||||||||||||||||||||||||||||||||||||||||||||||||||||||||||||||||||||||||||||||
| 649/5023 | |||||||||||||||||||||||||||||||||||||||||||||||||||||||||||||||||||||||||||||||||||||||||||||||||||
| 70-79 | Male | 49.4% (95%CrI: 47.3-51.6%) | 48.7-97.8% | 35.3% (95%CI: 33.8-36.9%) | |||||||||||||||||||||||||||||||||||||||||||||||||||||||||||||||||||||||||||||||||||||||||||||||
| 1279/3620 | |||||||||||||||||||||||||||||||||||||||||||||||||||||||||||||||||||||||||||||||||||||||||||||||||||
| Female | 32.2% (95%CrI: 29.9-34.7%) | 24.1-74.9% | 22.4% (95%CI: 20.8-24.1%) | ||||||||||||||||||||||||||||||||||||||||||||||||||||||||||||||||||||||||||||||||||||||||||||||||
| 558/2488 | |||||||||||||||||||||||||||||||||||||||||||||||||||||||||||||||||||||||||||||||||||||||||||||||||||
| 80- | Male | 64.3% (95%CrI: 60.9-67.8%) | 64.3-98.9% | 44.6% (95%CI: 42.3-47.0%) | |||||||||||||||||||||||||||||||||||||||||||||||||||||||||||||||||||||||||||||||||||||||||||||||
| 789/1769 | |||||||||||||||||||||||||||||||||||||||||||||||||||||||||||||||||||||||||||||||||||||||||||||||||||
| Female | 35.1% (95%CrI: 32.1-38.1%) | 35.1-98.3% | 25.8% (95%CI: 23.7-28.1%) | ||||||||||||||||||||||||||||||||||||||||||||||||||||||||||||||||||||||||||||||||||||||||||||||||
| 397/1536 | |||||||||||||||||||||||||||||||||||||||||||||||||||||||||||||||||||||||||||||||||||||||||||||||||||
| a 95%CrI: 95% credibility intervals (CrI), b 95%CI: 95% confidence interval, c Cumulative cases over cumulative deaths | |||||||||||||||||||||||||||||||||||||||||||||||||||||||||||||||||||||||||||||||||||||||||||||||||||
Discussion
This study estimates the time-delay adjusted CFR by age group for the ongoing CoVID-19 epidemic in Peru. The crude CFR varies across countries due to differences in testing and timing of tests [29]. The results from our analysis show that the CoVID-19 epidemic in Peru disproportionately impacts senior individuals, especially those who are 70 years of age or older, consistent with CFR estimates obtained from recent studies conducted in China [30, 31], Chile [32], and Italy [33, 34]. This pattern suggests that an aging population could aggravate the fatality impact of CoVID-19, influenza and respiratory syncytial virus [32], as was probably an important factor for its high impact in Italy [33, 34]. While the population in Lain America, including Peru, is aging at a rapid rate, still a relatively small percentage of the population in the region are older than 65 years of age [35]. Hence, the age structure in the region could favor a lower overall CFR than would be expected otherwise with a relatively older population, as in other regions.
Our estimate of adjusted CFR among men (10.8% (95%CrI: 10.5-11.1%)) is 1.7-fold higher than the estimated adjusted CFR for women (6.5% (95%CrI: 6.2-6.8%)), consistent with the estimates given in ref [37]. Men aged 80 years or older have an estimated adjusted CFR as high as 64.3% (95%CrI: 60.9-67.8%), 58-fold higher than our estimates for men aged 0-9, and 1.3-fold higher than our estimates for men aged 70-79. Similarly, the adjusted CFR estimates for women of aged 80 years or older are as high as 35.1% (95%CrI: 32.1-38.1%), 29-fold higher than the estimates obtained for female aged 0-9 and 1.1-fold higher than the estimates obtained for female aged 70-79, consistent with recent findings in Chile [32]. In comparison, a study conducted in China, reported much lower estimates of CFR for individuals >80 years of age (13.4%) [31].
An upward trend in the crude CFR for overall population suggests the disease transmission may be spreading to more vulnerable populations. The majority of social distancing measures in Peru were implemented between March 11-March 18, 2020. However, since 72.4% of the economically active population works in informal jobs, which are concentrated in the poorest areas of the country, compliance with government mitigation strategies can be challenging despite the government’s efforts to support the population [37]. Another factor possibly contributing to the upward trend in crude CFR may be an increase in unreported cases due to saturated testing capacity [29]. However, since Peru’s testing capacity has substantially increased since the beginning of the outbreak, going from >0.01 test per 1000 population to 0.09 per 1000 in May 22 [15], and the positivity rate estimated at 8.6% for March, 2020, this seems an unlikely cause. In Peru, about 85% of ICU beds with ventilators are currently occupied by patients [37], therefore our present estimates are not affected by excess deaths due to health care demand exceeding health care capacity. However, as the epidemic continues to expand, healthcare capacity may be reached in the short term [37]. Furthermore, the results show an increasing trend in crude CFR around day 45 (May 14th, 2020), probably reflecting the exponential increase of cumulative cases around day 40 (May 9th, 2020).
The downward trend in the adjusted CFR at the early stage may indicate the existence of a reporting delay and the shift of the outbreak to a less vulnerable segment of the population. In particular, the observed differences in estimates between the crude CFR and adjusted CFR can be attributed to the time-delay that is assumed fixed during the course of the epidemic.
The relatively small proportion of males (53.5%) among CoVID-19 cases in the individuals aged 80 years and above can be attributed to the relatively small male population size for that age group; with men comprising only 1.7% of the population >80 years of age in Peru, consistent with estimates for Chile [32]. As higher mortality among male has been reported in China and the U.S. [38], additional data on deaths stratified by gender provides the opportunity to examine the CFR by gender and age.
Several studies documenting the IFR of CoVID-19 have been reported based on an observational study [39], modeling studies [31, 40] and serological studies [41, 42]. While IFR estimates may be more realistic indicators compared to estimates derived from observed cases alone [43, 44], the external validity of these serological studies, e.g., whether the results can be applied to the generalized population in the region where they are performed, needs to be closely examined, as pointed out elsewhere [40, 45, 46]. In particular, to derive IFR estimates, prevalence, the cumulative number of infected people, is estimated based on the result of serological studies. Then, the cumulative number of deaths in the region is divided by the estimated cumulative number of infected individuals.
Indeed, serological studies based on blood donors and outpatients/hospitalized patients will easily lead to overestimation and underestimation, respectively, because the number of infected individuals is expected to be lower among the blood donors and higher among the outpatients/hospitalized patients. In contrast, the death risk derived from the CFR is less affected by the sampling bias and a convenient indicator to identify the vulnerable subpopulations, especially focusing on a single country with relatively uniform testing capacity across the population.
Our study has at least two limitations. First, our estimates are probably overestimated, due to the effect of under reporting rates and ascertainment rates, as has been underscored in other studies [25, 27, 47]. But a recently enhanced testing capacity in Peru is expected to mitigate these effects, and an ongoing mass serological study will provide data to generate more accurate estimates of the death risk. Second, adjusted CFR, especially among seniors, has displayed fluctuations, highlighting the importance of focusing on sub-group analyses. Additional information such as line lists that include related risks including information on underlying diseases may help to identify subgroups with elevated risks.
Conclusions
The CoVID-19 pandemic is imposing a large death toll in Peru. Senior individuals, especially those who are older than 70 years of age, are being disproportionately affected by the CoVID-19 pandemic, particularly elderly men. CFR was as high as 64.3% (95%CrI: 60.9-67.8%) for men aged 80 older, 58-fold higher than our estimates for men aged 0-9. The overall adjusted CFR in Peru is estimated to be higher than in other countries, which is worrying, particularly because healthcare demand has not yet exceeded capacity, but probably will do in the coming weeks. The relatively younger age structure in Latin America may help ameliorate the overall CFR than would otherwise be expected with an older age structure in the population.
Materials and Methods
Data
We obtained daily cumulative numbers of reported laboratory confirmed CoVID-19 cases and deaths stratified by age group and gender through May 25, 2020. Different age groups had different starting times, which correspond to the day when death was reported. Confirmed CoVID-19 cases were retrieved from three surveillance systems: a) national surveillance system (confirmed and suspected cases based on a case definition), b) Netlab system (molecular test) and c) SICOVID system (rapid serological test). CoVID-19 deaths were obtained from two surveillance systems: a) national surveillance system (confirmed and suspected deaths based on a case definition) and b) Vital statistics system (National System of mortality -SINADEF- which is an online system that keeps track of death certificates) [48]. A suspected case presents with acute respiratory infection and with two or more of the following symptoms (cough, sore throat, respiratory distress, nasal congestion or fever), close contact with a CoVID-19 case within 14 days of symptoms onset, or people who live or traveled to cities with community transmission of SARS-CoV-2 within 14 days of symptoms onset. On the other hand, the definition of confirmed cases is a suspected case with a positive lab test. [49].
Population size by age, group, and gender in 2020 were retrieved from the Ministry of Health in Peru [50].
Statistical analysis
The crude CFR is defined as the number of cumulative deaths over the number of cumulative cases. For the estimation of CFR in real time, we employed the delay from hospitalization to death, hs, which is assumed to be given by hs = H(s) – H(s-1) for s>0 where H(s) is a cumulative density function of the delay from hospitalization to death and follows a gamma distribution with mean 10.1 days and SD 5.4 days, as given in ref, Mizumoto and Chowell [24]. Let πa,ti be the time-delay adjusted case fatality risk on reported day ti in area a, the likelihood function of the estimate
where ca,t represents the number of new cases with reported day t in area a, and
We used a Monte Carlo Markov Chain (MCMC) method in a Bayesian framework to estimate model parameters. We evaluated the convergence of MCMC chains using the potential scale reduction statistic [53, 54]. Estimates and 95% credibility intervals for these estimates are based on the posterior probability distribution of each parameter and samples drawn from the posterior distributions. All statistical analyses were conducted in R version 3.6.1 (R Foundation for Statistical Computing, Vienna, Austria) using the ‘rstan’ package.
Author Contributions
GC and KM conceived the early study idea. KM implemented statistical analysis. AT and KM wrote the first full draft. CM performed data acquisition. All authors contributed to the revision of the manuscript. AU advised the study, and revised the manuscript. GC advised on and helped shape the research. All authors contributed to the interpretation of the results and edited and commented on several earlier versions of the manuscript. All authors read and approved the final manuscript.
Conflicts of Interest
All authors report no conflicts of interest.
Funding
This work was supported by the Japan Society for the Promotion of Science (JSPS) KAKENHI [grant Number 20H03940]; the Leading Initiative for Excellent Young Researchers from the Ministry of Education, Culture, Sport, Science and Technology of Japan; Japan Science and Technology Agency (JST) as part of J-RAPID [grant JPMJSC] to [KM]; National Science Foundation RAPID grant # 2026797 to [GC]; and the ANID Millennium Science Initiative/ Millennium Initiative for Collaborative Research on Bacterial Resistance, MICROB-R, [NCN17_081] to [EU].
References
- 1. Dong E, Du H, Gardner L. An interactive web-based dashboard to track COVID-19 in real time. Lancet Infect Dis. 2020; 20:533–34. https://doi.org/10.1016/S1473-3099(20)30120-1 [PubMed]
- 2. Heymann DL, Shindo N, and WHO Scientific and Technical Advisory Group for Infectious Hazards. COVID-19: what is next for public health? Lancet. 2020; 395:542–45. https://doi.org/10.1016/S0140-6736(20)30374-3 [PubMed]
- 3. World Bank. (2020). The Economy in the Time of CoVID-19. In: Bank W, ed. Semiannual Report of the Latin America and Caribbean Region. (Washington DC: World Bank).
- 4. Lloyd-Sherlock P, Ebrahim S, Geffen L, McKee M. Bearing the brunt of covid-19: older people in low and middle income countries. BMJ. 2020; 368:m1052. https://doi.org/10.1136/bmj.m1052 [PubMed]
- 5. Burki T. COVID-19 in latin america. Lancet Infect Dis. 2020; 20:547–48. https://doi.org/10.1016/S1473-3099(20)30303-0 [PubMed]
- 6. Bedford J, Enria D, Giesecke J, Heymann DL, Ihekweazu C, Kobinger G, Lane HC, Memish Z, Oh MD, Sall AA, Schuchat A, Ungchusak K, Wieler LH, and WHO Strategic and Technical Advisory Group for Infectious Hazards. COVID-19: towards controlling of a pandemic. Lancet. 2020; 395:1015–18. https://doi.org/10.1016/S0140-6736(20)30673-5 [PubMed]
- 7. Rodriguez-Morales AJ, Gallego V, Escalera-Antezana JP, Méndez CA, Zambrano LI, Franco-Paredes C, Suárez JA, Rodriguez-Enciso HD, Balbin-Ramon GJ, Savio-Larriera E, Risquez A, Cimerman S. COVID-19 in latin america: the implications of the first confirmed case in Brazil. Travel Med Infect Dis. 2020; 35:101613. https://doi.org/10.1016/j.tmaid.2020.101613 [PubMed]
- 8. The Lancet. COVID-19: learning from experience. Lancet. 2020; 395:1011. https://doi.org/10.1016/S0140-6736(20)30686-3 [PubMed]
- 9. Navarro JC, Arrivillaga-Henríquez J, Salazar-Loor J, Rodriguez-Morales AJ. COVID-19 and dengue, co-epidemics in Ecuador and other countries in latin america: pushing strained health care systems over the edge. Travel Med Infect Dis. 2020; 101656. https://doi.org/10.1016/j.tmaid.2020.101656 [PubMed]
- 10. Lorenz C, Azevedo TS, Chiaravalloti-Neto F. COVID-19 and dengue fever: a dangerous combination for the health system in Brazil. Travel Med Infect Dis. 2020; 35:101659. https://doi.org/10.1016/j.tmaid.2020.101659 [PubMed]
- 11. MOH. (2020). Sala Situacional COVID-19 Peru.
- 12. Aquino M and Garrison C. (2020). Peru records first confirmed case of coronavirus, President Vizcarra says. Rueters.
- 13. Explorer A. (2020). Coronavirus in Peru- the latest updates. (Amazon Explorer).
- 14. Munayco CV, Tariq A, Rothenberg R, Soto-Cabezas GG, Reyes MF, Valle A, Rojas-Mezarina L, Cabezas C, Loayza M, Chowell G, and Peru COVID-19 working group. Early transmission dynamics of COVID-19 in a southern hemisphere setting: lima-peru: February 29th-March 30th, 2020. Infect Dis Model. 2020; 5:338–45. https://doi.org/10.1016/j.idm.2020.05.001 [PubMed]
- 15. Hasell J, Ortiz-Ospina E, Mathieu E, Ritchie H, Roser M. (2020). To understand the global pandemic, we need global testing – the Our World in Data COVID-19 Testing dataset. Our World in data.
- 16. Rainisch G, Undurraga EA, Chowell G. A dynamic modeling tool for estimating healthcare demand from the COVID19 epidemic and evaluating population-wide interventions. Int J Infect Dis. 2020; 96:376–83. https://doi.org/10.1016/j.ijid.2020.05.043 [PubMed]
- 17. Cascella M, Rajnik M, Cuomo A, Dulebohn SC, Di Napoli R. Features, Evaluation and Treatment Coronavirus (COVID-19). 2020. In: StatPearls [Internet]. Treasure Island (FL): StatPearls Publishing; 2020. [PubMed]
- 18. Guan WJ, Ni ZY, Hu Y, Liang WH, Ou CQ, He JX, Liu L, Shan H, Lei CL, Hui DS, Du B, Li LJ, Zeng G, et al, and China Medical Treatment Expert Group for Covid-19. Clinical characteristics of coronavirus disease 2019 in China. N Engl J Med. 2020; 382:1708–20. https://doi.org/10.1056/NEJMoa2002032 [PubMed]
- 19. Wu JT, Leung K, Bushman M, Kishore N, Niehus R, de Salazar PM, Cowling BJ, Lipsitch M, Leung GM. Estimating clinical severity of COVID-19 from the transmission dynamics in Wuhan, China. Nat Med. 2020; 26:506–10. https://doi.org/10.1038/s41591-020-0822-7 [PubMed]
- 20. Stokes EK, Zambrano LD, Anderson KN, Marder EP, Raz KM, El Burai Felix S, Tie Y, Fullerton KE. Coronavirus disease 2019 case surveillance — United States, January 22-May 30, 2020. MMWR Morb Mortal Wkly Rep. 2020; 69:759–65. https://doi.org/10.15585/mmwr.mm6924e2 [PubMed]
- 21. CDC COVID-19 Response Team. Severe outcomes among patients with coronavirus disease 2019 (COVID-19) - United States, February 12-March 16, 2020. MMWR Morb Mortal Wkly Rep. 2020; 69:343–46. https://doi.org/10.15585/mmwr.mm6912e2 [PubMed]
- 22. Epidemiology Working Group for NCIP Epidemic Response, Chinese Center for Disease Control and Prevention. [The epidemiological characteristics of an outbreak of 2019 novel coronavirus diseases (COVID-19) in China]. Zhonghua Liu Xing Bing Xue Za Zhi. 2020; 41:145–151. https://doi.org/10.3760/cma.j.issn.0254-6450.2020.02.003 [PubMed]
- 23. Reed C, Biggerstaff M, Finelli L, Koonin LM, Beauvais D, Uzicanin A, Plummer A, Bresee J, Redd SC, Jernigan DB. Novel framework for assessing epidemiologic effects of influenza epidemics and pandemics. Emerg Infect Dis. 2013; 19:85–91. https://doi.org/10.3201/eid1901.120124 [PubMed]
- 24. Mizumoto K, Chowell G. Estimating risk for death from coronavirus disease, China, January-February 2020. Emerg Infect Dis. 2020; 26:1251–56. https://doi.org/10.3201/eid2606.200233 [PubMed]
- 25. Li R, Pei S, Chen B, Song Y, Zhang T, Yang W, Shaman J. Substantial undocumented infection facilitates the rapid dissemination of novel coronavirus (SARS-CoV-2). Science. 2020; 368:489–93. https://doi.org/10.1126/science.abb3221 [PubMed]
- 26. Jewell NP, Lei X, Ghani AC, Donnelly CA, Leung GM, Ho LM, Cowling BJ, Hedley AJ. Non-parametric estimation of the case fatality ratio with competing risks data: an application to severe acute respiratory syndrome (SARS). Stat Med. 2007; 26:1982–98. https://doi.org/10.1002/sim.2691 [PubMed]
- 27. Lipsitch M, Donnelly CA, Fraser C, Blake IM, Cori A, Dorigatti I, Ferguson NM, Garske T, Mills HL, Riley S, Van Kerkhove MD, Hernán MA. Potential biases in estimating absolute and relative case-fatality risks during outbreaks. PLoS Negl Trop Dis. 2015; 9:e0003846. https://doi.org/10.1371/journal.pntd.0003846 [PubMed]
- 28. Pan A, Liu L, Wang C, Guo H, Hao X, Wang Q, Huang J, He N, Yu H, Lin X, Wei S, Wu T. Association of public health interventions with the epidemiology of the COVID-19 outbreak in Wuhan, China. JAMA. 2020; 323:1–9. https://doi.org/10.1001/jama.2020.6130 [PubMed]
- 29. Asahi K, Undurraga EA, Wagner R. Benchmarking the CoVID-19 pandemic across countries and states in the U.S.A. under heterogeneous testing. medRxiv. 2020. [Epub ahead of print]. https://doi.org/10.1101/2020.05.01.20087882
- 30. Deng X, Yang J, Wang W, Wang X, Zhou J, Chen Z, Li J, Chen Y, Yan H, Zhang J, Zhang Y, Wang Y, Qiu Q, et al. Case fatality risk of the first pandemic wave of novel coronavirus disease 2019 (COVID-19) in China. Clin Infect Dis. 2020. [Epub ahead of print]. https://doi.org/10.1093/cid/ciaa578 [PubMed]
- 31. Verity R, Okell LC, Dorigatti I, Winskill P, Whittaker C, Imai N, Cuomo-Dannenburg G, Thompson H, Walker PG, Fu H, Dighe A, Griffin JT, Baguelin M, et al. Estimates of the severity of coronavirus disease 2019: a model-based analysis. Lancet Infect Dis. 2020; 20:669–77. https://doi.org/10.1016/S1473-3099(20)30243-7 [PubMed]
- 32. Undurraga EA, Chowell G, Mizumoto K. Case fatality risk by age from COVID-19 in a high testing setting in Latin America: Chile, March-May, 2020. medRxiv. 2020. [Epub ahead of print]. https://doi.org/10.1101/2020.05.25.20112904
- 33. Onder G, Rezza G, Brusaferro S. Case-fatality rate and characteristics of patients dying in relation to COVID-19 in Italy. JAMA. 2020. [Epub ahead of print]. https://doi.org/10.1001/jama.2020.4683 [PubMed]
- 34. Dowd JB, Andriano L, Brazel DM, Rotondi V, Block P, Ding X, Liu Y, Mills MC. Demographic science aids in understanding the spread and fatality rates of COVID-19. Proc Natl Acad Sci USA. 2020; 117:9696–98. https://doi.org/10.1073/pnas.2004911117 [PubMed]
- 35. Ham-Chande R, Nava-Bolaños I. Convergence Toward Demographic Aging in Latin America and the Caribbean. Annu Rev Sociol. 2019; 45:607–623. https://doi.org/10.1146/annurev-soc-073018-022532
- 36. Martínez AD. (2020). Peru Passes Coronavirus Risk to the Working Class (disponible en español). (nacla).
- 37. Castillo M. (2020). Peru seemed to do everything right. So how did it become a Covid-19 hotspot? CNN.
- 38. Richardson S, Hirsch JS, Narasimhan M, Crawford JM, McGinn T, Davidson KW, Barnaby DP, Becker LB, Chelico JD, Cohen SL, Cookingham J, Coppa K, Diefenbach MA, et al, and the Northwell COVID-19 Research Consortium. Presenting characteristics, comorbidities, and outcomes among 5700 patients hospitalized with COVID-19 in the new york city area. JAMA. 2020; 323:2052–59. https://doi.org/10.1001/jama.2020.6775 [PubMed]
- 39. Russell TW, Hellewell J, Jarvis CI, van Zandvoort K, Abbott S, Ratnayake R, Cmmid Covid-Working Group, Flasche S, Eggo RM, Edmunds WJ, Kucharski AJ. Estimating the infection and case fatality ratio for coronavirus disease (COVID-19) using age-adjusted data from the outbreak on the diamond princess cruise ship, February 2020. Euro Surveill. 2020; 25:2000256. https://doi.org/10.2807/1560-7917.ES.2020.25.12.2000256 [PubMed]
- 40. Mizumoto K, Kagaya K, Chowell G. Early epidemiological assessment of the transmission potential and virulence of coronavirus disease 2019 (COVID-19) in Wuhan City: China, January-February, 2020. medRxiv. 2020. https://doi.org/10.1101/2020.02.12.20022434
- 41. Ioannidis J. The infection fatality rate of COVID-19 inferred from seroprevalence data. medRxiv. 2020. [Epub ahead of print]. https://doi.org/10.1101/2020.05.13.20101253
- 42. To KKW, Cheng VCC, Cai JP, Chan KH, Chen LL, Wong LH, et al. Lancet Microbe. https://doi.org/10.1016/S2666-5247(20)30053-7
- 43. Wong JY, Wu P, Nishiura H, Goldstein E, Lau EH, Yang L, Chuang SK, Tsang T, Peiris JS, Wu JT, Cowling BJ. Infection fatality risk of the pandemic a(H1N1)2009 virus in hong kong. Am J Epidemiol. 2013; 177:834–40. https://doi.org/10.1093/aje/kws314 [PubMed]
- 44. Presanis AM, De Angelis D, Hagy A, Reed C, Riley S, Cooper BS, Finelli L, Biedrzycki P, Lipsitch M, and New York City Swine Flu Investigation Team. The severity of pandemic H1N1 influenza in the United States, from April to July 2009: a bayesian analysis. PLoS Med. 2009; 6:e1000207. https://doi.org/10.1371/journal.pmed.1000207 [PubMed]
- 45. Wu X, Fu B, Chen L, Feng Y. Serological tests facilitate identification of asymptomatic SARS-CoV-2 infection in Wuhan, China. J Med Virol. 2020; 10:1002. https://doi.org/10.1002/jmv.25904 [PubMed]
- 46. Giugliano F. Mass Coronavirus Antibody Tests Have Serious Limits. Bloomberg Opinion. April 24, 2020.
- 47. Ghani AC, Donnelly CA, Cox DR, Griffin JT, Fraser C, Lam TH, Ho LM, Chan WS, Anderson RM, Hedley AJ, Leung GM. Methods for estimating the case fatality ratio for a novel, emerging infectious disease. Am J Epidemiol. 2005; 162:479–86. https://doi.org/10.1093/aje/kwi230 [PubMed]
- 48. Ministerio de Salud, Peru: Alerta Epidemiológica ante la transmisión de COVID-IS en el Perú. https://www.dge.gob.pe/portal/docs/alertas/2020/AE016.pdf.
- 49. Vargas-Herrera J, Ruiz KP, Nuñez GG, Ohno JM, Pérez-Lu JE, Huarcaya WV, Clapham B, Cortez-Escalante J. [Preliminary results of the strengthening of the national death registry information system]. Rev Peru Med Exp Salud Publica. 2018; 35:505–14. https://doi.org/10.17843/rpmesp.2018.353.3913 [PubMed]
- 50. Instituto Nacional de Estadística e Informáticas. PERÚ: Estimaciones y Proyecciones de Población por Departamento, Sexo y Grupos Quinquenales de Edad 1995-2025. Boletín de Análisis Demográfico No 37. Lima, Setiembre 2009. https://www.inei.gob.pe/media/principales_indicadores/libro_1.pdf.
- 51. Nishiura H, Klinkenberg D, Roberts M, Heesterbeek JA. Early epidemiological assessment of the virulence of emerging infectious diseases: a case study of an influenza pandemic. PLoS One. 2009; 4:e6852. https://doi.org/10.1371/journal.pone.0006852 [PubMed]
- 52. Tsuzuki S, Lee H, Miura F, Chan YH, Jung SM, Akhmetzhanov AR, Nishiura H. Dynamics of the pneumonic plague epidemic in Madagascar, August to October 2017. Euro Surveill. 2017; 22:17–00710. https://doi.org/10.2807/1560-7917.ES.2017.22.46.17-00710 [PubMed]
- 53. Gamerman D, Lopes HF. (2006). Markov chain Monte Carlo: stochastic simulation for Bayesian inference: CRC Press).
- 54. Gelman A, Rubin DB. Inference from iterative simulation using multiple sequences. Stat Sci. 1992; 7:457–472. https://doi.org/10.1214/ss/1177011136