


Introduction
Alzheimer’s disease (AD), a neurodegenerative disorder and the most common cause of dementia [1], seriously interferes with daily life, affecting memory, the ability to reason and communicate, and eventually causing death. According to a recent study [2], the incidence of AD doubles every 5 years after the age 65. Unfortunately, there is still no effective treatment for AD. Therefore, there is ample opportunity to develop pharmacological and behavioral interventions for delaying the onset and progression of AD during its early stages. According to recent statistical analyses [3], ~10-15% of AD patients with mild cognitive impairment (MCI) progress from the prodromal stage of AD to probable AD [4]. Early treatment is believed to delay AD progression at the MCI and preclinical stages [5, 6].
Functional magnetic resonance imaging (fMRI) is a non-invasive technique that can effectively measure brain activity [7–9]. However, it is still challenging to diagnose AD patients using fMRI since spontaneous brain activity can be random and asynchronous across subjects and scanners. By virtue of the brain connectome, the functional brain network provides more consistent data [10–14]. Indeed, functional connectivity network (FCN) has been correlated to some neurological and psychological diseases such as autism spectrum disorder (ASD) [15, 16], MCI [12, 17–19], and AD [20–22], among others, relying heavily on the quality of the final estimated FCNs. Therefore, computing reliable FCNs can increase the accurate diagnosis of such disorders [23].
Mathematically, FCN can be formulated in a graph format, in which each node corresponds to a specific region-of-interest (ROI) in the brain and each edge delineates the relation between the blood-oxygen-level-dependent (BOLD) signals associated with a pair of ROIs. The most widely-used FCN estimation models are based on second-order statistics (or correlations) and, according to a recent review [24], these correlation-based methods are generally more sensitive than complex high-order methods. Therefore, in this paper, we mainly focus on correlation-based methods, and will briefly review some of them, including Pearson’s correlation (PC) [25], sparse representation (SR) [26, 27], and their variants. However, the FCN commonly has more “topological structures” than just sparsity (Sporns 2011). Currently, several studies have proposed more discriminative FCNs with improved estimations to diagnose neurodegenerative diseases. Most of these can be explained under a regularization framework, which illustrates that a reliable FCN estimation model should not only fit the data well, but also effectively encode priors of the brain organization [28]. In practice, the commonly-used priors include sparsity, modularity, group-sparsity, low-rank and scale-free [19, 25, 26, 28, 29], which can be transformed into corresponding regularization terms for FCN estimation. Moreover, the priors can also be transferred from the data modelling [23] or other high-quality data [30]. Such approaches commonly improve the performance of FCNs and their diagnostic accuracy.
In this study, inspired by the fact that similar ROIs in FCNs tend to have similar connection patterns (i.e., inter-similarity structure), we present a novel FCN estimation scheme by encoding such a prior in the form of a graph regularizer. We formulated this prior into a graph-learning model with an additional graph/manifold regularizer for FCN estimation, and further proposed an efficient global optimization algorithm. Additionally, the proposed method is not competing with any other FCN estimation model, since it only provides an effective inter-similarity module in FCN estimation.
Results
Network visualization
For visual comparison of the FCN by PC, SR, GR and SGR methods, we constructed an FCN adjacency matrix W for each method (Figure 1), with all weights normalized between −1 and 1, for ease of comparison across the different methods.
Figure 1 shows that the full correlation-based FCNs have different topology from the partial correlation-based FCN (i.e., SR, GR and SGR), since they adopt different statistical information by using different data-fitting terms. In addition, compared with SR and GSR, the FCN estimated by SGR tends to be better organized, illustrating the effectiveness of the performance.
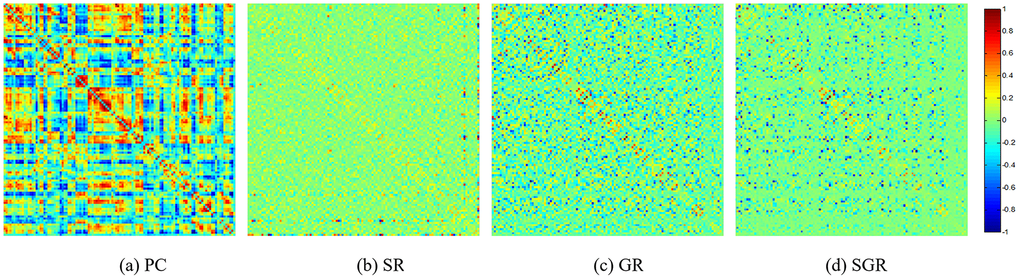
Figure 1. The FCN adjacency matrices of a certain subject, constructed by different methods.
MCI identification
A set of quantitative measurements, including accuracy, sensitivity, specificity, and area under the curve (AUC), are used to evaluate the classification performance of four different methods (PC, SR, GR and SGR). The mathematical definition of the first three measures are as follows:
Here, TruePositive is the number of the positive subjects that are correctly classified in the MCI identification task. Similarly, TrueNegative, FalsePostive and FalseNegative are the numbers of their corresponding subjects, respectively.
The MCI vs NC classification results on the ADNI dataset are given in Table 1 and Figure 2, with SGR achieving the best results. As seen in Table 1, the partial correlation-based methods work better than the PC method, which reveals the effectiveness of partial correlation information. In addition, the SGR method strongly outperforms the SR and GR methods, which demonstrates the effectiveness of both sparsity and inter-similarity priors.
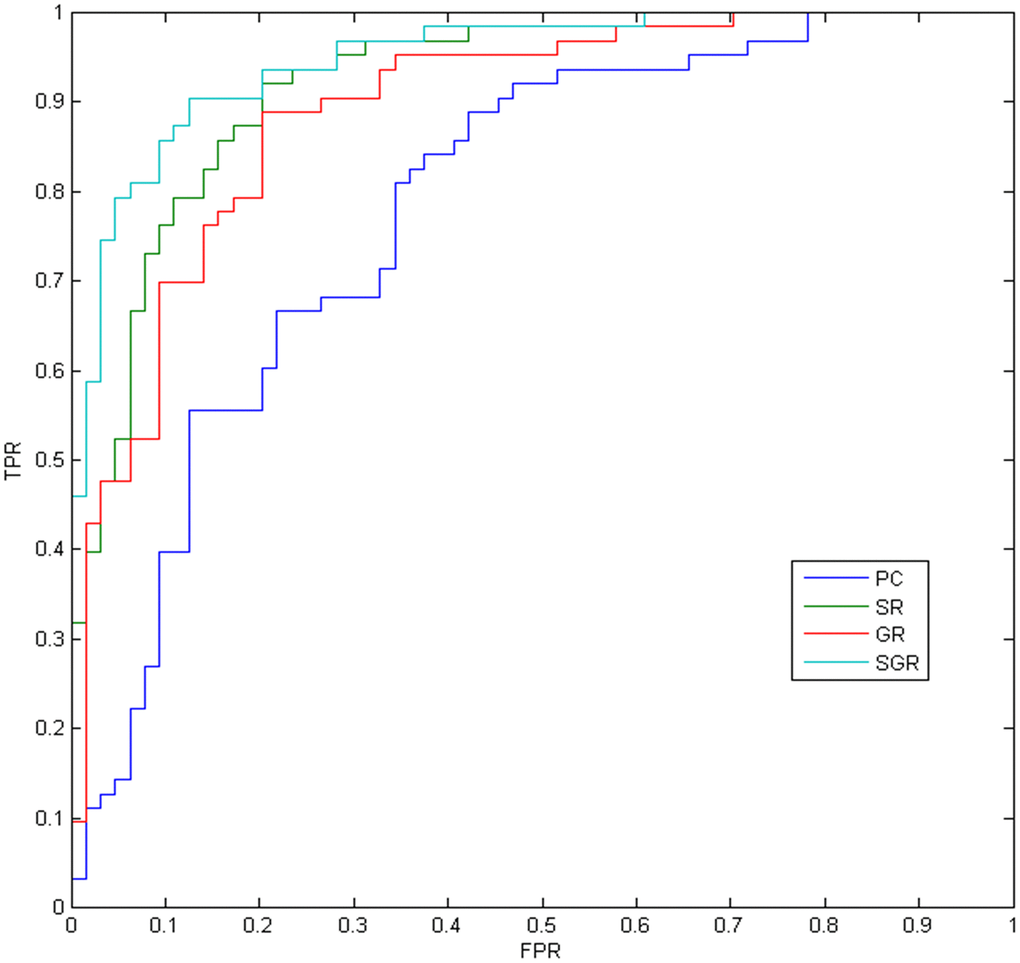
Figure 2. The ROC results of different methods.
Table 1. Classification performance corresponding to different FCN estimation. methods on ADNI dataset.
| Method | Accuracy | Sensitivity | Specificity | AUC |
| PC | 71.65 | 76.56 | 66.67 | 0.7852 |
| SR | 84.25 | 85.71 | 82.81 | 0.9208 |
| GR | 80.31 | 79.69 | 80.95 | 0.8918 |
| SGR | 88.19 | 87.50 | 88.89 | 0.9486 |
Sensitivity to network model parameters
The ultimate classification accuracy is particularly sensitive to the network model parameters. In Figure 3, we show the classification accuracy corresponding to different parametric combinations in the proposed SGR method. In addition, the classification accuracy is computed by the LOO test on all of the subjects. Consequently, Figure 3 shows that we achieve the best accuracy (93.70%) with λ = 21 (for sparsity) and γ = 25 (for inter-similarity).
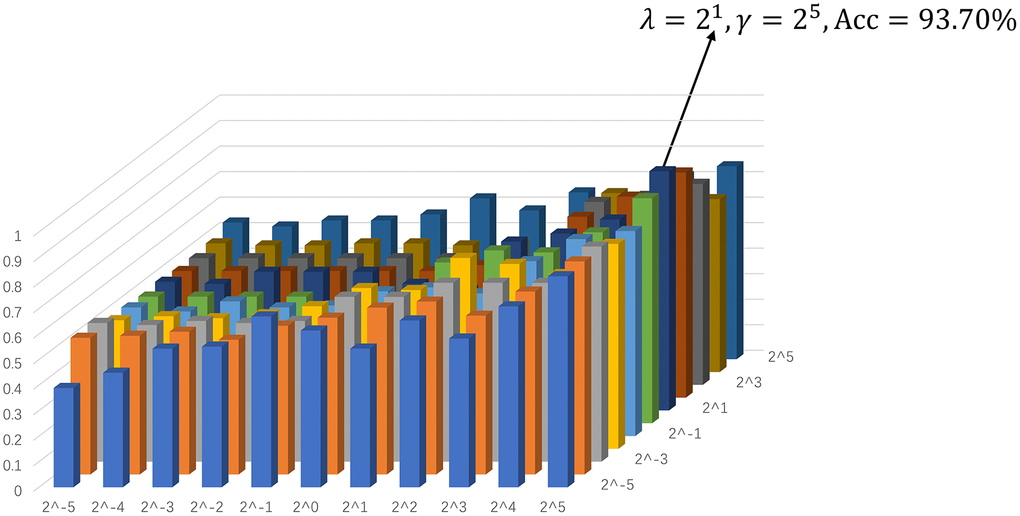
Figure 3. Assification accuracy based on the networks estimated by the proposed method with different regularized parametric values in the interval [2−5, 25]. The results are obtained by LOO test on all subjects.
Consensus connections
As the selected connections in each inner loop might be different, we recorded the consensus connections for the classification model in each inner LOOCV loop. As mentioned above, we selected the consensus connections with p-value < 0.01 in each loop, and the consensus connections are shown in Table 2 and Figure 4. Specifically, 8 positive consensus connections are listed in Table 2. Most of these discriminative connections were distributed in the frontal, occipital, and parietal lobes. All consensus connections had both enhanced and weakened functional connections in MCI patients. Furthermore, we projected them into the corresponding subnetworks and found that most consensus connections were mainly distributed in the default mode network (DMN), frontoparietal task control network, and sensory/somatomotor hand network.
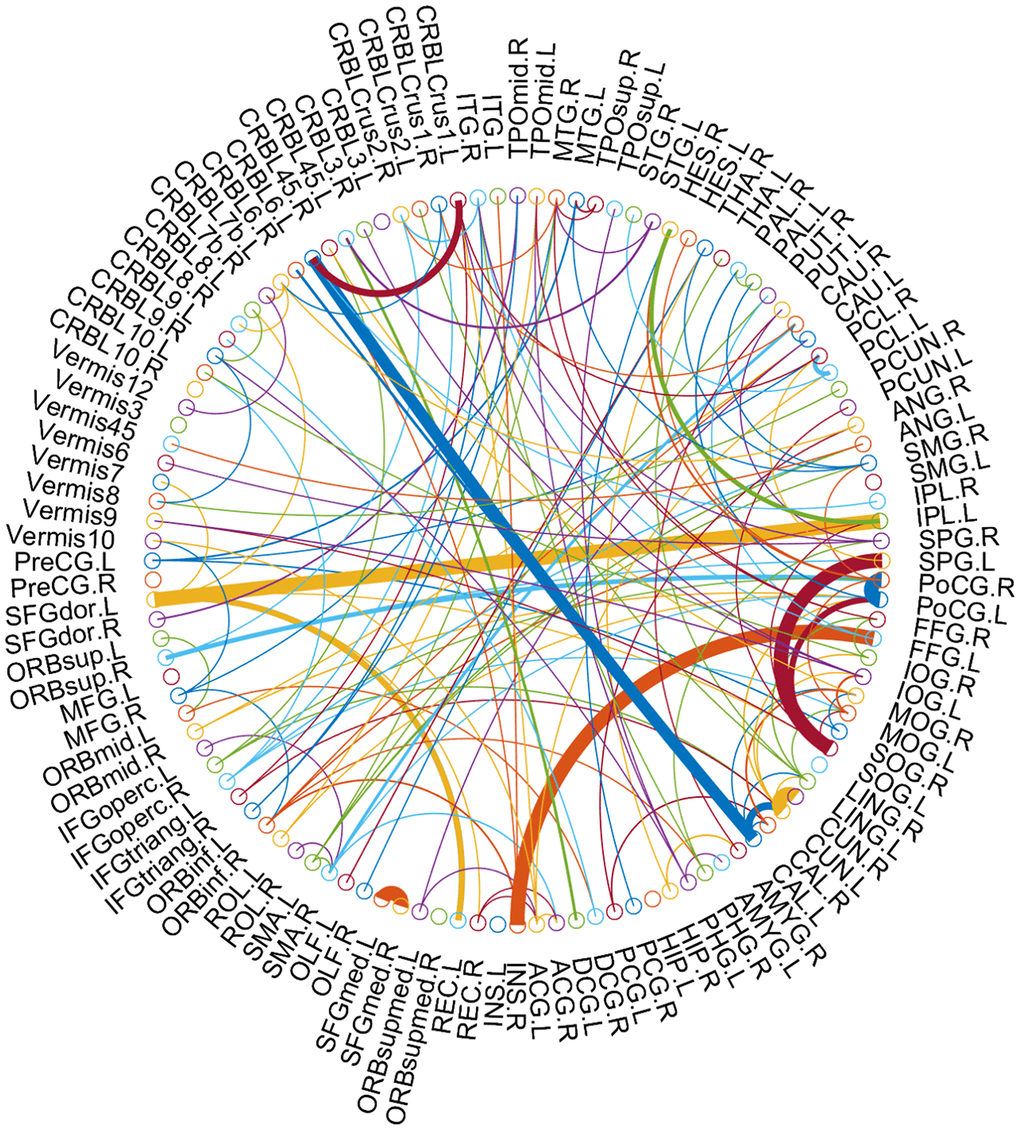
Figure 4. The consensus connections, selected via LOOCV, between MCI and NC for 116 AAL template ROIs. The arc thickness indicates the discriminative power of an edge, which is inversely proportional to the estimated p-values. The arc colors were randomly generated to differentiate ROIs. This figure was created using a Matlab function, circularGraph, shared by Paul Kassebaum (http://www.mathworks.com/matlabcentral/fileexchange/48576-circulargraph).
Table 2. Consensus connections between MCI and NC for 116 AAL template ROIs.
| Region | Region | Mean values | P value | |
| MCI | NC | |||
| Frontal_Sup_Medial_L | Frontal_Sup_Medial_R | 0.274 | 0.181 | 9.72⊆10-8 |
| Postcentral_L | Postcentral_R | 0.171 | 0.135 | 1.14⊆10-6 |
| Parietal_Sup_L | Occipital_Sup_L | 0.024 | 0.052 | 4.49⊆10-6 |
| Cuneus_L | Cuneus_R | 0.154 | 0.173 | 8.89⊆10-6 |
| Fusiform_L | Insula_R | 0.036 | 0.007 | 1.04⊆10-5 |
| Cuneus_L | Calcarine_L | 0.099 | 0.048 | 2.18⊆10-5 |
| Cerebelum_Crus1_L | Cerebelum_6_L | 0.083 | 0.118 | 2.40⊆10-5 |
| Occipital_Inf_L | Occipital_Mid_L | 0.142 | 0.114 | 1.59⊆10-4 |
Hub regions of functional network
According to the definition of “hubs”, we identified hub nodes of the FCN estimated by SGR with λ = 21 and γ = 25 in MCI patients and NCs. As shown in Table 3, the common hubs of MCI and NCs were located mainly in bilateral middle frontal gyrus, bilateral inferior temporal gyrus, right superior frontal gyrus, right insula and right fusiform gyrus. Most of them were mainly distributed in the DMN, fronto-parietal task control and salience network. Furthermore, it is notable that some hubs were present only in MCI patients and absent in NCs, such as left superior frontal gyrus and left insula. Meanwhile, some hubs were present only in NCs and not in patients with MCI. They were located in the right middle temporal gyrus, left precentral gyrus and left postcentral gyrus. These discriminative brain regions between MCI and NCs were distributed mainly in the DMN, fronto-parietal task control and sensory/somatomotor hand network.
Table 3. Hubs in MCI and NCs defined with the degree.
| AAL Number | Corresponding brain regions | Sub-networks | |||||||||||||||||||||||||||||||||||||||||||||||||||||||||||||||||||||||||||||||||||||||||||||||||
| MCI | 8 | Frontal_Mid_R | Fronto-parietal task control | ||||||||||||||||||||||||||||||||||||||||||||||||||||||||||||||||||||||||||||||||||||||||||||||||
| 56 | Fusiform_R | Default mode network | |||||||||||||||||||||||||||||||||||||||||||||||||||||||||||||||||||||||||||||||||||||||||||||||||
| 3 | Frontal_Sup_L | Default mode network | |||||||||||||||||||||||||||||||||||||||||||||||||||||||||||||||||||||||||||||||||||||||||||||||||
| 4 | Frontal_Sup_R | Default mode network | |||||||||||||||||||||||||||||||||||||||||||||||||||||||||||||||||||||||||||||||||||||||||||||||||
| 7 | Frontal_Mid_L | Default mode network | |||||||||||||||||||||||||||||||||||||||||||||||||||||||||||||||||||||||||||||||||||||||||||||||||
| 23 | Frontal_Sup_Medial_L | Default mode network | |||||||||||||||||||||||||||||||||||||||||||||||||||||||||||||||||||||||||||||||||||||||||||||||||
| 29 | Insula_L | Salience network | |||||||||||||||||||||||||||||||||||||||||||||||||||||||||||||||||||||||||||||||||||||||||||||||||
| 30 | Insula_R | Salience network | |||||||||||||||||||||||||||||||||||||||||||||||||||||||||||||||||||||||||||||||||||||||||||||||||
| 89 | Temporal_Inf_L | Default mode network | |||||||||||||||||||||||||||||||||||||||||||||||||||||||||||||||||||||||||||||||||||||||||||||||||
| 90 | Temporal_Inf_R | Default mode network | |||||||||||||||||||||||||||||||||||||||||||||||||||||||||||||||||||||||||||||||||||||||||||||||||
| NC | 7 | Frontal_Mid_L | Fronto-parietal task control | ||||||||||||||||||||||||||||||||||||||||||||||||||||||||||||||||||||||||||||||||||||||||||||||||
| 8 | Frontal_Mid_R | Fronto-parietal task control | |||||||||||||||||||||||||||||||||||||||||||||||||||||||||||||||||||||||||||||||||||||||||||||||||
| 4 | Frontal_Sup_R | Default mode network | |||||||||||||||||||||||||||||||||||||||||||||||||||||||||||||||||||||||||||||||||||||||||||||||||
| 30 | Insula_R | Salience network | |||||||||||||||||||||||||||||||||||||||||||||||||||||||||||||||||||||||||||||||||||||||||||||||||
| 86 | Temporal_Mid_R | Default mode network | |||||||||||||||||||||||||||||||||||||||||||||||||||||||||||||||||||||||||||||||||||||||||||||||||
| 1 | Precentral_L | Sensory/somatomotor Hand | |||||||||||||||||||||||||||||||||||||||||||||||||||||||||||||||||||||||||||||||||||||||||||||||||
| 56 | Fusiform_R | Default mode network | |||||||||||||||||||||||||||||||||||||||||||||||||||||||||||||||||||||||||||||||||||||||||||||||||
| 57 | Postcentral_L | Sensory/somatomotor Hand | |||||||||||||||||||||||||||||||||||||||||||||||||||||||||||||||||||||||||||||||||||||||||||||||||
| 90 | Temporal_Inf_R | Default mode network | |||||||||||||||||||||||||||||||||||||||||||||||||||||||||||||||||||||||||||||||||||||||||||||||||
| 89 | Temporal_Inf_L | Default mode network | |||||||||||||||||||||||||||||||||||||||||||||||||||||||||||||||||||||||||||||||||||||||||||||||||
| AAL: the automated anatomical labeling atlas. | |||||||||||||||||||||||||||||||||||||||||||||||||||||||||||||||||||||||||||||||||||||||||||||||||||
Altered topological properties of functional networks in MCI patients
Based on the FCNs estimated by SGR with λ = 21 and γ = 25, several global graph theory metrics as shown in Table 4, including clustering coefficients (Cp), shortest path length (Lp), normalized clustering coefficient (γ), normalized characteristic path length (λ), small-world (σ), global efficiency (Eglobal) and modularity (Q), were calculated to elaborate on the topological properties of functional networks in MCI and NC groups. As shown in Table 3, both groups fit γ=Cpreal / Cprand > 1, λ=Lpreal / Lprand ≈1 and σ=γ/λ > 1. Therefore, FCNs estimated by SGR in MCI patients and NCs showed small-world topological attributes [59]. This means that the brain networks of the two groups maintain an economic and efficient brain network that optimizes the balance between local specialization and global integration [60–62]. Further comparison suggested that the Lp values of MCI patients were lower than those in the NC groups (P<0.01), which indicated a reduction of network integration in global information processing in MCI patients. Moreover, the decreased values of γ and Q in MCI patients suggest a reduction of network segregation in local information processing.
Table 4. Comparison of topological properties between MCIs and NCs.
| MCI | NC | ||||||||||||||||||||||||||||||||||||||||||||||||||||||||||||||||||||||||||||||||||||||||||||||||||
| Cp | 0.125±0.003 | 0.147±0.006 | |||||||||||||||||||||||||||||||||||||||||||||||||||||||||||||||||||||||||||||||||||||||||||||||||
| Lp* | 0.746±0.003 | 0.759±0.005 | |||||||||||||||||||||||||||||||||||||||||||||||||||||||||||||||||||||||||||||||||||||||||||||||||
| γ* | 1.109±0.071 | 1.205±0.094 | |||||||||||||||||||||||||||||||||||||||||||||||||||||||||||||||||||||||||||||||||||||||||||||||||
| λ | 1.040±0.010 | 1.051±0.015 | |||||||||||||||||||||||||||||||||||||||||||||||||||||||||||||||||||||||||||||||||||||||||||||||||
| σ | 1.066±0.058 | 1.149±0.091 | |||||||||||||||||||||||||||||||||||||||||||||||||||||||||||||||||||||||||||||||||||||||||||||||||
| Eglobal | 0.271±0.001 | 0.278±0.002 | |||||||||||||||||||||||||||||||||||||||||||||||||||||||||||||||||||||||||||||||||||||||||||||||||
| Q* | 6.616±0.638 | 6.736±1.102 | |||||||||||||||||||||||||||||||||||||||||||||||||||||||||||||||||||||||||||||||||||||||||||||||||
| * P<0.01 | |||||||||||||||||||||||||||||||||||||||||||||||||||||||||||||||||||||||||||||||||||||||||||||||||||
Discussion
Here, we proposed a new method to estimate functional brain networks (FCNs) to improve the accuracy of FCN-aided disese diagnosis. To test the effectiveness of our proposed algorithm, we used it to estimate an FCN from experimental fMRI data of AD patients and controls. Estimated FCNs are used to identify MCI patients, which is important for early diagnosis and intervention. Our approach yielded competitive results through three main contributions:
We introduced a graph regularizer into the proposed FCN learning framework for estimating inter-similarity FCNs, and combined it with sparse penalty for constructing both sparse and inter-similarity FCNs, which illustrated that the proposed method scales well.
We used the estimated FCNs to identify MCIs from NCs, and our experimental results showed that the proposed method outperforms state-of-the-art methods. Indeed, it achieved an 88.19% classification accuracy based on a simple feature selection (by means of t-tests with a fixed p value) and classification (via linear support vector machines (SVMs) with default parameter C = 1) pipeline.
We explored the selected consensus features (i.e., network connections) in our method and found that most of the selected features tend to be biologically meaningful according to recent studies (Greicius, 2008; Albert et al., 2011), which further illustrated our method’s effectiveness. Moreover, the analysis of graph theory attributes based on our method can be used to further characterize altered patterns and pathological mechanisms underlying the topological properties of brain networks in MCI.
Our simple graph/manifold regularizer was used to estimate an inter-similarity FCNs for each subject. However, FCNs from different subjects tend to share some similar structures [18, 19] and thus the proposed method may lose group information. Therefore, we proposed the development and application of a “group constraint”, such as Group LASSO [63] or tensor low rank [5] to improve FCN computation.
The experiments in our methodological study here constitute a simple verification method for validating the effectiveness of the inter-similarity scheme, without considering other factors (e.g., similarity matrix or classification model). Therefore, we adopted the simplest Pearson Correlation matrix and linear SVM model. Future studies could further improve MCI classification performance.
The distribution of consensus connections and hub nodes indicated that the discriminative features obtained by our proposed method were mainly distributed in the frontal lobe, occipital lobe and parietal lobe of MCI patients. Projecting them into the corresponding subnetworks, we found that most of these brain regions were mainly distributed in the DMN, frontal parietal task control network, and sensory/somatic motor hand network, especially the DMN. Previous studies, such as [64] and [65], have pointed out that DMN facilitated the early diagnosis and prediction of AD. Our results also showed that DMN provided the most discriminating information, which was verified by our proposed method, whose reproducibility we demonstrated here.
The topological properties analyzed in our study suggested that both MCI patients and NCs fitted the small-world attribute in the global topological property. That is, the brain network of MCI and NC groups conform to “economic small-world”, which can provide rapid, real-time information processing across separate brain regions to maximize efficiency with minimal cost, eliciting resilience against pathological attacks [60, 61, 66]. Further comparison suggested that the value of Lp in MCI patients was lower than that in NC groups, which indicated a reduction of network integration in global information processing in the former. Moreover, the decreased values of γ and Q in MCI patients further suggested a reduction of network segregation in local information processing. Therefore, the altered pattern of topological properties obtained by our proposed method indicated a disruption of network integration and segregation of functions in MCI patients, which further demonstrated the pathological mechanisms of FBN.
In summary, the FCN commonly has more topological structures than just sparsity [13, 14]. Due to the limited understanding of the human brain, estimation of the “ideal” FCNs to explore brain pattern or neuro-disease diagnosis is still an active field of research. Here, we focused on the inter-similarity of the FCNs and formulated it into graph regularizer constraints and validated the proposed method on MCI classification. Our results illustrated that additional topological priors can effectively improve diagnosis performance. Our post-hoc analyses further showed that more biologically meaningful functional brain connections were obtained by incorporating the inter-similarity prior.
Materials and Methods
Data acquisition
To test the proposed method, we analyzed publicly-available neuroimaging data from the Alzheimer’s Disease Neuroimaging Initiative (ADNI) database (http://adni.loni.ucla.edu) [31]. ANDI was launched in 2003 by the National Institute on Aging, the National Institute of Biomedical Imaging and Bioengineering, the Food and Drug Administration, private pharmaceutical companies and nonprofit organizations. Initially, the goal of ADNI was to define biomarkers for use in clinical trials and to determine the best way to measure the treatment effects of AD therapeutics.
For this study, we analyzed data for 127 participants, including 63 MCIs and 64 NCs. The scanning parameters included: TR/TE = 3000/30mm, flip angle = 80, imaging matrix=64×64, 48 slices, 140 volumes, and voxel thickness = 3.3mm. SPM8 toolbox (https://www.fil.ion.ucl.ac.uk/spm/software/spm8/) and DPARSFA (version 2.2) [32] were used to preprocess the fMRI data according to the standard, well-established pipeline. The preprocessing pipeline includes removing the first 10 volumes, Slice timing, Realign, Normalize to the MNI space, Spatially smooth, Temporally Detrend, Regression out covariates based on friction 24 and Temporally filtering (0.01-0.08 Hz). For alleviating the head motion effect and artifacts, we followed previously published strategies [33, 34]. We calculated framewise displacement (FD) and excluded subjects with more than 2.5 min (50 frames) data of FD>0.5 from subsequent analyses [35]. Finally, depending on the automated anatomical labeling (AAL) atlas [36], the pre-processed BOLD time series signals were partitioned into 116 ROIs. At last, we put these time series into a data matrix
Functional brain network estimation
After obtaining the fMRI data matrix X from the R-fMRI data, the subsequent task is the FCN estimation. The most commonly used FCN estimation methods are those based on correlation, and since they are more sensitive than some complex higher-order methods [14], we focused on the former in this study. For better notation, we first define the data matrix (i.e., BOLD signal matrix),
Our methods
As we mentioned above, the regularization-based FCN estimation framework provides an effective scheme for incorporating the biological or physical priors of FCN. In this paper, we try to encode the inter-similarity prior (similar nodes tend to have similar connections) into the FCN estimation. The basic motivation is given in Figure 5.
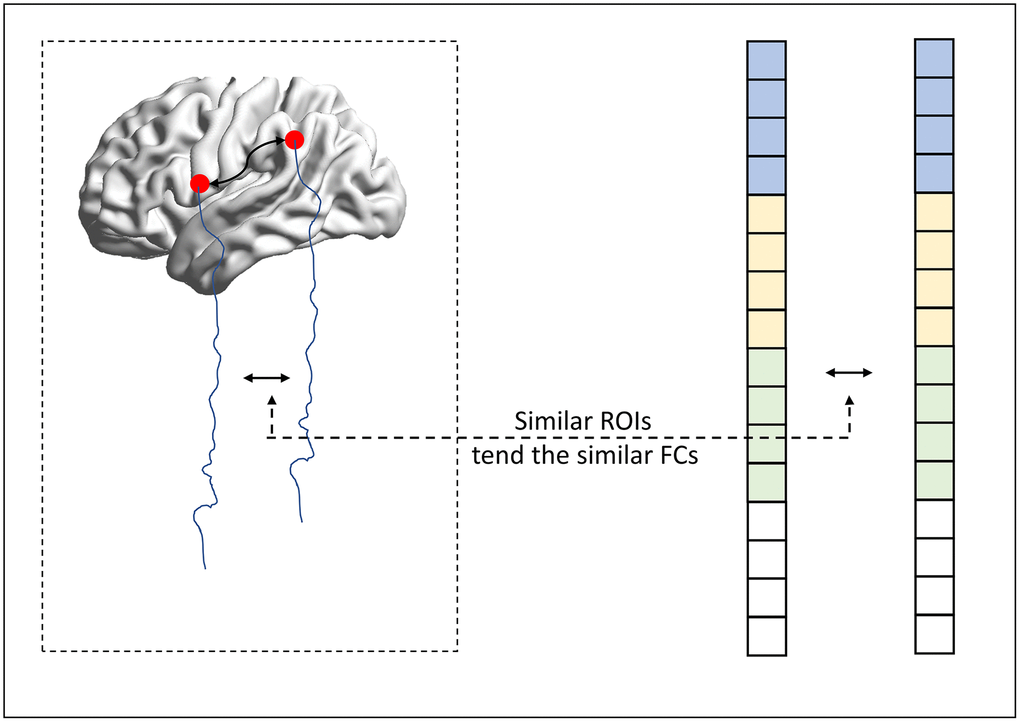
Figure 5. The motivation of the proposed method.
In particular, we supposed that if two ROIs are defined to be similar, indicating that the connections from these two ROIs should have a similar connection pattern. In this way, we naturally formulate the inter-similarity prior into a graph regularizer (namely MR) penalty, which is given as follows:
where
where L is the Laplacian matrix computed as
Moreover, since the estimated FCN should also be sparse, we further incorporate the l1-norm penalty into the FCN estimation, and the sparse and graph regularizer (namely SGR) is estimated as follows:
In addition, we adopt the partial correlation for the date-fitting term due to its efficiency and effectiveness.
For Eq, (8), based on the regularization framework for FCN estimation, we give the optimization algorithm for estimating FCN by SGR. Note that, the objective function of Eq. (8) is convex but indifferentiable due to the
where
Then, for the regularization term
where
Table 5. Algorithm of SGR-based FCN estimation.
| Input: X //observed data Output: W //functional brain network |
| Initialize W;
while not converge end |
Experimental setting
To validate the proposed FCN method, we conducted experiments on training a classifier for identifying MCI from NCs, based on estimated FCNs. Also, we adopted the SR and PC methods as a baseline for comparison. Since the FCN matrix is symmetric, we used its upper triangular elements as input features for classification. Unfortunately, in our experiment, each FCN had 116 nodes, and thus could produce 6,670 features (corresponding to 6,670 functional connections between 116 ROIs). Compared to the sample size (less than two hundred), the feature dimension was very high, which not only implied expensive computations but would also affect the generalization of the proposed methods. As pointed out in [18], both the feature selection and classifier design have a big influence on accuracy. Thus, in this study, we adopted the simplest feature selection method (t-test with p value < 0.01) and the most popular used SVM classifier [58], since our main focus was FCN estimation. In other words, had we not done so, it would have been difficult to conclude whether the FCN construction methods or the feature selection/classification methods contributed to the ultimate performance.
Due to the small sample size, we used the leave one out (LOO) cross-validation strategy to assess the performance of the methods, in which only one subject is left out for testing while the others are used to train the models and get the optimal parameters. To choose optimal parameters, an inner LOO cross-validation was conducted on the training data by grid-search strategy. More specifically, for the regularized parameters
Author Contributions
All authors developed proposed algorithm, architecture. Wei-kai Li and Xiao-wen Xu designed the evaluation experiments. Xin Gao and Wei Jiang preprocessed the fMRI. Pei-jun Wang revised the manuscript. All authors contributed to preparation of the article, figures, and charts.
Conflicts of Interest
There are no conflicts of interest including any financial, personal, or other relationships with people or organizations for any of the coauthors related to the work described in the article.
Funding
This work was partly supported by Natural Science Foundation Project of CQCSTC (No. cstc2018jcyj A0398), Scientific Research Subjects of Shanghai Universal Medical Imaging Technology Limited Company (No. UV2020Z02), Shanghai Municipal Planning Commission of Science and Research Fund (No. 201740010), Shanghai Municipal Commission of Economy and Informatization, Special Fund for Artificial Intelligence Innovation and Development (No. 2019-RGZN-01079), National Natural Science Foundation of China (Nos. 81830059, 81571655, and 81771889), Shanghai Municipal Commission of Health and Family Planning Smart Medical Special Research Project (No. 2018ZHYL0105), and the Fundamental Research Funds for the Central Universities (No. 22120190219).
References
- 1. Gaugler J, James B, Johnson T, Scholz K, Weuve J. 2016 Alzheimer's disease facts and figures. Alzheimers Dement. 2016; 12:459–509. https://doi.org/10.1016/j.jalz.2016.03.001 [PubMed]
- 2. Bain LJ, Jedrziewski K, Morrison-Bogorad M, Albert M, Cotman C, Hendrie H, Trojanowski JQ. Healthy brain aging: a meeting report from the sylvan M. Cohen annual retreat of the university of pennsylvania institute on aging. Alzheimers Dement. 2008; 4:443–46. https://doi.org/10.1016/j.jalz.2008.08.006 [PubMed]
- 3. Misra C, Fan Y, Davatzikos C. Baseline and longitudinal patterns of brain atrophy in MCI patients, and their use in prediction of short-term conversion to AD: results from ADNI. Neuroimage. 2009; 44:1415–22. https://doi.org/10.1016/j.neuroimage.2008.10.031 [PubMed]
- 4. Grundman M, Petersen RC, Ferris SH, Thomas RG, Aisen PS, Bennett DA, Foster NL, Jack CR
Jr , Galasko DR, Doody R, Kaye J, Sano M, Mohs R, et al, and Alzheimer’s Disease Cooperative Study. Mild cognitive impairment can be distinguished from Alzheimer disease and normal aging for clinical trials. Arch Neurol. 2004; 61:59–66. https://doi.org/10.1001/archneur.61.1.59 [PubMed] - 5. Gao X, Xu X, Hua X, Wang P, Li W, Li R. Group Similarity Constraint Functional Brain Network Estimation for Mild Cognitive Impairment Classification. Front Neurosci. 2020; 14:165. https://doi.org/10.3389/fnins.2020.00165 [PubMed]
- 6. Xu X, Li W, Mei J, Tao M, Wang X, Zhao Q, Liang X, Wu W, Ding D, Wang P. Feature selection and combination of information in the functional brain connectome for discrimination of mild cognitive impairment and analyses of altered brain patterns. Front Aging Neurosci. 2020; 12:28. https://doi.org/10.3389/fnagi.2020.00028 [PubMed]
- 7. Brunetti M, Belardinelli P, Gratta CD, Pizzella V, Penna SD, Ferretti A, Caulo M, Cianflone F, Belardinelli MO, Romani GL. Human brain activation elicited by the localization of sounds delivering at attended or unattended positions: an fMRI/MEG study. Cognitive Processing. 2006; 7:116–7. https://doi.org/10.1007/s10339-006-0093-3
- 8. Lee JH, Durand R, Gradinaru V, Zhang F, Goshen I, Kim DS, Fenno LE, Ramakrishnan C, Deisseroth K. Global and local fMRI signals driven by neurons defined optogenetically by type and wiring. Nature. 2010; 465:788–92. https://doi.org/10.1038/nature09108 [PubMed]
- 9. Whittingstall K, Wilson D, Schmidt M, Stroink G. Correspondence of visual evoked potentials with FMRI signals in human visual cortex. Brain Topogr. 2008; 21:86–92. https://doi.org/10.1007/s10548-008-0069-y [PubMed]
- 10. Rosa MJ, Portugal L, Hahn T, Fallgatter AJ, Garrido MI, Shawe-Taylor J, Mourao-Miranda J. Sparse network-based models for patient classification using fMRI. Neuroimage. 2015; 105:493–506. https://doi.org/10.1016/j.neuroimage.2014.11.021 [PubMed]
- 11. Stam CJ. Modern network science of neurological disorders. Nat Rev Neurosci. 2014; 15:683–95. https://doi.org/10.1038/nrn3801 [PubMed]
- 12. Wee CY, Yap PT, Zhang D, Denny K, Browndyke JN, Potter GG, Welsh-Bohmer KA, Wang L, Shen D. Identification of MCI individuals using structural and functional connectivity networks. Neuroimage. 2012; 59:2045–56. https://doi.org/10.1016/j.neuroimage.2011.10.015 [PubMed]
- 13. Rubinov M, Sporns O. Weight-conserving characterization of complex functional brain networks. Neuroimage. 2011; 56:2068–79. https://doi.org/10.1016/j.neuroimage.2011.03.069 [PubMed]
- 14. Jin L, Min L, Yi P, Lan W, Zheng R, Wu FX, Wang J. Complex Brain Network Analysis and Its Applications to Brain Disorders: A Survey. Complexity. 2017; 2017:1–27. https://doi.org/10.1155/2017/8362741
- 15. Gotts SJ, Simmons WK, Milbury LA, Wallace GL, Cox RW, Martin A. Fractionation of social brain circuits in autism spectrum disorders. Brain. 2012; 135:2711–25. https://doi.org/10.1093/brain/aws160 [PubMed]
- 16. de Theije CG, Wu J, da Silva SL, Kamphuis PJ, Garssen J, Korte SM, Kraneveld AD. Pathways underlying the gut-to-brain connection in autism spectrum disorders as future targets for disease management. Eur J Pharmacol. 2011 (Suppl 1); 668:S70–80. https://doi.org/10.1016/j.ejphar.2011.07.013 [PubMed]
- 17. Fan Y, Browndyke JN. MCI diagnosis via manifold based classification of functional brain networks. Alzheimers Dement. 2010; 6:S16. https://doi.org/10.1016/j.jalz.2010.05.044
- 18. Wee CY, Yap PT, Zhang D, Wang L, Shen D. Group-constrained sparse fMRI connectivity modeling for mild cognitive impairment identification. Brain Struct Funct. 2014; 219:641–56. https://doi.org/10.1007/s00429-013-0524-8 [PubMed]
- 19. Yu R, Zhang H, An L, Chen X, Wei Z, Shen D. Correlation-Weighted Sparse Group Representation for Brain Network Construction in MCI Classification. Med Image Comput Comput Assist Interv. 2016; 9900:37–45. https://doi.org/10.1007/978-3-319-46720-7_5 [PubMed]
- 20. Liu F, Wee CY, Chen H, Shen D. Inter-modality relationship constrained multi-task feature selection for AD/MCI classification. Med Image Comput Comput Assist Interv. 2013; 16:308–15. https://doi.org/10.1007/978-3-642-40811-3_39 [PubMed]
- 21. Supekar K, Menon V, Rubin D, Musen M, Greicius MD. Network analysis of intrinsic functional brain connectivity in Alzheimer’s disease. PLoS Comput Biol. 2008; 4:e1000100. https://doi.org/10.1371/journal.pcbi.1000100 [PubMed]
- 22. Huang S, Li J, Sun L, Liu J, Wu T, Chen K, Fleisher A, Reiman E, Ye J. (2009). Learning Brain Connectivity of Alzheimer's Disease from Neuroimaging Data. Advances in Neural Information Processing Systems 22: Conference on Neural Information Processing Systems 2009 Proceedings of A Meeting Held 7-10 December 2009, Vancouver, British Columbia, Canada, pp. 808–16.
- 23. Li W, Qiao L, Zhang L, Wang Z, Shen D. Functional brain network estimation with time series self-scrubbing. IEEE J Biomed Health Inform. 2019; 23:2494–504. https://doi.org/10.1109/JBHI.2019.2893880 [PubMed]
- 24. Smith SM, Miller KL, Salimi-Khorshidi G, Webster M, Beckmann CF, Nichols TE, Ramsey JD, Woolrich MW. Network modelling methods for FMRI. Neuroimage. 2011; 54:875–91. https://doi.org/10.1016/j.neuroimage.2010.08.063 [PubMed]
- 25. Li W, Wang Z, Zhang L, Qiao L, Shen D. Remodeling Pearson’s Correlation for functional brain network estimation and autism spectrum disorder identification. Front Neuroinform. 2017; 11:55. https://doi.org/10.3389/fninf.2017.00055 [PubMed]
- 26. Lee H, Lee DS, Kang H, Kim BN, Chung MK. Sparse brain network recovery under compressed sensing. IEEE Trans Med Imaging. 2011; 30:1154–65. https://doi.org/10.1109/TMI.2011.2140380 [PubMed]
- 27. Zhou L, Wang L, Ogunbona P. (2014). Discriminative Sparse Inverse Covariance Matrix: Application in Brain Functional Network Classification. IEEE Conference on Computer Vision and Pattern Recognition, pp. 3097–104. https://doi.org/10.1109/CVPR.2014.396
- 28. Qiao L, Zhang H, Kim M, Teng S, Zhang L, Shen D. Estimating functional brain networks by incorporating a modularity prior. Neuroimage. 2016; 141:399–407. https://doi.org/10.1016/j.neuroimage.2016.07.058 [PubMed]
- 29. Wee CY, Yap PT, Shen D. Diagnosis of Autism Spectrum Disorders Using Temporally Distinct Resting-State Functional Connectivity Networks. Version 2. CNS Neurosci Ther. 2016; 22:212–9. https://doi.org/10.1111/cns.12499 [PubMed]
- 30. Li W, Zhang L, Qiao L, Shen D. Toward a better estimation of functional brain network for mild cognitive impairment identification: a transfer learning view. IEEE J Biomed Health Inform. 2020; 24:1160–68. https://doi.org/10.1109/JBHI.2019.2934230 [PubMed]
- 31. Jack CR
Jr , Bernstein MA, Fox NC, Thompson P, Alexander G, Harvey D, Borowski B, Britson PJ, Whitwell JL, Ward C, Dale AM, Felmlee JP, Gunter JL, et al. The Alzheimer’s disease neuroimaging initiative (ADNI): MRI methods. J Magn Reson Imaging. 2008; 27:685–91. https://doi.org/10.1002/jmri.21049 [PubMed] - 32. Chao-Gan Y, Yu-Feng Z. DPARSF: a MATLAB toolbox for “pipeline” data analysis of resting-state fMRI. Front Syst Neurosci. 2010; 4:13. https://doi.org/10.3389/fnsys.2010.00013 [PubMed]
- 33. Chen X, Zhang H, Gao Y, Wee CY, Li G, Shen D, and Alzheimer's Disease Neuroimaging Initiative. High-order resting-state functional connectivity network for MCI classification. Version 2. Hum Brain Mapp. 2016; 37:3282–96. https://doi.org/10.1002/hbm.23240 [PubMed]
- 34. Chen X, Zhang H, Zhang L, Shen C, Lee SW, Shen D. Extraction of dynamic functional connectivity from brain grey matter and white matter for MCI classification. Hum Brain Mapp. 2017; 38:5019–34. https://doi.org/10.1002/hbm.23711 [PubMed]
- 35. Power JD, Barnes KA, Snyder AZ, Schlaggar BL, Petersen SE. Spurious but systematic correlations in functional connectivity MRI networks arise from subject motion. Neuroimage. 2012; 59:2142–54. https://doi.org/10.1016/j.neuroimage.2011.10.018 [PubMed]
- 36. Tzourio-Mazoyer N, Landeau B, Papathanassiou D, Crivello F, Etard O, Delcroix N, Mazoyer B, Joliot M. Automated anatomical labeling of activations in SPM using a macroscopic anatomical parcellation of the MNI MRI single-subject brain. Neuroimage. 2002; 15:273–89. https://doi.org/10.1006/nimg.2001.0978 [PubMed]
- 37. Li R, Zhang X, Li H, Zhang L, Lu Z, Chen J. An approach for brain-controlled prostheses based on scene graph steady-state visual evoked potentials. Brain Res. 2018; 1692:142–53. https://doi.org/10.1016/j.brainres.2018.05.018 [PubMed]
- 38. Zhang X, Li R, Li Y. Research on Brain Control Technology. Journal of Vibration, Measurement & Diagnosis. 2014; 34:205–11.
- 39. Smith SM, Vidaurre D, Beckmann CF, Glasser MF, Jenkinson M, Miller KL, Nichols TE, Robinson EC, Salimi-Khorshidi G, Woolrich MW, Barch DM, Uğurbil K, Van Essen DC. Functional connectomics from resting-state fMRI. Trends Cogn Sci. 2013; 17:666–82. https://doi.org/10.1016/j.tics.2013.09.016 [PubMed]
- 40. Marrelec G, Krainik A, Duffau H, Pélégrini-Issac M, Lehéricy S, Doyon J, Benali H. Partial correlation for functional brain interactivity investigation in functional MRI. Neuroimage. 2006; 32:228–37. https://doi.org/10.1016/j.neuroimage.2005.12.057 [PubMed]
- 41. Peng J, Wang P, Zhou N, Zhu J. Partial correlation estimation by joint sparse regression models. J Am Stat Assoc. 2009; 104:735–46. https://doi.org/10.1198/jasa.2009.0126 [PubMed]
- 42. Seixas FL, Zadrozny B, Laks J, Conci A, Muchaluat Saade DC. A bayesian network decision model for supporting the diagnosis of dementia, Alzheimer’s disease and mild cognitive impairment. Comput Biol Med. 2014; 51:140–58. https://doi.org/10.1016/j.compbiomed.2014.04.010 [PubMed]
- 43. Zhuang J, LaConte S, Peltier S, Zhang K, Hu X. Connectivity exploration with structural equation modeling: an fMRI study of bimanual motor coordination. Neuroimage. 2005; 25:462–70. https://doi.org/10.1016/j.neuroimage.2004.11.007 [PubMed]
- 44. Van Horn JD. Reproducibility of results and dynamic casual modeling in fMRI: the new perspectives in fMRI research award. J Cogn Neurosci. 2003; 15:923–24. https://doi.org/10.1162/089892903770007308 [PubMed]
- 45. Li H, Zhu X, Fan Y. Identification of Multi-scale Hierarchical Brain Functional Networks Using Deep Matrix Factorization. Med Image Comput Comput Assist Interv. 2018; 11072:223–231. https://doi.org/10.1007/978-3-030-00931-1_26 [PubMed]
- 46. Zhou Y, Qiao L, Li W, Zhang L, Shen D. Simultaneous estimation of low- and high-order functional connectivity for identifying mild cognitive impairment. Front Neuroinform. 2018; 12:3. https://doi.org/10.3389/fninf.2018.00003 [PubMed]
- 47. Higgins IA, Kundu S, Guo Y. Integrative bayesian analysis of brain functional networks incorporating anatomical knowledge. Neuroimage. 2018; 181:263–78. https://doi.org/10.1016/j.neuroimage.2018.07.015 [PubMed]
- 48. Wang Y, Lin K, Qi Y, Lian Q, Feng S, Wu Z, Pan G. Estimating brain connectivity with varying-length time lags using a recurrent neural network. IEEE Trans Biomed Eng. 2018; 65:1953–63. https://doi.org/10.1109/TBME.2018.2842769 [PubMed]
- 49. Huang S, Li J, Sun L, Ye J, Fleisher A, Wu T, Chen K, Reiman E, and Alzheimer’s Disease NeuroImaging Initiative. Learning brain connectivity of Alzheimer’s disease by sparse inverse covariance estimation. Neuroimage. 2010; 50:935–49. https://doi.org/10.1016/j.neuroimage.2009.12.120 [PubMed]
- 50. Yi L, Wang J, Jia L, Zhao Z, Lu J, Li K, Jia J, He Y, Jiang C, Han Y. Structural and functional changes in subcortical vascular mild cognitive impairment: a combined voxel-based morphometry and resting-state fMRI study. PLoS One. 2012; 7:e44758. https://doi.org/10.1371/journal.pone.0044758 [PubMed]
- 51. Donoho DL, Elad M. Optimally sparse representation in general (nonorthogonal) dictionaries via L minimization. Proc Natl Acad Sci USA. 2003; 100:2197–202. https://doi.org/10.1073/pnas.0437847100 [PubMed]
- 52. Meinshausen N, Bühlmann P. High-dimensional graphs and variable selection with the Lasso. Annals of Statistics. 2006; 34:1436–62. https://doi.org/10.1214/009053606000000281
- 53. Zhao YB. New and improved conditions for uniqueness of sparsest solutions of underdetermined linear systems ☆. Appl Math Comput. 2013; 224:58–73. https://doi.org/10.1016/j.amc.2013.08.010
- 54. Tomioka R, Sugiyama M. Dual Augmented Lagrangian Method for Efficient Sparse Reconstruction. IEEE Signal Processing Letters. 2009; 16:1067–70. https://doi.org/10.1109/LSP.2009.2030111
- 55. Combettes PL, Pesquet JC. Proximal Splitting Methods in Signal Processing. In: Bauschke H., Burachik R., Combettes P., Elser V., Luke D., Wolkowicz H. (eds) Fixed-Point Algorithms for Inverse Problems in Science and Engineering. Springer Optimization and Its Applications, vol 49. Springer, New York, NY. https://doi.org/10.1007/978-1-4419-9569-8_10
- 56. Bertsekas DP. Incremental Gradient, Subgradient, and Proximal Methods for Convex Optimization: A Survey. Optimization. 2015.
- 57. Nemirovsky AS, Yudin DB. Problem complexity and method efficiency in optimization. Chichester ; New York : Wiley, 1983.
- 58. Chang CC, Lin CJ. LIBSVM: A library for support vector machines. ACM Trans Intell Syst Technol. 2007; 2:389–96.
- 59. Watts DJ, Strogatz SH. Collective dynamics of ‘Small-world’ networks. Nature. 1998; 393:440–42. https://doi.org/10.1038/30918 [PubMed]
- 60. Sporns O, Zwi JD. The small world of the cerebral cortex. Neuroinformatics. 2004; 2:145–62. https://doi.org/10.1385/NI:2:2:145 [PubMed]
- 61. Sporns O. The human connectome: a complex network. Ann N Y Acad Sci. 2011; 1224:109–25. https://doi.org/10.1111/j.1749-6632.2010.05888.x [PubMed]
- 62. Achard S, Bullmore E. Efficiency and cost of economical brain functional networks. PLoS Comput Biol. 2007; 3:e17. https://doi.org/10.1371/journal.pcbi.0030017 [PubMed]
- 63. Yuan M, Lin Y. Model Selection and Estimation in Regression with Grouped Variables. Journal of the Royal Statistical Society. 2006; 68:49–67. https://doi.org/10.1111/j.1467-9868.2005.00532.x
- 64. Shu N, Wang X, Bi Q, Zhao T, Han Y. Disrupted topologic efficiency of white matter structural connectome in individuals with subjective cognitive decline. Radiology. 2018; 286:229–38. https://doi.org/10.1148/radiol.2017162696 [PubMed]
- 65. Pereira JB, Mijalkov M, Kakaei E, Mecocci P, Vellas B, Tsolaki M, Kloszewska I, Soininen H, Spenger C, Lovestone S, Simmons A, Wahlund LO, Volpe G, Westman E. Disrupted network topology in patients with stable and progressive mild cognitive impairment and Alzheimer’s disease. Cereb Cortex. 2016; 26:3476–93. https://doi.org/10.1093/cercor/bhw128 [PubMed]
- 66. Liao X, Vasilakos AV, He Y. Small-world human brain networks: perspectives and challenges. Neurosci Biobehav Rev. 2017; 77:286–300. https://doi.org/10.1016/j.neubiorev.2017.03.018 [PubMed]