


Introduction
The dominantly inherited spinocerebellar ataxias (SCAs) are a large class of neurodegenerative diseases [1]. More than 40 genetically distinct SCAs have been defined, of which the most common (SCA1, SCA2, SCA3, SCA6 and SCA7) are caused by amplification of the CAG repeat encoding glutamine in the affected genes [2]. Considerable variability has been found in the disease characteristics of SCAs, partly because of different degrees of CAG repeat amplification. More repeat expansion is always associated with earlier symptom onset and broader neurological symptoms. Additionally, the neuropathological and clinical manifestations of each subtype are not exactly the same [3]. SCA1 can emerge at any developmental stage from infancy to adulthood. Among the SCA subtypes, SCA1 develops the fastest and is accompanied by cerebellar and noncerebellar symptoms. SCA2 usually manifests as progressive ataxia, oculomotor retardation and sensorimotor neuropathy. Extrapyramidal manifestations, including Parkinson’s disease, motor weakness, ocular palsy and cognitive impairment, may also occur. SCA3, also known as Machado-Joseph disease, is characterized by progressive ataxia and spasm [4–6]. SCA6 starts later than other polyQ ataxias; this subtype is considered a relatively pure cerebellar syndrome with few extracerebellar signs [7]. Although the main symptom of SCAs is ataxia caused by cerebellar damage, patients with SCAs also frequently have pyramidal symptoms, which are often aggravated as the disease progresses. However, there are few quantitative studies on the extent of damage to the pyramidal tract in SCA patients.
Transcranial magnetic stimulation (TMS) is a relatively safe and noninvasive means of electrically stimulating the brain by electromagnetic induction. This technique is currently being used in the diagnosis and treatment of many diseases. Because of its convenience and noninvasiveness, TMS has a high rate of patient compliance [8, 9]. TMS has been used to evaluate the function of the pyramidal tract, and central motor conduction time (CMCT) is one of the indices calculated from motor evoked potentials (MEPs) to measure pyramidal tract dysfunction. As a marker of conduction deceleration caused by abnormal upper motor neurons, CMCT has been explored in several diseases, such as cerebral small vessel disease and hereditary spastic paraplegia [10]. However, patients with SCAs often suffer from pyramidal tract involvement, and different subtypes do not have exactly the same pathogenesis. In this context, can CMCT be used as a marker of SCA pathogenesis and a means of differentiating SCA subtypes?
Studies that address this question are scarce. In some previous studies, TMS was used in patients with SCAs, and CMCT showed different degrees of prolongation in patients compared with the control group [16]. However, the sample sizes of these studies were small, and often, only one subtype of patients was selected. The aim of the present meta-analysis was to integrate the data, explore the comprehensive performance of CMCT in SCAs, identify the differences in CMCT among different subtypes and reveal the pathological differences among different subtypes of SCAs. We also investigated CMCT as a potential marker for observing the progress and prognosis of the disease, thus providing a future direction for the diagnosis and treatment of SCAs [14, 15].
Results
Search results
By using keywords in the PubMed, Embase and Web of Science databases, we obtained 648 records after removing duplicate records. After the preliminary reading of the title and abstract, 16 articles that fit the topic were read in full-text form. Based on the exclusion criteria, 8 articles were eliminated (see Figure 1 for the reasons), and 8 articles were included in the meta-analysis.
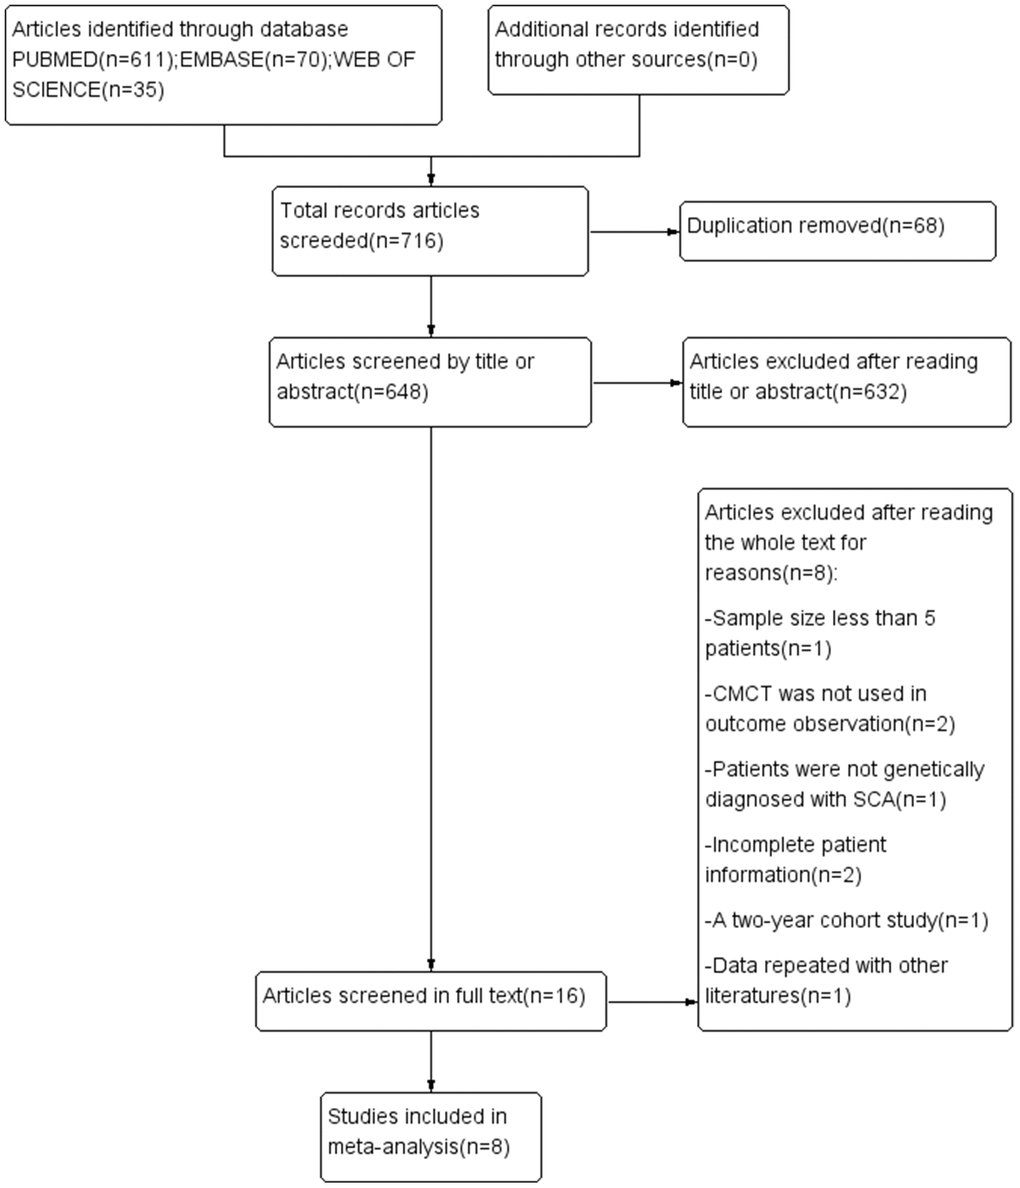
Figure 1. PRISMA flowchart of the studies included in the meta-analysis. SCA, spinocerebellar ataxia; CMCT, central motor conduction time.
Study characteristics
The characteristics of the meta-analysis studies are shown in Table 1. In general, eight studies involved 4 common subtypes of SCAs. The studies involved different regions and countries over a long time span (from 1998 to 2016). By combining data across studies, we obtained new SCA samples (SCA1 = 28, SCA2 = 81, SCA3 = 39 and SCA6 = 25). The total number of controls was 200. From the observation data, we found that among the four subtypes included in this study, SCA6 had the latest onset age and the longest course of disease. There was no significant difference among the other three subtypes. Regarding CAG length, SCA6 tended to be the shortest, and SCA3 tended to be the longest, while SCA1 and SCA2 were not significantly different [16–23].
Table 1. Study and patient characteristics.
| Genotype | Author | Year | Country/district | Sample size | Men (n) | Age (y) | Disease duration (y) | CAG | Location | CMCT (ms) | |||||||||||||||||||||||||||||||||||||||||||||||||||||||||||||||||||||||||||||||||||||||||
| SCA1 | T Yokota | 1998 | Japan | 10 | NR | 41.2±15.1 | 7.1±5.2 | NR | upper limbs/lower limbs | 9.5±1.6/21.3±3.5 | |||||||||||||||||||||||||||||||||||||||||||||||||||||||||||||||||||||||||||||||||||||||||
| Peter Schwenkreis | 2002 | Germany | 3 | 3 | 42.3±8.7 | 5.7±5.9 | 50.7±4.6 | upper limbs | 10.3±4.7 | ||||||||||||||||||||||||||||||||||||||||||||||||||||||||||||||||||||||||||||||||||||||||||
| Ketan Jhunjhunwala | 2013 | India | 15 | 11 | 28.0±10.9 | 4.9±3.1 | 55.6±7.3 | upper limbs | 8.9±2.6 | ||||||||||||||||||||||||||||||||||||||||||||||||||||||||||||||||||||||||||||||||||||||||||
| SCA2 | T Yokota | 1998 | Japan | 8 | NR | 46.8±10.0 | 14.3±5.7 | NR | upper limbs/lower limbs | 5.1±0.4/13.1±1.6 | |||||||||||||||||||||||||||||||||||||||||||||||||||||||||||||||||||||||||||||||||||||||||
| D.A. Restivo | 2000 | Italy | 18 | 12 | 48.4±14.6 | 12.3±7.2 | 40.6±2.9 | upper limbs/lower limbs | 6.3±1.4/19.2±7.0 | ||||||||||||||||||||||||||||||||||||||||||||||||||||||||||||||||||||||||||||||||||||||||||
| Peter Schwenkreis | 2002 | Germany | 7 | 3 | 36.6±4.1 | 8.7±3.5 | 40.5±1.7 | upper limbs | 6.6±0.7 | ||||||||||||||||||||||||||||||||||||||||||||||||||||||||||||||||||||||||||||||||||||||||||
| Ketan Jhunjhunwala | 2013 | India | 11 | 10 | 29.9±9.5 | 6.0±5.6 | 43.1±2.0 | upper limbs | 6.5±1.1 | ||||||||||||||||||||||||||||||||||||||||||||||||||||||||||||||||||||||||||||||||||||||||||
| Luis Velázquez-Pérez | 2016 | Cuba | 37 | 11 | 40.4±11.0 | presymptomatic | 36.3±2.3 | lower limbs | 20.2±7.9 | ||||||||||||||||||||||||||||||||||||||||||||||||||||||||||||||||||||||||||||||||||||||||||
| SCA3 | T Yokota | 1998 | Japan | 10 | NR | 43.9±11.0 | 8.2±5.2 | NR | upper limbs/lower limbs | 4.5±0.8/13.2±0.9 | |||||||||||||||||||||||||||||||||||||||||||||||||||||||||||||||||||||||||||||||||||||||||
| Peter Schwenkreis | 2002 | Germany | 12 | 8 | 44.8±12.8 | 8.5±4.6 | 73.0±3.6 | upper limbs | 6.9±0.9 | ||||||||||||||||||||||||||||||||||||||||||||||||||||||||||||||||||||||||||||||||||||||||||
| Ketan Jhunjhunwala | 2013 | India | 6 | 2 | 38.8±5.5 | 6.0±2.5 | 71.3±1.5 | upper limbs | 6.8±1.5 | ||||||||||||||||||||||||||||||||||||||||||||||||||||||||||||||||||||||||||||||||||||||||||
| Michelle A. Farrar | 2016 | Australia | 11 | 5 | 44.9±11.6 | 9.8±6.1 | 70.9±3.0 | upper limbs | 7.5±0.4 | ||||||||||||||||||||||||||||||||||||||||||||||||||||||||||||||||||||||||||||||||||||||||||
| SCA6 | Peter Schwenkreis | 2002 | Germany | 9 | 6 | 56.1±10.0 | 6.9±4.0 | 23.1±2.1 | upper limbs | 6.9±1.1 | |||||||||||||||||||||||||||||||||||||||||||||||||||||||||||||||||||||||||||||||||||||||||
| Jen-Tse Chen | 2004 | Taiwan | 9 | 5 | 55.7±8.6 | 11.1±6.8 | NR | upper limbs/lower limbs | 9.1±1.3/18.1±1.9 | ||||||||||||||||||||||||||||||||||||||||||||||||||||||||||||||||||||||||||||||||||||||||||
| Kenji Sakuma | 2005 | Japan | 7 | 1 | 68.4±7.0 | 21.1±10.6 | 24.0±2.4 | upper limbs | 7.1±1.7 | ||||||||||||||||||||||||||||||||||||||||||||||||||||||||||||||||||||||||||||||||||||||||||
| Control | T Yokota | 1998 | Japan | 16 | NR | NR | - | - | upper limbs/lower limbs | 4.8±1.1/13.0±1.7 | |||||||||||||||||||||||||||||||||||||||||||||||||||||||||||||||||||||||||||||||||||||||||
| D.A. Restivo | 2000 | Italy | 20 | 12 | 44.4±14.8 | - | - | upper limbs/lower limbs | 5.9±0.8/12.1±3.1 | ||||||||||||||||||||||||||||||||||||||||||||||||||||||||||||||||||||||||||||||||||||||||||
| Peter Schwenkreis | 2002 | Germany | 14 | 9 | 40.1±13.3 | - | - | upper limbs | 6.6±1.1 | ||||||||||||||||||||||||||||||||||||||||||||||||||||||||||||||||||||||||||||||||||||||||||
| Jen-Tse Chen | 2004 | Taiwan | 10 | 6 | 52.1±5.0 | - | - | upper limbs/lower limbs | 6.9±0.5/15.0±1.0 | ||||||||||||||||||||||||||||||||||||||||||||||||||||||||||||||||||||||||||||||||||||||||||
| Kenji Sakuma | 2005 | Japan | 9 | 3 | 66.0±15.8 | - | - | upper limbs | 6.1±1.2 | ||||||||||||||||||||||||||||||||||||||||||||||||||||||||||||||||||||||||||||||||||||||||||
| Ketan Jhunjhunwala | 2013 | India | 32 | 19 | 29.5±4.4 | - | - | upper limbs | 4.8±0.6 | ||||||||||||||||||||||||||||||||||||||||||||||||||||||||||||||||||||||||||||||||||||||||||
| Michelle A. Farrar | 2016 | Australia | 62 | 31 | 45.8±NR | - | - | upper limbs | 5.3±0.2 | ||||||||||||||||||||||||||||||||||||||||||||||||||||||||||||||||||||||||||||||||||||||||||
| Luis Velázquez-Pérez | 2016 | Cuba | 37 | 11 | 40.4±11.25 | - | - | upper limbs/lower limbs | 13.9±1.7 | ||||||||||||||||||||||||||||||||||||||||||||||||||||||||||||||||||||||||||||||||||||||||||
| Age, disease duration, CAG and CMCT are summarized as mean±SD. SCA, spinocerebellar ataxia; CAG, length of expanded repeats allele; CMCT, central motor conduction time; NR, not reported. | |||||||||||||||||||||||||||||||||||||||||||||||||||||||||||||||||||||||||||||||||||||||||||||||||||
Because most data described the CMCT in the upper limbs, they were used for the analysis and comparison of different SCA subtypes. CMCT data of the lower limbs were discussed only in the comparison of SCA2 with the control group.
CMCT comparison in upper limbs
Five of the eight articles were selected for comparisons between the overall SCA group and the control group. Three articles were excluded because they did not include the total standard deviation or because they used lower limb CMCT. The results are shown in forest plots (Figure 2A). The total sample size of the SCA group was 77, and that of the control group was 133. There were statistically significant differences between the SCA and control groups (d, 1.79; 95% CI, 0.97 to 2.62; P < 0.0001). However, the I² value of 85% indicated that the heterogeneity was high. After the study by D.A. Restivo (2000) was excluded, the sensitivity analysis found that the I² was reduced to 43%. The sample sizes of the SCA and control groups changed to 59 and 113, respectively, and statistically significant differences still existed (d, 2.24; 95% CI, 1.76 to 2.72; P < 0.00001).
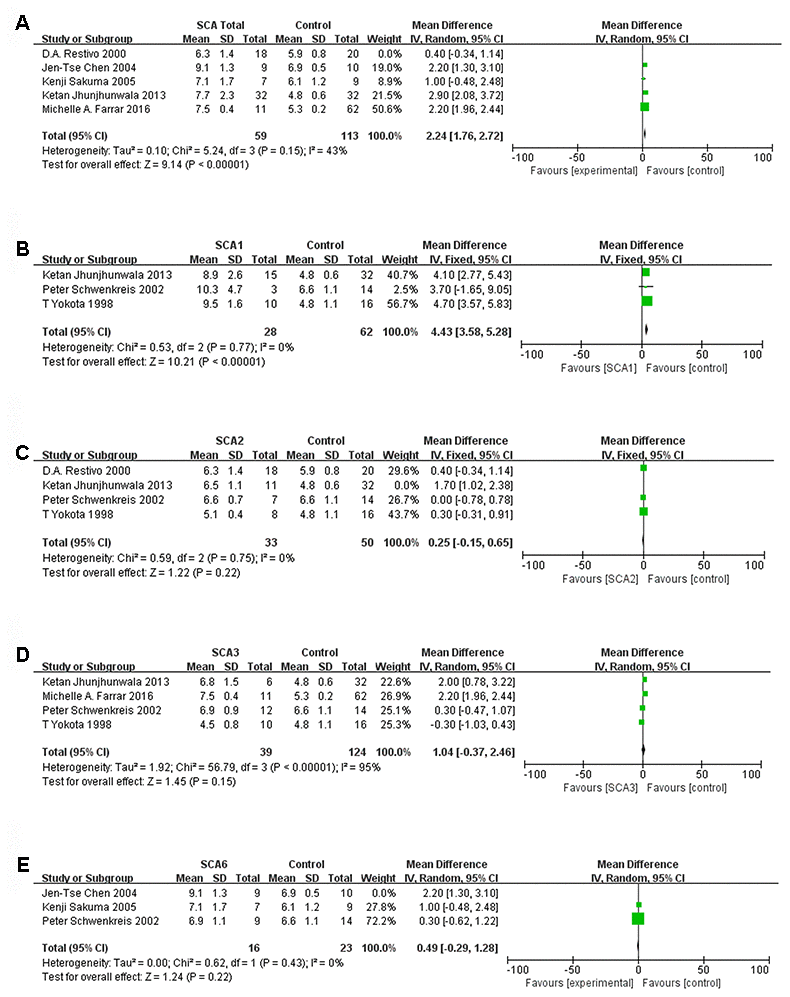
Figure 2. Forest plot of (A) SCA total, (B) SCA1, (C) SCA2, (D) SCA3, (E) SCA6 after sensitivity analysis.
When each subtype of SCA was analyzed separately, the heterogeneity of the three studies involving SCA1 was low, with I² = 0%. The sample size was 28:62 (SCA1:control), and significant differences were observed (d, 4.43; 95% CI, 3.58 to 5.28; P < 0.00001, Figure 2B). When we removed the article by Ketan Jhunjhunwala (2013), the 3 remaining studies of SCA2 had a sample size of 33:50 (SCA2:control) and low heterogeneity (I² = 0%). However, the mean difference (95% CI) was 0.25 (-0.15, 0.65), which was not statistically significant (Figure 2C). A sensitivity analysis of four SCA3 studies showed that heterogeneity was high, and the results were not statistically significant (Figure 2D). After the paper by Jen-Tse Chen (2004) was excluded, the heterogeneity of the SCA6 studies was very low (Figure 2E). Nevertheless, there was no significant difference between the SCA6 group and the control group (P=0.22). Data from three studies were included in the comparative analysis of the SCA1, 2 and 3 subtypes. We found that there was significant heterogeneity (I2 was more than 50%), but after we excluded the study by T Yokota (1998), the heterogeneity of three subtype comparisons became extremely low (I2 = 0%). We observed that the sample sizes for SCA1, SCA2 and SCA3 were all 18 (Figure 3A–3C). Only the comparisons of SCA1 with SCA2 and SCA3 yielded statistically significant results (P=0.0006 and P=0.010, respectively).
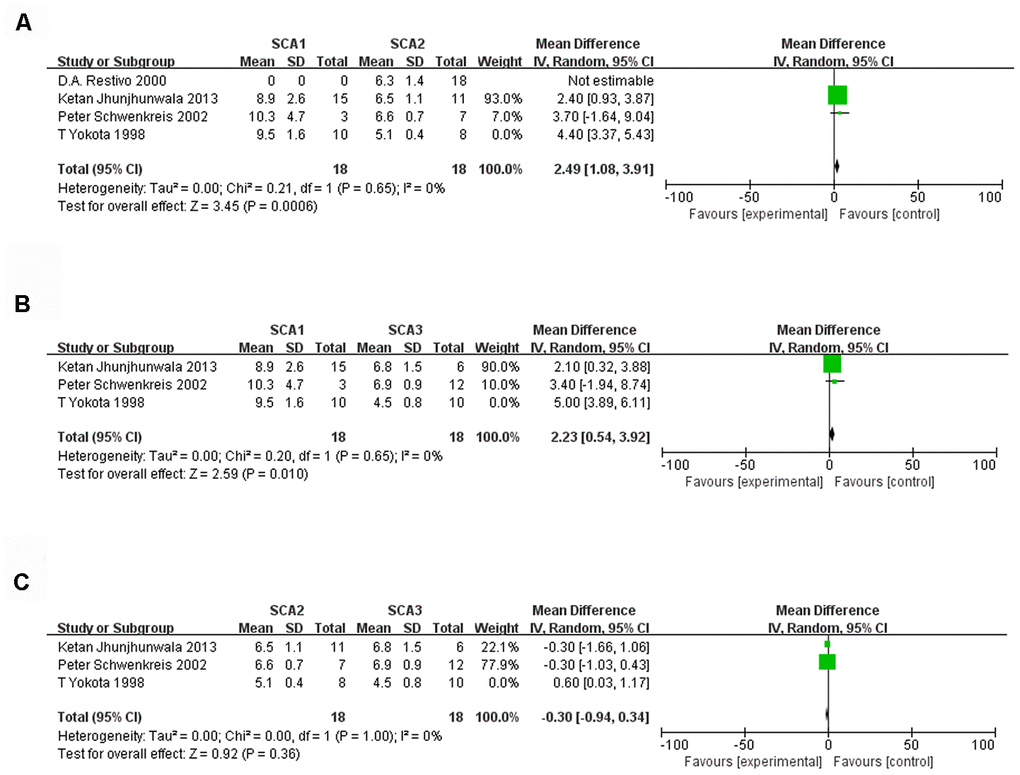
Figure 3. Forest plot of the comparison between SCA1 and SCA2 (A), SCA1 and SCA3 (B), SCA2 and SCA3 (C) after sensitivity analysis.
CMCT comparison for lower limbs
Because there were very few data on lower limb CMCT, we analyzed only the data from the SCA2 and control groups. The results are displayed in Figure 4. To reduce heterogeneity, we removed the study by T Yokota (1998) in the sensitivity analysis, and I2 became 0%. The sample size was 55:57 (SCA2:control), and the difference was statistically significant (d, 6.58; 95% CI, 4.49 to 8.67; P < 0.00001).
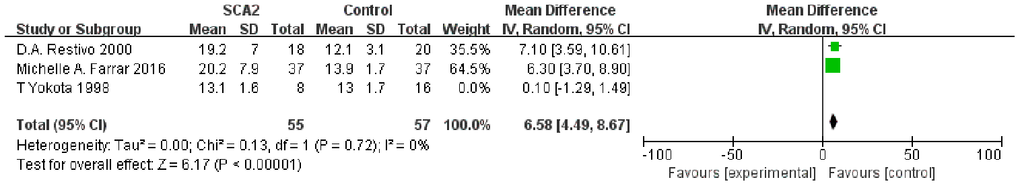
Figure 4. Forest plot of SCA2 and control group lower limb values after sensitivity analysis.
Discussion
This study is the first meta-analysis of CMCT in patients with SCAs. Compared with the control group, the SCA showed a trend toward prolonged CMCT of the upper limb, although there was some heterogeneity. To analyze and reduce the heterogeneity, we organized the analysis into groups according to SCA subtype. Among the various subtypes, the difference was most obvious for SCA1. In the SCA2, SCA3, and SCA6 groups, the CMCT of the upper limbs was not significantly different from that of the control group. The comparison among subtypes showed that SCA1 was significantly different from SCA2 and SCA3. For the lower limbs, patients with SCA2 showed significantly prolonged CMCT compared to the control group.
Sensitivity analysis revealed that the three articles on SCA1 had good homogeneity, while the four articles on SCA3 had high heterogeneity. The reasons for the high heterogeneity in SCA3 might be as follows. First, the sample size was quite small. Second, Table 1 shows that in the study by Ketan Jhunjhunwala (2013) [20], the study population was younger and the duration of disease was relatively short. Additionally, in the study by T Yokota (1998), the ratio of males to females and the CAG repeat number were not reported. Third, there were differences in the experimental methods. In the study by Ketan Jhunjhunwala (2013), the inner diameter of the coil was 70 mm instead of the 90 mm used in other studies. It was evident that the study by Ketan Jhunjhunwala (2013) [20] contributed greatly to the heterogeneity of the SCA2 analysis. At the same time, the study by Jen-Tse Chen (2004) [22] significantly contributed to the heterogeneity of the SCA6 studies.
The reasons for the heterogeneity introduced by those two studies are as follows. First, there were differences in the characteristics of the study populations and the control groups. For example, in the study of SCA2 by Ketan Jhunjhunwala (2013) [20], the disease duration of the patients was relatively short, and the patients and controls were relatively young. In the study of SCA6 by Jen-Tse Chen (2004) [22], the patients and the control group came from Asia, and the specific CAG repeat copy numbers were not directly given, which may represent differences from other studies. Furthermore, although CMCT was calculated by the F-wave method, the parameter settings for TMS (such as the width and angle of the coil) were not identical, and the recording methods were different, both of which could have resulted in heterogeneity. Remarkably, T Yokota (1998) [16] contributed to the heterogeneity of three SCA subtype analyses, particularly the lower limb CMCT analysis of SCA2. This was probably because the study was considerably divergent from the others and used different parameters. Experimental artifacts could also exist.
SCA1, 2 and 3 are autosomal dominant disorders characterized by cerebellar ataxia; these disorders manifest as oculomotor nerve abnormalities, pyramidal or extrapyramidal features and peripheral neuropathy. CMCT is a quantitative neurophysiological measurement method for objectively evaluating corticospinal tract conduction. This measurement reflects the conduction between the primary motor cortex and spinal cord. There may be several mechanisms of CMCT prolongation. First, axons or synapses in the pyramidal tract may gradually decrease in number over the course of the disease. In addition, axons of the pyramidal tract may become demyelinated or atrophied. Moreover, decreased excitability of the α-motor neurons may prolong the time it takes for the membrane potential of those neurons to reach the threshold for an action potential [16]. Previous autopsies of SCA1 patients showed selective loss of large fibers or axon atrophy and demyelination of the corticospinal tract, which could explain the significant prolongation of CMCT in SCA1. However, some previous studies have also shown significant CMCT prolongation in SCA2 and SCA3. Extensive cortical degeneration has also been observed in some SCA2 autopsies [17]. The dysfunction of pyramidal cells in patients with SCA3 (e.g., exaggerated stretch reflexes) also suggests the involvement of the motor cortex. This was not consistent with our results, probably because the sample size was insufficient or because patients were in different stages of the disease. The heterogeneity of the studies also accounted for the result. We discovered that there was a significant difference in lower limb CMCTs between the SCA2 patients and the control group, probably because of the differences in stimulation and recording sites; this difference indicates that CMCT is more sensitive in the lower limbs than in the upper limbs [22]. As SCA6 is a “pure cerebellar” subtype, we were not surprised by the results. Although extracerebellar symptoms are also occasionally reported in SCA6 [20], we believe that cerebellar lesions, which would not cause significant changes in CMCT, are still the main mechanism of SCA6.
In general, compared with the control group, CMCT of SCA1 and SCA2 types was significantly prolonged, while there was no significant difference in SCA3 or SCA6 types. Our meta-analysis provides a new direction for future studies on the pathophysiology of SCAs. First, the difference in CMCT subtypes could reflect the involvement of the motor cortex and conduction pathway, thus providing clinical evidence for the pathology of the disease. Second, there were obvious differences in CMCT among the SCA1, SCA2, SCA3 and control groups, suggesting that CMCT could be used as an auxiliary means of disease classification. Additionally, as a noninvasive examination, it could be used as a potential follow-up evaluation index alongside a clinical scale in cohort studies to estimate the progression of the disease and the effect of therapy.
We have several suggestions for future research. Above all, it would be best to expand the sample size and ensure a lack of confounders between patients and controls. Furthermore, TMS methods and parameters should be standardized to facilitate the sorting and analysis of the results. Both upper limb and lower limb CMCT should be recorded. Moreover, we predicted that the upper motor neurons of SCA2 and SCA3 patients might also be damaged; therefore, we hope that CMCT studies of SCA2 and SCA3 with large samples will be carried out in the future. Finally, CMCT combined with clinical follow-up could be carried out in patients with SCA, especially those with SCA1. The sensitivity and stability of CMCT as an indicator of disease progression could be observed. Our research also had some limitations. For example, some studies were quite old. Additionally, there was heterogeneity among different studies (regarding the study populations, recording methods, etc.), and the number of studies in subgroup analyses was low after the sources of heterogeneity were excluded. Nevertheless, we did include a larger sample than any previous study, and we were able to derive a meaningful conclusion. We hope that subsequent studies will further expand the data.
Conclusions
CMCT prolongation has been observed in different subtypes of SCAs. The difference in CMCT values among different subtypes suggests diverse pathological mechanisms. Our study opens the possibility of performing quantitative analysis and dynamic observation of the extent of damage to the pyramidal tract in SCA patients. As an objective index with which to determine the severity of the disease, CMCT has broad prospects for application, although they need to be confirmed in the future.
Materials and Methods
We conducted this meta-analysis based on the Meta-analysis Of Observational Studies in Epidemiology (MOOSE) guidelines [24] and the corresponding MOOSE checklist [11].
Literature search strategies
To comprehensively examine the relationship between SCA and CMCT, we conducted a comprehensive search of PubMed and Web of Science using the following keywords: [Mesh] “Spinocerebellar Ataxia” or “spinocerebellar ataxia” or “spinocerebellar ataxias” or “spinocerebellar degeneration” or “spinocerebellar atrophy” or “spinocerebellar degenerations” or “spinocerebellar atrophy” or “dominant ataxia” or “hereditary ataxia” or “SCA” or “olivopontocerebellar atrophy” or “Wadia-Swami Syndrome” or “Machado-Joseph disease” in combination with [Mesh] “Transcranial Magnetic Stimulation” or “transcranial magnetic stimulation” or “TMS” or “central motor conduction” or “central motor conduction time”. For Embase, the retrieval strategy used was as follows: (‘spinocerebellar’/exp OR spinocerebellar) AND (‘ataxia’/exp OR ataxia) AND (‘transcranial’/exp OR transcranial) AND (‘magnetic’/exp OR magnetic) AND (‘stimulation’/exp OR stimulation). We limited the search to human studies published in English before April 2020. The references of the articles were also comprehensively searched to identify articles that were missed in the database search, and these articles were judged according to the same selection criteria as the search results.
Study selection and data extraction
We applied several inclusion criteria. First, the study needed to involve SCA patients receiving TMS. The parameters of this group were noted. Second, patient information needed to be complete or nearly complete. Third, an age-matched control group was required, and the parameters of the control group needed to be specified.
Studies were excluded if any of the following criteria were met: the sample size was too small (n<5), or the patient information was inadequate; the patients were not diagnosed with SCA by molecular techniques [8]; TMS was applied in repeated sessions rather than a single session; CMCT values were not directly provided in the article; or the method used to calculate CMCT was not the F-wave method [11].
Data were extracted by two independent reviewers (Z.C.T., M.J.L.), and if there was any disagreement, the data were sent to a third reviewer (L.L.W.) for further exploration. The extracted information was as follows: names of authors, publication year, country, ataxia genotype, sample size, population features (age, sex, disease duration, number of CAG repeats), measurement location (upper limbs/lower limbs) and CMCT.
Quality and risk of bias assessment
To evaluate the risk of bias, an independent analysis of all eligible studies was conducted using the modified Newcastle-Ottawa Scale assessment checklist [25], which was designed to assess three main areas of potential bias in cohort studies: the selection of study groups, the comparability of these groups, and the ascertainment of outcomes. We deleted the section that involved longitudinal studies, thus reducing the maximum possible score on the checklist to 6. All eight studies included in the meta-analysis scored 5 or 6, which indicated a low risk of bias (Supplementary Table 1). We also analyzed the publication bias of the overall SCA research data. They were evenly distributed on both sides in the funnel plot (Supplementary Figure 1).
Statistical analysis
The characteristics of each study are summarized in Table 1, and quantitative variables are expressed as the mean and SD. Because the CMCT measurement sites considered in the study included both the upper limbs and lower limbs, we analyzed the data according to the body part measured. Additionally, different studies focused on different SCA subtypes. To explore the differences in CMCT among the SCA subtypes, a statistical analysis of each SCA subtype was carried out after the aggregate analysis of SCAs as a whole.
Forest plots were used for the statistical analysis of the data. Differences between two groups are reported as the mean difference (95% confidence interval). For all tests, P < 0.05 was deemed to be significant. The I² statistic measures the percentage of total variation introduced by heterogeneity rather than by chance. This statistic was used to quantify heterogeneity, with 25%, 50% and 75% indicating low, medium and high degrees of heterogeneity [12], respectively. For results with medium or higher heterogeneity (I² is greater than 50%), we used a random-effects model to explain the possible heterogeneity among the studies. We also performed a sensitivity analysis to reduce heterogeneity [13]. All statistical analyses were performed using RevMan statistical software (version 5.3).
Author Contributions
T.Z.C. designed the research, collected and analyzed the data, drafted the manuscript. L.M.J., W.L.L., C.Z., W.C.R., P.H.R., H.X. and S.Y.T. participated in the study’s design and coordination. P.L.L., C.Z., Q.R., T.B.S. and J.H. reviewed and revised the manuscript. All the authors read and approved the final manuscript.
Conflicts of Interest
The authors declare no conflicts of interest.
Funding
This study was funded by the National Key Research and Development Program of China (No. 2016YFC0905100 and No. 2016YFC0901504 to H Jiang; No. 2016YFC1306000 to B Tang), the National Natural Science Foundation of China (No. 81771231 and No. 81974176 to H Jiang; No. 81901169 to Z Chen; No. 81901305 to C Wang; No. 81600995 to Y Shi), the Innovation Research Group Project of Natural Science Foundation of Hunan Province (No. 2020JJ1008 to H Jiang), the Scientific Research Foundation of Health Commission of Hunan Province (No. B2019183 to H Jiang), the Key Research and Development Program of Hunan Province (No. 2018SK2092 to H Jiang), the Innovative Research and Development Program of Development and Reform Commission of Hunan Province to H Jiang, the Natural Science Foundation of Hunan Province (No.2019JJ40363 to R Qiu), the Clinical and Rehabilitation Funds of Peking University Weiming Biotech Group (No. xywm2015I10 to H Jiang), and the Youth Foundation of Xiangya Hospital (No. 2017Q03 to Z Chen, No. 2018Q05 to C Wang).
References
- 1. Wan L, Xu K, Chen Z, Tang B, Jiang H. Roles of post-translational modifications in spinocerebellar ataxias. Front Cell Neurosci. 2018; 12:290. https://doi.org/10.3389/fncel.2018.00290 [PubMed]
- 2. Peng H, Liang X, Long Z, Chen Z, Shi Y, Xia K, Meng L, Tang B, Qiu R, Jiang H. Gene-related cerebellar neurodegeneration in SCA3/MJD: a case-controlled imaging-genetic study. Front Neurol. 2019; 10:1025. https://doi.org/10.3389/fneur.2019.01025 [PubMed]
- 3. Paulson HL, Shakkottai VG, Clark HB, Orr HT. Polyglutamine spinocerebellar ataxias - from genes to potential treatments. Nat Rev Neurosci. 2017; 18:613–26. https://doi.org/10.1038/nrn.2017.92 [PubMed]
- 4. Chen Z, Wang C, Zheng C, Long Z, Cao L, Li X, Shang H, Yin X, Zhang B, Liu J, Ding D, Peng Y, Peng H, et al, and Chinese Clinical Research Cooperative Group for Spinocerebellar Ataxias (CCRCG-SCA). Ubiquitin-related network underlain by (CAG)n loci modulate age at onset in Machado-Joseph disease. Brain. 2017; 140:e25. https://doi.org/10.1093/brain/awx028 [PubMed]
- 5. Chen Z, Zheng C, Long Z, Cao L, Li X, Shang H, Yin X, Zhang B, Liu J, Ding D, Peng Y, Wang C, Peng H, et al, and Chinese Clinical Research Cooperative Group for Spinocerebellar Ataxias (CCRCG-SCA). (CAG)n loci as genetic modifiers of age-at-onset in patients with Machado-Joseph disease from mainland China. Brain. 2016; 139:e41. https://doi.org/10.1093/brain/aww087 [PubMed]
- 6. Shi Y, Wang C, Huang F, Chen Z, Sun Z, Wang J, Tang B, Ashizawa T, Klockgether T, Jiang H. High serum GFAP levels in SCA3/MJD may not correlate with disease progression. Cerebellum. 2015; 14:677–81. https://doi.org/10.1007/s12311-015-0667-7 [PubMed]
- 7. Klockgether T, Mariotti C, Paulson HL. Spinocerebellar ataxia. Nat Rev Dis Primers. 2019; 5:24. https://doi.org/10.1038/s41572-019-0074-3 [PubMed]
- 8. Burke MJ, Fried PJ, Pascual-Leone A. Transcranial magnetic stimulation: Neurophysiological and clinical applications. Handb Clin Neurol. 2019; 163:73–92. https://doi.org/10.1016/B978-0-12-804281-6.00005-7 [PubMed]
- 9. Barker AT, Shields K. Transcranial magnetic stimulation: basic principles and clinical applications in migraine. Headache. 2017; 57:517–24. https://doi.org/10.1111/head.13002 [PubMed]
- 10. Kubota M, Iijima M, Shirai Y, Toi S, Kitagawa K. Association between cerebral small vessel disease and central motor conduction time in patients with vascular risk. J Stroke Cerebrovasc Dis. 2019; 28:2343–50. https://doi.org/10.1016/j.jstrokecerebrovasdis.2019.05.030 [PubMed]
- 11. Yan S, Fu W, Wang C, Mao J, Liu B, Zou L, Lv C. Association between sedentary behavior and the risk of dementia: a systematic review and meta-analysis. Transl Psychiatry. 2020; 10:112. https://doi.org/10.1038/s41398-020-0799-5 [PubMed]
- 12. Iljazi A, Ashina H, Lipton RB, Chaudhry B, Al-Khazali HM, Naples JG, Schytz HW, Vukovic Cvetkovic V, Burstein R, Ashina S. Dizziness and vertigo during the prodromal phase and headache phase of migraine: a systematic review and meta-analysis. Cephalalgia. 2020; 40:1095–103. https://doi.org/10.1177/0333102420921855 [PubMed]
- 13. Krahe J, Binkofski F, Schulz JB, Reetz K, Romanzetti S. Neurochemical profiles in hereditary ataxias: a meta-analysis of magnetic resonance spectroscopy studies. Neurosci Biobehav Rev. 2020; 108:854–65. https://doi.org/10.1016/j.neubiorev.2019.12.019 [PubMed]
- 14. Velázquez-Pérez L, Rodríguez-Labrada R, Torres-Vega R, Montero JM, Vazquez-Mojena Y, Auburger G, Ziemann U. Central motor conduction time as prodromal biomarker in spinocerebellar ataxia type 2. Mov Disord. 2016; 31:603–04. https://doi.org/10.1002/mds.26555 [PubMed]
- 15. Velázquez-Pérez L, Tünnerhoff J, Rodríguez-Labrada R, Torres-Vega R, Belardinelli P, Medrano-Montero J, Peña-Acosta A, Canales-Ochoa N, Vázquez-Mojena Y, González-Zaldivar Y, Auburger G, Ziemann U. Corticomuscular coherence: a novel tool to assess the pyramidal tract dysfunction in spinocerebellar ataxia type 2. Cerebellum. 2017; 16:602–06. https://doi.org/10.1007/s12311-016-0827-4 [PubMed]
- 16. Yokota T, Sasaki H, Iwabuchi K, Shiojiri T, Yoshino A, Otagiri A, Inaba A, Yuasa T. Electrophysiological features of central motor conduction in spinocerebellar atrophy type 1, type 2, and Machado-Joseph disease. J Neurol Neurosurg Psychiatry. 1998; 65:530–34. https://doi.org/10.1136/jnnp.65.4.530 [PubMed]
- 17. Schwenkreis P, Tegenthoff M, Witscher K, Börnke C, Przuntek H, Malin JP, Schöls L. Motor cortex activation by transcranial magnetic stimulation in ataxia patients depends on the genetic defect. Brain. 2002; 125:301–09. https://doi.org/10.1093/brain/awf023 [PubMed]
- 18. Sakuma K, Adachi Y, Fukuda H, Kai T, Nakashima K. Triple stimulation technique in patients with spinocerebellar ataxia type 6. Clin Neurophysiol. 2005; 116:2586–91. https://doi.org/10.1016/j.clinph.2005.04.015 [PubMed]
- 19. Restivo DA, Giuffrida S, Rapisarda G, Antonuzzo A, Saponara R, Reggio A, Trovato Salinaro A, Raffaele R, Domina E, Trovato A, Condorelli DF, Pennisi G. Central motor conduction to lower limb after transcranial magnetic stimulation in spinocerebellar ataxia type 2 (SCA2). Clin Neurophysiol. 2000; 111:630–35. https://doi.org/10.1016/s1388-2457(99)00305-3 [PubMed]
- 20. Jhunjhunwala K, Prashanth DK, Netravathi M, Jain S, Purushottam M, Pal PK. Alterations in cortical excitability and central motor conduction time in spinocerebellar ataxias 1, 2 and 3: a comparative study. Parkinsonism Relat Disord. 2013; 19:306–11. https://doi.org/10.1016/j.parkreldis.2012.11.002 [PubMed]
- 21. Farrar MA, Vucic S, Nicholson G, Kiernan MC. Motor cortical dysfunction develops in spinocerebellar ataxia type 3. Clin Neurophysiol. 2016; 127:3418–24. https://doi.org/10.1016/j.clinph.2016.09.005 [PubMed]
- 22. Chen JT, Lin YY, Lee YC, Soong BW, Wu ZA, Liao KK. Prolonged central motor conduction time of lower limb muscle in spinocerebellar ataxia 6. J Clin Neurosci. 2004; 11:381–83. https://doi.org/10.1016/j.jocn.2003.08.006 [PubMed]
- 23. Velázquez-Pérez L, Rodríguez-Labrada R, Torres-Vega R, Medrano Montero J, Vázquez-Mojena Y, Auburger G, Ziemann U. Abnormal corticospinal tract function and motor cortex excitability in non-ataxic SCA2 mutation carriers: a TMS study. Clin Neurophysiol. 2016; 127:2713–19. https://doi.org/10.1016/j.clinph.2016.05.003 [PubMed]
- 24. Stroup DF, Berlin JA, Morton SC, Olkin I, Williamson GD, Rennie D, Moher D, Becker BJ, Sipe TA, Thacker SB. Meta-analysis of observational studies in epidemiology: a proposal for reporting. Meta-analysis of observational studies in epidemiology (MOOSE) group. JAMA. 2000; 283:2008–12. https://doi.org/10.1001/jama.283.15.2008 [PubMed]
- 25. O’Connor E, Simpson BS, Houlden H, Vandrovcova J, Matharu M. Prevalence of familial cluster headache: a systematic review and meta-analysis. J Headache Pain. 2020; 21:37. https://doi.org/10.1186/s10194-020-01101-w [PubMed]