


Introduction
Colorectal cancer ranks as the fourth most frequently diagnosed cancer and the second leading cause of cancer death in the United States [1]. The incidence and mortality rates of colorectal cancer have decreased in recent years thanks to the popularity of colonoscopy screening and the advancement of treatment [2]. However, the incidence of colorectal cancer in patients younger than 50 years has been increasing [3]. Recent news that Chadwick Aaron Boseman died due to colon cancer at the age of 43 has aroused worldwide concern for early-onset colon cancer. Furthermore, it is difficult to advise treatment options for early-onset colorectal cancer because the prognosis of colon cancer among young patients is not well known [4]. Therefore, early-onset colorectal cancer should gain more attention.
Colon cancer accounts for the vast majority of colorectal cancer, around 70% [3, 5, 6]. Although colorectal cancer is usually discussed as a general category, there are many differences, involving embryological origin, anatomy, function as well as treatments, between colon cancer and rectal cancer [7]. In addition, numerous studies tend to put patients with stage II and stage III colon cancer together in exploring prognostic information [8, 9] due to the relatively consistent treatment strategies and follow-up principles. Therefore, this study focused on locally advanced colon cancer patients younger than 50 years (early-onset locally advanced colon cancer; EOLACC).
The Surveillance, Epidemiology, and End Results (SEER) program of the National Cancer Institute (NCI) is a source for epidemiologic information on the incidence and survival rates of cancer in the United States [10]. Various studies have explored clinical problems by analyzing the data from the SEER database, which has helped to further improve the treatment of cancer patients. Although widely used to evaluate the prognosis of various tumors, the American Joint Committee on Cancer (AJCC) staging system contains a survival paradox for locally advanced colon cancer, that colon cancer patients with T3-4N0 (stage II) had an approximate or even worse survival rate compared to those with T1-2N+ (stage III) [11–13]. The shortcomings of AJCC staging for colon cancer prompted the exploration of a new risk scoring system. The nomogram is widely applied to predict outcomes intuitively and effectively in medical studies. The length of the line in the nomogram can be used to indicate the impact of each variable on the outcome.
Therefore, our plan was to develop and validate prognostic nomograms predicting overall survival (OS) and cancer-specific survival (CSS) for early-onset locally advanced colon cancer based on the SEER database.
Results
Patient characteristics
The entire cohort from the SEER database comprised 13,755 patients with histologically confirmed locally advanced colon cancer, who were younger than 50-year-old; these were distributed into a training group or a verification group randomly according to the ratio of 2:1. Table 1 summarizes the demographic, clinical as well as pathological characteristics of the study cohort. The target population was mainly 40-49 years old (74.30%) and White (72.32%). Male patients had a slightly predominance compared with females (52.05% vs. 47.95%) in EOLACC. Meanwhile, early-onset patients with locally advanced left colon cancer were slightly more than those with locally advanced right colon cancer (50.69% vs. 47.29%). Moreover, mucinous cell carcinoma (MCC)/signet ring cell carcinoma (SRCC) accounted for 13.41% of cases in this study. Besides, the proportion of stage III colon cancer (N+: N1 and N2) was higher than that of stage II (N0) (57.72% vs. 42.28%). Almost all of the patients (99.00%) had undergone colectomy and 64.18% of them received chemotherapy. More importantly, the patients with RNE ≥ 12 totaled 86.75%. In addition, 3.56% received radiotherapy, which is not a conventional treatment for colon cancer.
Table 1. Characteristics of patients with EOLACC in the training and validation group.
| Characteristics | Total(n=13755) | Training group(n=9170) | Validation group(n=4585) | ||||||||||||||||||||||||||||||||||||||||||||||||||||||||||||||||||||||||||||||||||||||||||||||||
| N | % | N | % | N | % | ||||||||||||||||||||||||||||||||||||||||||||||||||||||||||||||||||||||||||||||||||||||||||||||
| Gender | |||||||||||||||||||||||||||||||||||||||||||||||||||||||||||||||||||||||||||||||||||||||||||||||||||
| Female | 6596 | 47.95% | 4431 | 48.32% | 2165 | 47.22% | |||||||||||||||||||||||||||||||||||||||||||||||||||||||||||||||||||||||||||||||||||||||||||||
| Male | 7159 | 52.05% | 4739 | 51.68% | 2420 | 52.78% | |||||||||||||||||||||||||||||||||||||||||||||||||||||||||||||||||||||||||||||||||||||||||||||
| Age(years) | |||||||||||||||||||||||||||||||||||||||||||||||||||||||||||||||||||||||||||||||||||||||||||||||||||
| 18-29 | 633 | 4.60% | 441 | 4.81% | 192 | 4.19% | |||||||||||||||||||||||||||||||||||||||||||||||||||||||||||||||||||||||||||||||||||||||||||||
| 30-39 | 2902 | 21.10% | 1886 | 20.57% | 1016 | 22.16% | |||||||||||||||||||||||||||||||||||||||||||||||||||||||||||||||||||||||||||||||||||||||||||||
| 40-49 | 10220 | 74.30% | 6843 | 74.62% | 3377 | 73.65% | |||||||||||||||||||||||||||||||||||||||||||||||||||||||||||||||||||||||||||||||||||||||||||||
| Marital status | |||||||||||||||||||||||||||||||||||||||||||||||||||||||||||||||||||||||||||||||||||||||||||||||||||
| Married | 7815 | 56.82% | 5248 | 57.23% | 2567 | 55.99% | |||||||||||||||||||||||||||||||||||||||||||||||||||||||||||||||||||||||||||||||||||||||||||||
| Unmarried/NOS | 5940 | 43.18% | 3922 | 42.77% | 2018 | 44.01% | |||||||||||||||||||||||||||||||||||||||||||||||||||||||||||||||||||||||||||||||||||||||||||||
| Race | |||||||||||||||||||||||||||||||||||||||||||||||||||||||||||||||||||||||||||||||||||||||||||||||||||
| White | 9947 | 72.32% | 6636 | 72.37% | 3311 | 72.21% | |||||||||||||||||||||||||||||||||||||||||||||||||||||||||||||||||||||||||||||||||||||||||||||
| Black | 2218 | 16.13% | 1466 | 15.99% | 752 | 16.40% | |||||||||||||||||||||||||||||||||||||||||||||||||||||||||||||||||||||||||||||||||||||||||||||
| Other/NOS | 1590 | 11.56% | 1068 | 11.65% | 522 | 11.38% | |||||||||||||||||||||||||||||||||||||||||||||||||||||||||||||||||||||||||||||||||||||||||||||
| Tumor location | |||||||||||||||||||||||||||||||||||||||||||||||||||||||||||||||||||||||||||||||||||||||||||||||||||
| Right colon | 6505 | 47.29% | 4305 | 46.95% | 2200 | 47.98% | |||||||||||||||||||||||||||||||||||||||||||||||||||||||||||||||||||||||||||||||||||||||||||||
| Left colon | 6973 | 50.69% | 4665 | 50.87% | 2308 | 50.34% | |||||||||||||||||||||||||||||||||||||||||||||||||||||||||||||||||||||||||||||||||||||||||||||
| NOS | 277 | 2.01% | 200 | 2.18% | 77 | 1.68% | |||||||||||||||||||||||||||||||||||||||||||||||||||||||||||||||||||||||||||||||||||||||||||||
| Pathological grade | |||||||||||||||||||||||||||||||||||||||||||||||||||||||||||||||||||||||||||||||||||||||||||||||||||
| I | 835 | 6.07% | 567 | 6.18% | 268 | 5.85% | |||||||||||||||||||||||||||||||||||||||||||||||||||||||||||||||||||||||||||||||||||||||||||||
| II | 9616 | 69.91% | 6419 | 70.00% | 3197 | 69.73% | |||||||||||||||||||||||||||||||||||||||||||||||||||||||||||||||||||||||||||||||||||||||||||||
| III | 2569 | 18.68% | 1711 | 18.66% | 858 | 18.71% | |||||||||||||||||||||||||||||||||||||||||||||||||||||||||||||||||||||||||||||||||||||||||||||
| IV | 434 | 3.16% | 274 | 2.99% | 160 | 3.49% | |||||||||||||||||||||||||||||||||||||||||||||||||||||||||||||||||||||||||||||||||||||||||||||
| NOS | 301 | 2.19% | 199 | 2.17% | 102 | 2.22% | |||||||||||||||||||||||||||||||||||||||||||||||||||||||||||||||||||||||||||||||||||||||||||||
| Histological type | |||||||||||||||||||||||||||||||||||||||||||||||||||||||||||||||||||||||||||||||||||||||||||||||||||
| Adenocarcinomas | 11911 | 86.59% | 7939 | 86.58% | 3972 | 86.63% | |||||||||||||||||||||||||||||||||||||||||||||||||||||||||||||||||||||||||||||||||||||||||||||
| MCC/SRCC | 1844 | 13.41% | 1231 | 13.42% | 613 | 13.37% | |||||||||||||||||||||||||||||||||||||||||||||||||||||||||||||||||||||||||||||||||||||||||||||
| T stage | |||||||||||||||||||||||||||||||||||||||||||||||||||||||||||||||||||||||||||||||||||||||||||||||||||
| T1-2 | 946 | 6.88% | 627 | 6.84% | 319 | 6.96% | |||||||||||||||||||||||||||||||||||||||||||||||||||||||||||||||||||||||||||||||||||||||||||||
| T3 | 9997 | 72.68% | 6644 | 72.45% | 3353 | 73.13% | |||||||||||||||||||||||||||||||||||||||||||||||||||||||||||||||||||||||||||||||||||||||||||||
| T4a | 1618 | 11.76% | 1102 | 12.02% | 516 | 11.25% | |||||||||||||||||||||||||||||||||||||||||||||||||||||||||||||||||||||||||||||||||||||||||||||
| T4b | 1194 | 8.68% | 797 | 8.69% | 397 | 8.66% | |||||||||||||||||||||||||||||||||||||||||||||||||||||||||||||||||||||||||||||||||||||||||||||
| N stage | |||||||||||||||||||||||||||||||||||||||||||||||||||||||||||||||||||||||||||||||||||||||||||||||||||
| N0 | 5816 | 42.28% | 3889 | 42.41% | 1927 | 42.03% | |||||||||||||||||||||||||||||||||||||||||||||||||||||||||||||||||||||||||||||||||||||||||||||
| N1 | 4800 | 34.90% | 3175 | 34.62% | 1625 | 35.44% | |||||||||||||||||||||||||||||||||||||||||||||||||||||||||||||||||||||||||||||||||||||||||||||
| N2 | 3139 | 22.82% | 2106 | 22.97% | 1033 | 22.53% | |||||||||||||||||||||||||||||||||||||||||||||||||||||||||||||||||||||||||||||||||||||||||||||
| Surgery | |||||||||||||||||||||||||||||||||||||||||||||||||||||||||||||||||||||||||||||||||||||||||||||||||||
| Colectomy | 13618 | 99.00% | 9075 | 98.96% | 4543 | 99.08% | |||||||||||||||||||||||||||||||||||||||||||||||||||||||||||||||||||||||||||||||||||||||||||||
| Non-colectomy/NOS | 137 | 1.00% | 95 | 1.04% | 42 | 0.92% | |||||||||||||||||||||||||||||||||||||||||||||||||||||||||||||||||||||||||||||||||||||||||||||
| Radiotherapy | |||||||||||||||||||||||||||||||||||||||||||||||||||||||||||||||||||||||||||||||||||||||||||||||||||
| Yes | 489 | 3.56% | 313 | 3.41% | 176 | 3.84% | |||||||||||||||||||||||||||||||||||||||||||||||||||||||||||||||||||||||||||||||||||||||||||||
| No/Unknown | 13266 | 96.44% | 8857 | 96.59% | 4409 | 96.16% | |||||||||||||||||||||||||||||||||||||||||||||||||||||||||||||||||||||||||||||||||||||||||||||
| Chemotherapy | |||||||||||||||||||||||||||||||||||||||||||||||||||||||||||||||||||||||||||||||||||||||||||||||||||
| Yes | 8828 | 64.18% | 5872 | 64.03% | 2956 | 64.47% | |||||||||||||||||||||||||||||||||||||||||||||||||||||||||||||||||||||||||||||||||||||||||||||
| No/Unknown | 4927 | 35.82% | 3298 | 35.97% | 1629 | 35.53% | |||||||||||||||||||||||||||||||||||||||||||||||||||||||||||||||||||||||||||||||||||||||||||||
| RNE | |||||||||||||||||||||||||||||||||||||||||||||||||||||||||||||||||||||||||||||||||||||||||||||||||||
| <6 | 450 | 3.27% | 306 | 3.34% | 144 | 3.14% | |||||||||||||||||||||||||||||||||||||||||||||||||||||||||||||||||||||||||||||||||||||||||||||
| 6-11 | 1286 | 9.35% | 877 | 9.56% | 409 | 8.92% | |||||||||||||||||||||||||||||||||||||||||||||||||||||||||||||||||||||||||||||||||||||||||||||
| 12-17 | 3676 | 26.72% | 2455 | 26.77% | 1221 | 26.63% | |||||||||||||||||||||||||||||||||||||||||||||||||||||||||||||||||||||||||||||||||||||||||||||
| 18-23 | 3154 | 22.93% | 2083 | 22.72% | 1071 | 23.36% | |||||||||||||||||||||||||||||||||||||||||||||||||||||||||||||||||||||||||||||||||||||||||||||
| 24-39 | 2062 | 14.99% | 1363 | 14.86% | 699 | 15.25% | |||||||||||||||||||||||||||||||||||||||||||||||||||||||||||||||||||||||||||||||||||||||||||||
| 30-35 | 1194 | 8.68% | 820 | 8.94% | 374 | 8.16% | |||||||||||||||||||||||||||||||||||||||||||||||||||||||||||||||||||||||||||||||||||||||||||||
| ≥36 | 1846 | 13.42% | 1208 | 13.17% | 638 | 13.91% | |||||||||||||||||||||||||||||||||||||||||||||||||||||||||||||||||||||||||||||||||||||||||||||
| NOS | 87 | 0.63% | 58 | 0.63% | 29 | 0.63% | |||||||||||||||||||||||||||||||||||||||||||||||||||||||||||||||||||||||||||||||||||||||||||||
| Tumor size | |||||||||||||||||||||||||||||||||||||||||||||||||||||||||||||||||||||||||||||||||||||||||||||||||||
| ≤5cm | 7031 | 51.12% | 4722 | 51.49% | 2309 | 50.36% | |||||||||||||||||||||||||||||||||||||||||||||||||||||||||||||||||||||||||||||||||||||||||||||
| 5-10cm | 5484 | 39.87% | 3631 | 39.60% | 1853 | 40.41% | |||||||||||||||||||||||||||||||||||||||||||||||||||||||||||||||||||||||||||||||||||||||||||||
| >10cm | 632 | 4.59% | 414 | 4.51% | 218 | 4.75% | |||||||||||||||||||||||||||||||||||||||||||||||||||||||||||||||||||||||||||||||||||||||||||||
| NOS | 608 | 4.42% | 403 | 4.39% | 205 | 4.47% | |||||||||||||||||||||||||||||||||||||||||||||||||||||||||||||||||||||||||||||||||||||||||||||
| CEA | |||||||||||||||||||||||||||||||||||||||||||||||||||||||||||||||||||||||||||||||||||||||||||||||||||
| Normal | 5706 | 41.48% | 3804 | 41.48% | 1902 | 41.48% | |||||||||||||||||||||||||||||||||||||||||||||||||||||||||||||||||||||||||||||||||||||||||||||
| Elevated | 2997 | 21.79% | 1959 | 21.36% | 1038 | 22.64% | |||||||||||||||||||||||||||||||||||||||||||||||||||||||||||||||||||||||||||||||||||||||||||||
| NOS | 5052 | 36.73% | 3407 | 37.15% | 1645 | 35.88% | |||||||||||||||||||||||||||||||||||||||||||||||||||||||||||||||||||||||||||||||||||||||||||||
| OS (months) | 54 (24-96) | 53 (24-96) | 55 (24-97) | ||||||||||||||||||||||||||||||||||||||||||||||||||||||||||||||||||||||||||||||||||||||||||||||||
| CSS (months) | 54 (24-97) | 54 (24-96) | 55 (24-97) | ||||||||||||||||||||||||||||||||||||||||||||||||||||||||||||||||||||||||||||||||||||||||||||||||
| MCC: mucinous cell carcinoma; SRCC: signet ring cell carcinoma; RNE: regional nodes examined; NOS: Not Otherwise Specified. | |||||||||||||||||||||||||||||||||||||||||||||||||||||||||||||||||||||||||||||||||||||||||||||||||||
Table 2 summarizes the characteristics of EOLACC patients from the external verification group, which comprised 126 patients from China. All of the patients in the external verification group had undergone colectomy. And 66.67% of those from our institute received chemotherapy.
Table 2. Characteristics of patients with EOLACC in the external verification group.
| Characteristics | External verification group (n=126) | ||||||||||||||||||||||||||||||||||||||||||||||||||||||||||||||||||||||||||||||||||||||||||||||||||
| N | % | ||||||||||||||||||||||||||||||||||||||||||||||||||||||||||||||||||||||||||||||||||||||||||||||||||
| Gender | |||||||||||||||||||||||||||||||||||||||||||||||||||||||||||||||||||||||||||||||||||||||||||||||||||
| Female | 61 | 48.41% | |||||||||||||||||||||||||||||||||||||||||||||||||||||||||||||||||||||||||||||||||||||||||||||||||
| Male | 65 | 51.59% | |||||||||||||||||||||||||||||||||||||||||||||||||||||||||||||||||||||||||||||||||||||||||||||||||
| Age(years) | |||||||||||||||||||||||||||||||||||||||||||||||||||||||||||||||||||||||||||||||||||||||||||||||||||
| 18-29 | 8 | 6.35% | |||||||||||||||||||||||||||||||||||||||||||||||||||||||||||||||||||||||||||||||||||||||||||||||||
| 30-39 | 20 | 15.87% | |||||||||||||||||||||||||||||||||||||||||||||||||||||||||||||||||||||||||||||||||||||||||||||||||
| 40-49 | 98 | 77.78% | |||||||||||||||||||||||||||||||||||||||||||||||||||||||||||||||||||||||||||||||||||||||||||||||||
| Marital status | |||||||||||||||||||||||||||||||||||||||||||||||||||||||||||||||||||||||||||||||||||||||||||||||||||
| Married | 103 | 81.75% | |||||||||||||||||||||||||||||||||||||||||||||||||||||||||||||||||||||||||||||||||||||||||||||||||
| Unmarried/NOS | 23 | 18.25% | |||||||||||||||||||||||||||||||||||||||||||||||||||||||||||||||||||||||||||||||||||||||||||||||||
| Race | |||||||||||||||||||||||||||||||||||||||||||||||||||||||||||||||||||||||||||||||||||||||||||||||||||
| White | 0 | 0.00% | |||||||||||||||||||||||||||||||||||||||||||||||||||||||||||||||||||||||||||||||||||||||||||||||||
| Black | 0 | 0.00% | |||||||||||||||||||||||||||||||||||||||||||||||||||||||||||||||||||||||||||||||||||||||||||||||||
| Other/NOS | 126 | 100.00% | |||||||||||||||||||||||||||||||||||||||||||||||||||||||||||||||||||||||||||||||||||||||||||||||||
| Tumor location | |||||||||||||||||||||||||||||||||||||||||||||||||||||||||||||||||||||||||||||||||||||||||||||||||||
| Right colon | 66 | 52.38% | |||||||||||||||||||||||||||||||||||||||||||||||||||||||||||||||||||||||||||||||||||||||||||||||||
| Left colon | 60 | 47.62% | |||||||||||||||||||||||||||||||||||||||||||||||||||||||||||||||||||||||||||||||||||||||||||||||||
| NOS | 0 | 0.00% | |||||||||||||||||||||||||||||||||||||||||||||||||||||||||||||||||||||||||||||||||||||||||||||||||
| Pathological grade | |||||||||||||||||||||||||||||||||||||||||||||||||||||||||||||||||||||||||||||||||||||||||||||||||||
| I | 7 | 5.56% | |||||||||||||||||||||||||||||||||||||||||||||||||||||||||||||||||||||||||||||||||||||||||||||||||
| II | 82 | 65.08% | |||||||||||||||||||||||||||||||||||||||||||||||||||||||||||||||||||||||||||||||||||||||||||||||||
| III | 33 | 26.19% | |||||||||||||||||||||||||||||||||||||||||||||||||||||||||||||||||||||||||||||||||||||||||||||||||
| IV | 4 | 3.17% | |||||||||||||||||||||||||||||||||||||||||||||||||||||||||||||||||||||||||||||||||||||||||||||||||
| NOS | 0 | 0.00% | |||||||||||||||||||||||||||||||||||||||||||||||||||||||||||||||||||||||||||||||||||||||||||||||||
| Histological type | |||||||||||||||||||||||||||||||||||||||||||||||||||||||||||||||||||||||||||||||||||||||||||||||||||
| Adenocarcinomas | 101 | 80.16% | |||||||||||||||||||||||||||||||||||||||||||||||||||||||||||||||||||||||||||||||||||||||||||||||||
| MCC/SRCC | 25 | 19.84% | |||||||||||||||||||||||||||||||||||||||||||||||||||||||||||||||||||||||||||||||||||||||||||||||||
| T stage | |||||||||||||||||||||||||||||||||||||||||||||||||||||||||||||||||||||||||||||||||||||||||||||||||||
| T1-2 | 4 | 3.17% | |||||||||||||||||||||||||||||||||||||||||||||||||||||||||||||||||||||||||||||||||||||||||||||||||
| T3 | 72 | 57.14% | |||||||||||||||||||||||||||||||||||||||||||||||||||||||||||||||||||||||||||||||||||||||||||||||||
| T4a | 31 | 24.60% | |||||||||||||||||||||||||||||||||||||||||||||||||||||||||||||||||||||||||||||||||||||||||||||||||
| T4b | 19 | 15.08% | |||||||||||||||||||||||||||||||||||||||||||||||||||||||||||||||||||||||||||||||||||||||||||||||||
| N stage | |||||||||||||||||||||||||||||||||||||||||||||||||||||||||||||||||||||||||||||||||||||||||||||||||||
| N0 | 17 | 13.49% | |||||||||||||||||||||||||||||||||||||||||||||||||||||||||||||||||||||||||||||||||||||||||||||||||
| N1 | 63 | 50.00% | |||||||||||||||||||||||||||||||||||||||||||||||||||||||||||||||||||||||||||||||||||||||||||||||||
| N2 | 46 | 36.51% | |||||||||||||||||||||||||||||||||||||||||||||||||||||||||||||||||||||||||||||||||||||||||||||||||
| Surgery | |||||||||||||||||||||||||||||||||||||||||||||||||||||||||||||||||||||||||||||||||||||||||||||||||||
| Colectomy | 126 | 100.00% | |||||||||||||||||||||||||||||||||||||||||||||||||||||||||||||||||||||||||||||||||||||||||||||||||
| Non-colectomy/NOS | 0 | 0.00% | |||||||||||||||||||||||||||||||||||||||||||||||||||||||||||||||||||||||||||||||||||||||||||||||||
| Radiotherapy | |||||||||||||||||||||||||||||||||||||||||||||||||||||||||||||||||||||||||||||||||||||||||||||||||||
| Yes | 1 | 0.79% | |||||||||||||||||||||||||||||||||||||||||||||||||||||||||||||||||||||||||||||||||||||||||||||||||
| No/Unknown | 125 | 99.21% | |||||||||||||||||||||||||||||||||||||||||||||||||||||||||||||||||||||||||||||||||||||||||||||||||
| Chemotherapy | |||||||||||||||||||||||||||||||||||||||||||||||||||||||||||||||||||||||||||||||||||||||||||||||||||
| Yes | 84 | 66.67% | |||||||||||||||||||||||||||||||||||||||||||||||||||||||||||||||||||||||||||||||||||||||||||||||||
| No/Unknown | 42 | 33.33% | |||||||||||||||||||||||||||||||||||||||||||||||||||||||||||||||||||||||||||||||||||||||||||||||||
| RNE | |||||||||||||||||||||||||||||||||||||||||||||||||||||||||||||||||||||||||||||||||||||||||||||||||||
| <6 | 1 | 0.79% | |||||||||||||||||||||||||||||||||||||||||||||||||||||||||||||||||||||||||||||||||||||||||||||||||
| 6-11 | 22 | 17.46% | |||||||||||||||||||||||||||||||||||||||||||||||||||||||||||||||||||||||||||||||||||||||||||||||||
| 12-17 | 56 | 44.44% | |||||||||||||||||||||||||||||||||||||||||||||||||||||||||||||||||||||||||||||||||||||||||||||||||
| 18-23 | 23 | 18.25% | |||||||||||||||||||||||||||||||||||||||||||||||||||||||||||||||||||||||||||||||||||||||||||||||||
| 24-39 | 19 | 15.08% | |||||||||||||||||||||||||||||||||||||||||||||||||||||||||||||||||||||||||||||||||||||||||||||||||
| 30-35 | 3 | 2.38% | |||||||||||||||||||||||||||||||||||||||||||||||||||||||||||||||||||||||||||||||||||||||||||||||||
| ≥36 | 2 | 1.59% | |||||||||||||||||||||||||||||||||||||||||||||||||||||||||||||||||||||||||||||||||||||||||||||||||
| NOS | 0 | 0.00% | |||||||||||||||||||||||||||||||||||||||||||||||||||||||||||||||||||||||||||||||||||||||||||||||||
| Tumor size | |||||||||||||||||||||||||||||||||||||||||||||||||||||||||||||||||||||||||||||||||||||||||||||||||||
| ≤5cm | 88 | 69.84% | |||||||||||||||||||||||||||||||||||||||||||||||||||||||||||||||||||||||||||||||||||||||||||||||||
| 5-10cm | 35 | 27.78% | |||||||||||||||||||||||||||||||||||||||||||||||||||||||||||||||||||||||||||||||||||||||||||||||||
| >10cm | 1 | 0.79% | |||||||||||||||||||||||||||||||||||||||||||||||||||||||||||||||||||||||||||||||||||||||||||||||||
| NOS | 2 | 1.59% | |||||||||||||||||||||||||||||||||||||||||||||||||||||||||||||||||||||||||||||||||||||||||||||||||
| CEA | |||||||||||||||||||||||||||||||||||||||||||||||||||||||||||||||||||||||||||||||||||||||||||||||||||
| Normal | 78 | 61.90% | |||||||||||||||||||||||||||||||||||||||||||||||||||||||||||||||||||||||||||||||||||||||||||||||||
| Elevated | 46 | 36.51% | |||||||||||||||||||||||||||||||||||||||||||||||||||||||||||||||||||||||||||||||||||||||||||||||||
| NOS | 2 | 1.59% | |||||||||||||||||||||||||||||||||||||||||||||||||||||||||||||||||||||||||||||||||||||||||||||||||
| OS (months) | 56(27-85) | ||||||||||||||||||||||||||||||||||||||||||||||||||||||||||||||||||||||||||||||||||||||||||||||||||
| CSS (months) | 54(27-89) | ||||||||||||||||||||||||||||||||||||||||||||||||||||||||||||||||||||||||||||||||||||||||||||||||||
| MCC: mucinous cell carcinoma; SRCC: signet ring cell carcinoma; RNE: regional nodes examined; NOS: Not Otherwise Specified. | |||||||||||||||||||||||||||||||||||||||||||||||||||||||||||||||||||||||||||||||||||||||||||||||||||
Screening independent prognostic factors
The independent prognostic factors affecting OS and CSS were differentiated by univariable and multivariable Cox regression models. The qualified factors in the univariate analysis were brought into the Cox regression model for multivariate analysis. OS was significantly associated with 10 features, including marital status, race, gender, pathological grade, T stage, N stage, surgery, chemotherapy, RNE and carcinoembryonic antigen (CEA) (Table 3). CSS was related to 9 variables (i.e. marital status, race, pathological grade, T stage, N stage, surgery, chemotherapy, RNE and CEA) (Table 4).
Table 3. Univariable and multivariable cox regression model analyses of OS for nomogram.
| Characteristics | Univariable analysis | Multivariable analysis | |||||||||||||||||||||||||||||||||||||||||||||||||||||||||||||||||||||||||||||||||||||||||||||||||
| OR | 95% CI lower | 95% CI upper | p-value | OR | 95% CI lower | 95% CI upper | p-value | ||||||||||||||||||||||||||||||||||||||||||||||||||||||||||||||||||||||||||||||||||||||||||||
| Gender | 0.004 | 0.010 | |||||||||||||||||||||||||||||||||||||||||||||||||||||||||||||||||||||||||||||||||||||||||||||||||
| Female | reference | reference | |||||||||||||||||||||||||||||||||||||||||||||||||||||||||||||||||||||||||||||||||||||||||||||||||
| Male | 1.140 | 1.042 | 1.248 | 0.004 | 1.127 | 1.028 | 1.235 | 0.010 | |||||||||||||||||||||||||||||||||||||||||||||||||||||||||||||||||||||||||||||||||||||||||||
| Age(years) | 0.322 | ||||||||||||||||||||||||||||||||||||||||||||||||||||||||||||||||||||||||||||||||||||||||||||||||||
| 18-29 | reference | NA | |||||||||||||||||||||||||||||||||||||||||||||||||||||||||||||||||||||||||||||||||||||||||||||||||
| 30-39 | 0.948 | 0.749 | 1.199 | 0.654 | |||||||||||||||||||||||||||||||||||||||||||||||||||||||||||||||||||||||||||||||||||||||||||||||
| 40-49 | 1.035 | 0.833 | 1.287 | 0.756 | |||||||||||||||||||||||||||||||||||||||||||||||||||||||||||||||||||||||||||||||||||||||||||||||
| Marital status | <0.001 | <0.001 | |||||||||||||||||||||||||||||||||||||||||||||||||||||||||||||||||||||||||||||||||||||||||||||||||
| Married | reference | reference | |||||||||||||||||||||||||||||||||||||||||||||||||||||||||||||||||||||||||||||||||||||||||||||||||
| Unmarried/NOS | 1.523 | 1.392 | 1.667 | <0.001 | 1.334 | 1.217 | 1.463 | <0.001 | |||||||||||||||||||||||||||||||||||||||||||||||||||||||||||||||||||||||||||||||||||||||||||
| Race | <0.001 | <0.001 | |||||||||||||||||||||||||||||||||||||||||||||||||||||||||||||||||||||||||||||||||||||||||||||||||
| White | reference | reference | |||||||||||||||||||||||||||||||||||||||||||||||||||||||||||||||||||||||||||||||||||||||||||||||||
| Black | 1.462 | 1.305 | 1.638 | <0.001 | 1.436 | 1.278 | 1.613 | <0.001 | |||||||||||||||||||||||||||||||||||||||||||||||||||||||||||||||||||||||||||||||||||||||||||
| Other/NOS | 0.939 | 0.808 | 1.093 | 0.417 | 0.923 | 0.793 | 1.074 | 0.300 | |||||||||||||||||||||||||||||||||||||||||||||||||||||||||||||||||||||||||||||||||||||||||||
| Tumor location | .151 | ||||||||||||||||||||||||||||||||||||||||||||||||||||||||||||||||||||||||||||||||||||||||||||||||||
| Right colon | reference | NA | |||||||||||||||||||||||||||||||||||||||||||||||||||||||||||||||||||||||||||||||||||||||||||||||||
| Left colon | 0.950 | 0.867 | 1.040 | 0.267 | |||||||||||||||||||||||||||||||||||||||||||||||||||||||||||||||||||||||||||||||||||||||||||||||
| NOS | 1.225 | 0.921 | 1.628 | 0.163 | |||||||||||||||||||||||||||||||||||||||||||||||||||||||||||||||||||||||||||||||||||||||||||||||
| Pathological grade | <0.001 | <0.001 | |||||||||||||||||||||||||||||||||||||||||||||||||||||||||||||||||||||||||||||||||||||||||||||||||
| I | reference | reference | |||||||||||||||||||||||||||||||||||||||||||||||||||||||||||||||||||||||||||||||||||||||||||||||||
| II | 1.171 | 0.946 | 1.449 | 0.146 | 1.071 | 0.863 | 1.328 | 0.534 | |||||||||||||||||||||||||||||||||||||||||||||||||||||||||||||||||||||||||||||||||||||||||||
| III | 1.856 | 1.484 | 2.322 | <0.001 | 1.339 | 1.067 | 1.681 | 0.012 | |||||||||||||||||||||||||||||||||||||||||||||||||||||||||||||||||||||||||||||||||||||||||||
| IV | 2.094 | 1.525 | 2.875 | <0.001 | 1.415 | 1.027 | 1.949 | 0.034 | |||||||||||||||||||||||||||||||||||||||||||||||||||||||||||||||||||||||||||||||||||||||||||
| NOS | 2.038 | 1.473 | 2.819 | <0.001 | 1.260 | 0.905 | 1.754 | 0.171 | |||||||||||||||||||||||||||||||||||||||||||||||||||||||||||||||||||||||||||||||||||||||||||
| Histological type | <0.001 | .059 | |||||||||||||||||||||||||||||||||||||||||||||||||||||||||||||||||||||||||||||||||||||||||||||||||
| Adenocarcinomas | reference | reference | |||||||||||||||||||||||||||||||||||||||||||||||||||||||||||||||||||||||||||||||||||||||||||||||||
| MCC/SRCC | 1.313 | 1.165 | 1.481 | <0.001 | 1.127 | 0.996 | 1.276 | 0.059 | |||||||||||||||||||||||||||||||||||||||||||||||||||||||||||||||||||||||||||||||||||||||||||
| T stage | <0.001 | <0.001 | |||||||||||||||||||||||||||||||||||||||||||||||||||||||||||||||||||||||||||||||||||||||||||||||||
| T1-2 | reference | reference | |||||||||||||||||||||||||||||||||||||||||||||||||||||||||||||||||||||||||||||||||||||||||||||||||
| T3 | 1.444 | 1.155 | 1.807 | 0.001 | 1.787 | 1.420 | 2.248 | <0.001 | |||||||||||||||||||||||||||||||||||||||||||||||||||||||||||||||||||||||||||||||||||||||||||
| T4a | 3.142 | 2.467 | 4.001 | <0.001 | 3.177 | 2.480 | 4.070 | <0.001 | |||||||||||||||||||||||||||||||||||||||||||||||||||||||||||||||||||||||||||||||||||||||||||
| T4b | 3.857 | 3.019 | 4.927 | <0.001 | 3.979 | 3.083 | 5.135 | <0.001 | |||||||||||||||||||||||||||||||||||||||||||||||||||||||||||||||||||||||||||||||||||||||||||
| N stage | <0.001 | <0.001 | |||||||||||||||||||||||||||||||||||||||||||||||||||||||||||||||||||||||||||||||||||||||||||||||||
| N0 | reference | reference | |||||||||||||||||||||||||||||||||||||||||||||||||||||||||||||||||||||||||||||||||||||||||||||||||
| N1 | 1.502 | 1.337 | 1.687 | <0.001 | 1.735 | 1.532 | 1.964 | <0.001 | |||||||||||||||||||||||||||||||||||||||||||||||||||||||||||||||||||||||||||||||||||||||||||
| N2 | 3.102 | 2.775 | 3.468 | <0.001 | 3.521 | 3.112 | 3.983 | <0.001 | |||||||||||||||||||||||||||||||||||||||||||||||||||||||||||||||||||||||||||||||||||||||||||
| Surgery | <0.001 | <0.001 | |||||||||||||||||||||||||||||||||||||||||||||||||||||||||||||||||||||||||||||||||||||||||||||||||
| Colectomy | reference | reference | |||||||||||||||||||||||||||||||||||||||||||||||||||||||||||||||||||||||||||||||||||||||||||||||||
| Non-colectomy/NOS | 3.522 | 2.593 | 4.782 | <0.001 | 2.426 | 1.724 | 3.414 | <0.001 | |||||||||||||||||||||||||||||||||||||||||||||||||||||||||||||||||||||||||||||||||||||||||||
| Radiotherapy | <0.001 | 0.228 | |||||||||||||||||||||||||||||||||||||||||||||||||||||||||||||||||||||||||||||||||||||||||||||||||
| Yes | reference | reference | |||||||||||||||||||||||||||||||||||||||||||||||||||||||||||||||||||||||||||||||||||||||||||||||||
| No/Unknown | 0.585 | 0.481 | 0.711 | <0.001 | .882 | 0.720 | 1.082 | 0.228 | |||||||||||||||||||||||||||||||||||||||||||||||||||||||||||||||||||||||||||||||||||||||||||
| Chemotherapy | <0.001 | <0.001 | |||||||||||||||||||||||||||||||||||||||||||||||||||||||||||||||||||||||||||||||||||||||||||||||||
| Yes | reference | reference | |||||||||||||||||||||||||||||||||||||||||||||||||||||||||||||||||||||||||||||||||||||||||||||||||
| No/Unknown | 0.836 | 0.759 | 0.921 | <0.001 | 1.242 | 1.118 | 1.380 | <0.001 | |||||||||||||||||||||||||||||||||||||||||||||||||||||||||||||||||||||||||||||||||||||||||||
| RNE | <0.001 | <0.001 | |||||||||||||||||||||||||||||||||||||||||||||||||||||||||||||||||||||||||||||||||||||||||||||||||
| <6 | reference | reference | |||||||||||||||||||||||||||||||||||||||||||||||||||||||||||||||||||||||||||||||||||||||||||||||||
| 6-11 | 0.638 | 0.516 | 0.789 | <0.001 | 0.638 | 0.507 | 0.802 | <0.001 | |||||||||||||||||||||||||||||||||||||||||||||||||||||||||||||||||||||||||||||||||||||||||||
| 12-17 | 0.527 | 0.433 | 0.641 | <0.001 | 0.496 | 0.400 | 0.615 | <0.001 | |||||||||||||||||||||||||||||||||||||||||||||||||||||||||||||||||||||||||||||||||||||||||||
| 18-23 | 0.480 | 0.392 | 0.587 | <0.001 | 0.438 | 0.351 | 0.546 | <0.001 | |||||||||||||||||||||||||||||||||||||||||||||||||||||||||||||||||||||||||||||||||||||||||||
| 24-39 | 0.411 | 0.329 | 0.512 | <0.001 | 0.375 | 0.296 | 0.476 | <0.001 | |||||||||||||||||||||||||||||||||||||||||||||||||||||||||||||||||||||||||||||||||||||||||||
| 30-35 | 0.396 | 0.309 | 0.507 | <0.001 | 0.355 | 0.273 | 0.462 | <0.001 | |||||||||||||||||||||||||||||||||||||||||||||||||||||||||||||||||||||||||||||||||||||||||||
| ≥36 | 0.455 | 0.365 | 0.567 | <0.001 | 0.427 | 0.336 | 0.541 | <0.001 | |||||||||||||||||||||||||||||||||||||||||||||||||||||||||||||||||||||||||||||||||||||||||||
| NOS | 0.998 | 0.654 | 1.523 | 0.992 | 0.700 | 0.454 | 1.078 | 0.106 | |||||||||||||||||||||||||||||||||||||||||||||||||||||||||||||||||||||||||||||||||||||||||||
| Tumor size | .267 | ||||||||||||||||||||||||||||||||||||||||||||||||||||||||||||||||||||||||||||||||||||||||||||||||||
| ≤5cm | reference | NA | |||||||||||||||||||||||||||||||||||||||||||||||||||||||||||||||||||||||||||||||||||||||||||||||||
| 5-10cm | 1.024 | 0.931 | 1.128 | 0.622 | |||||||||||||||||||||||||||||||||||||||||||||||||||||||||||||||||||||||||||||||||||||||||||||||
| >10cm | 1.187 | 0.958 | 1.472 | 0.118 | |||||||||||||||||||||||||||||||||||||||||||||||||||||||||||||||||||||||||||||||||||||||||||||||
| NOS | 1.150 | 0.941 | 1.407 | 0.173 | |||||||||||||||||||||||||||||||||||||||||||||||||||||||||||||||||||||||||||||||||||||||||||||||
| CEA | <0.001 | <0.001 | |||||||||||||||||||||||||||||||||||||||||||||||||||||||||||||||||||||||||||||||||||||||||||||||||
| Normal | reference | reference | |||||||||||||||||||||||||||||||||||||||||||||||||||||||||||||||||||||||||||||||||||||||||||||||||
| Elevated | 1.873 | 1.669 | 2.101 | <0.001 | 1.582 | 1.407 | 1.778 | <0.001 | |||||||||||||||||||||||||||||||||||||||||||||||||||||||||||||||||||||||||||||||||||||||||||
| NOS | 1.271 | 1.142 | 1.414 | <0.001 | 1.225 | 1.099 | 1.365 | <0.001 | |||||||||||||||||||||||||||||||||||||||||||||||||||||||||||||||||||||||||||||||||||||||||||
| MCC: mucinous cell carcinoma; SRCC: signet ring cell carcinoma; RNE: regional nodes examined; NOS: Not Otherwise Specified; NA: Unavailable. | |||||||||||||||||||||||||||||||||||||||||||||||||||||||||||||||||||||||||||||||||||||||||||||||||||
Table 4. Univariable and multivariable cox regression model analyses of CSS for nomogram.
| Characteristics | Univariable analysis | Multivariable analysis | |||||||||||||||||||||||||||||||||||||||||||||||||||||||||||||||||||||||||||||||||||||||||||||||||
| OR | 95% CI lower | 95% CI upper | p-value | OR | 95% CI lower | 95% CI upper | p-value | ||||||||||||||||||||||||||||||||||||||||||||||||||||||||||||||||||||||||||||||||||||||||||||
| Gender | 0.095 | ||||||||||||||||||||||||||||||||||||||||||||||||||||||||||||||||||||||||||||||||||||||||||||||||||
| Female | reference | NA | |||||||||||||||||||||||||||||||||||||||||||||||||||||||||||||||||||||||||||||||||||||||||||||||||
| Male | 1.093 | 0.985 | 1.212 | 0.095 | |||||||||||||||||||||||||||||||||||||||||||||||||||||||||||||||||||||||||||||||||||||||||||||||
| Age(years) | 0.699 | ||||||||||||||||||||||||||||||||||||||||||||||||||||||||||||||||||||||||||||||||||||||||||||||||||
| 18-29 | reference | NA | |||||||||||||||||||||||||||||||||||||||||||||||||||||||||||||||||||||||||||||||||||||||||||||||||
| 30-39 | 0.896 | 0.695 | 1.155 | 0.398 | |||||||||||||||||||||||||||||||||||||||||||||||||||||||||||||||||||||||||||||||||||||||||||||||
| 40-49 | 0.920 | 0.728 | 1.162 | 0.484 | |||||||||||||||||||||||||||||||||||||||||||||||||||||||||||||||||||||||||||||||||||||||||||||||
| Marital status | <0.001 | <0.001 | |||||||||||||||||||||||||||||||||||||||||||||||||||||||||||||||||||||||||||||||||||||||||||||||||
| Married | reference | reference | |||||||||||||||||||||||||||||||||||||||||||||||||||||||||||||||||||||||||||||||||||||||||||||||||
| Unmarried/NOS | 1.488 | 1.341 | 1.650 | <0.001 | 1.284 | 1.155 | 1.428 | <0.001 | |||||||||||||||||||||||||||||||||||||||||||||||||||||||||||||||||||||||||||||||||||||||||||
| Race | <0.001 | <0.001 | |||||||||||||||||||||||||||||||||||||||||||||||||||||||||||||||||||||||||||||||||||||||||||||||||
| White | reference | reference | |||||||||||||||||||||||||||||||||||||||||||||||||||||||||||||||||||||||||||||||||||||||||||||||||
| Black | 1.532 | 1.347 | 1.743 | <0.001 | 1.526 | 1.337 | 1.743 | <0.001 | |||||||||||||||||||||||||||||||||||||||||||||||||||||||||||||||||||||||||||||||||||||||||||
| Other/NOS | 1.010 | 0.853 | 1.196 | 0.911 | 0.991 | 0.836 | 1.174 | 0.913 | |||||||||||||||||||||||||||||||||||||||||||||||||||||||||||||||||||||||||||||||||||||||||||
| Tumor location | 0.260 | ||||||||||||||||||||||||||||||||||||||||||||||||||||||||||||||||||||||||||||||||||||||||||||||||||
| Right colon | reference | NA | |||||||||||||||||||||||||||||||||||||||||||||||||||||||||||||||||||||||||||||||||||||||||||||||||
| Left colon | 0.952 | 0.857 | 1.057 | 0.355 | |||||||||||||||||||||||||||||||||||||||||||||||||||||||||||||||||||||||||||||||||||||||||||||||
| NOS | 1.217 | 0.878 | 1.688 | 0.238 | |||||||||||||||||||||||||||||||||||||||||||||||||||||||||||||||||||||||||||||||||||||||||||||||
| Pathological grade | <0.001 | 0.002 | |||||||||||||||||||||||||||||||||||||||||||||||||||||||||||||||||||||||||||||||||||||||||||||||||
| I | reference | reference | |||||||||||||||||||||||||||||||||||||||||||||||||||||||||||||||||||||||||||||||||||||||||||||||||
| II | 1.191 | 0.927 | 1.529 | 0.171 | 1.045 | 0.812 | 1.346 | 0.732 | |||||||||||||||||||||||||||||||||||||||||||||||||||||||||||||||||||||||||||||||||||||||||||
| III | 2.009 | 1.547 | 2.610 | <0.001 | 1.323 | 1.014 | 1.727 | 0.039 | |||||||||||||||||||||||||||||||||||||||||||||||||||||||||||||||||||||||||||||||||||||||||||
| IV | 2.413 | 1.693 | 3.440 | <0.001 | 1.432 | 1.000 | 2.051 | 0.050 | |||||||||||||||||||||||||||||||||||||||||||||||||||||||||||||||||||||||||||||||||||||||||||
| NOS | 2.142 | 1.463 | 3.136 | <0.001 | 1.167 | 0.789 | 1.726 | 0.439 | |||||||||||||||||||||||||||||||||||||||||||||||||||||||||||||||||||||||||||||||||||||||||||
| Histological type | <0.001 | 0.079 | |||||||||||||||||||||||||||||||||||||||||||||||||||||||||||||||||||||||||||||||||||||||||||||||||
| Adenocarcinomas | reference | reference | |||||||||||||||||||||||||||||||||||||||||||||||||||||||||||||||||||||||||||||||||||||||||||||||||
| MCC/SRCC | 1.356 | 1.183 | 1.555 | <0.001 | 1.137 | 0.985 | 1.313 | 0.079 | |||||||||||||||||||||||||||||||||||||||||||||||||||||||||||||||||||||||||||||||||||||||||||
| T stage | <0.001 | <0.001 | |||||||||||||||||||||||||||||||||||||||||||||||||||||||||||||||||||||||||||||||||||||||||||||||||
| T1-2 | reference | reference | |||||||||||||||||||||||||||||||||||||||||||||||||||||||||||||||||||||||||||||||||||||||||||||||||
| T3 | 1.457 | 1.109 | 1.914 | 0.007 | 1.861 | 1.407 | 2.462 | <0.001 | |||||||||||||||||||||||||||||||||||||||||||||||||||||||||||||||||||||||||||||||||||||||||||
| T4a | 3.630 | 2.717 | 4.850 | <0.001 | 3.647 | 2.709 | 4.910 | <0.001 | |||||||||||||||||||||||||||||||||||||||||||||||||||||||||||||||||||||||||||||||||||||||||||
| T4b | 4.652 | 3.475 | 6.229 | <0.001 | 4.986 | 3.665 | 6.782 | <0.001 | |||||||||||||||||||||||||||||||||||||||||||||||||||||||||||||||||||||||||||||||||||||||||||
| N stage | <0.001 | <0.001 | |||||||||||||||||||||||||||||||||||||||||||||||||||||||||||||||||||||||||||||||||||||||||||||||||
| N0 | reference | reference | |||||||||||||||||||||||||||||||||||||||||||||||||||||||||||||||||||||||||||||||||||||||||||||||||
| N1 | 1.885 | 1.640 | 2.168 | <0.001 | 2.132 | 1.839 | 2.473 | <0.001 | |||||||||||||||||||||||||||||||||||||||||||||||||||||||||||||||||||||||||||||||||||||||||||
| N2 | 4.029 | 3.525 | 4.605 | <0.001 | 4.435 | 3.826 | 5.141 | <0.001 | |||||||||||||||||||||||||||||||||||||||||||||||||||||||||||||||||||||||||||||||||||||||||||
| Surgery | <0.001 | <0.001 | |||||||||||||||||||||||||||||||||||||||||||||||||||||||||||||||||||||||||||||||||||||||||||||||||
| Colectomy | reference | reference | |||||||||||||||||||||||||||||||||||||||||||||||||||||||||||||||||||||||||||||||||||||||||||||||||
| Non-colectomy/NOS | 3.732 | 2.642 | 5.271 | <0.001 | 2.846 | 1.915 | 4.228 | <0.001 | |||||||||||||||||||||||||||||||||||||||||||||||||||||||||||||||||||||||||||||||||||||||||||
| Radiotherapy | <0.001 | 0.431 | |||||||||||||||||||||||||||||||||||||||||||||||||||||||||||||||||||||||||||||||||||||||||||||||||
| Yes | reference | reference | |||||||||||||||||||||||||||||||||||||||||||||||||||||||||||||||||||||||||||||||||||||||||||||||||
| No/Unknown | 0.566 | 0.455 | 0.705 | <0.001 | 0.912 | 0.725 | 1.147 | 0.431 | |||||||||||||||||||||||||||||||||||||||||||||||||||||||||||||||||||||||||||||||||||||||||||
| Chemotherapy | <0.001 | 0.034 | |||||||||||||||||||||||||||||||||||||||||||||||||||||||||||||||||||||||||||||||||||||||||||||||||
| Yes | reference | reference | |||||||||||||||||||||||||||||||||||||||||||||||||||||||||||||||||||||||||||||||||||||||||||||||||
| No/Unknown | 0.708 | 0.631 | 0.795 | <0.001 | 1.144 | 1.010 | 1.296 | 0.034 | |||||||||||||||||||||||||||||||||||||||||||||||||||||||||||||||||||||||||||||||||||||||||||
| RNE | <0.001 | <0.001 | |||||||||||||||||||||||||||||||||||||||||||||||||||||||||||||||||||||||||||||||||||||||||||||||||
| <6 | reference | reference | |||||||||||||||||||||||||||||||||||||||||||||||||||||||||||||||||||||||||||||||||||||||||||||||||
| 6-11 | 0.660 | 0.517 | 0.842 | 0.001 | 0.637 | 0.488 | 0.830 | 0.001 | |||||||||||||||||||||||||||||||||||||||||||||||||||||||||||||||||||||||||||||||||||||||||||
| 12-17 | 0.512 | 0.408 | 0.642 | <0.001 | 0.464 | 0.361 | 0.597 | <0.001 | |||||||||||||||||||||||||||||||||||||||||||||||||||||||||||||||||||||||||||||||||||||||||||
| 18-23 | 0.496 | 0.393 | 0.625 | <0.001 | 0.431 | 0.333 | 0.558 | <0.001 | |||||||||||||||||||||||||||||||||||||||||||||||||||||||||||||||||||||||||||||||||||||||||||
| 24-39 | 0.407 | 0.315 | 0.524 | <0.001 | 0.352 | 0.266 | 0.465 | <0.001 | |||||||||||||||||||||||||||||||||||||||||||||||||||||||||||||||||||||||||||||||||||||||||||
| 30-35 | 0.362 | 0.271 | 0.484 | <0.001 | 0.312 | 0.228 | 0.427 | <0.001 | |||||||||||||||||||||||||||||||||||||||||||||||||||||||||||||||||||||||||||||||||||||||||||
| ≥36 | 0.429 | 0.332 | 0.555 | <0.001 | 0.384 | 0.290 | 0.510 | <0.001 | |||||||||||||||||||||||||||||||||||||||||||||||||||||||||||||||||||||||||||||||||||||||||||
| NOS | 1.036 | 0.645 | 1.664 | 0.883 | 0.695 | 0.427 | 1.131 | 0.143 | |||||||||||||||||||||||||||||||||||||||||||||||||||||||||||||||||||||||||||||||||||||||||||
| Tumor size | 0.011 | 0.352 | |||||||||||||||||||||||||||||||||||||||||||||||||||||||||||||||||||||||||||||||||||||||||||||||||
| ≤5cm | reference | reference | |||||||||||||||||||||||||||||||||||||||||||||||||||||||||||||||||||||||||||||||||||||||||||||||||
| 5-10cm | 1.060 | 0.949 | 1.184 | 0.304 | 1.052 | 0.936 | 1.183 | 0.394 | |||||||||||||||||||||||||||||||||||||||||||||||||||||||||||||||||||||||||||||||||||||||||||
| >10cm | 1.424 | 1.133 | 1.790 | 0.002 | 0.996 | 0.778 | 1.276 | 0.976 | |||||||||||||||||||||||||||||||||||||||||||||||||||||||||||||||||||||||||||||||||||||||||||
| NOS | 1.220 | 0.965 | 1.541 | 0.096 | 0.840 | 0.655 | 1.077 | 0.169 | |||||||||||||||||||||||||||||||||||||||||||||||||||||||||||||||||||||||||||||||||||||||||||
| CEA | <0.001 | <0.001 | |||||||||||||||||||||||||||||||||||||||||||||||||||||||||||||||||||||||||||||||||||||||||||||||||
| Normal | reference | reference | |||||||||||||||||||||||||||||||||||||||||||||||||||||||||||||||||||||||||||||||||||||||||||||||||
| Elevated | 1.932 | 1.692 | 2.205 | <0.001 | 1.551 | 1.354 | 1.775 | <0.001 | |||||||||||||||||||||||||||||||||||||||||||||||||||||||||||||||||||||||||||||||||||||||||||
| NOS | 1.327 | 1.173 | 1.502 | <0.001 | 1.277 | 1.127 | 1.448 | <0.001 | |||||||||||||||||||||||||||||||||||||||||||||||||||||||||||||||||||||||||||||||||||||||||||
| MCC: mucinous cell carcinoma; SRCC: signet ring cell carcinoma; RNE: regional nodes examined; NOS: Not Otherwise Specified; NA: Unavailable. | |||||||||||||||||||||||||||||||||||||||||||||||||||||||||||||||||||||||||||||||||||||||||||||||||||
Development and verification of prognostic nomograms
Based on the results of the multivariable Cox regression models, the nomograms predicting 3-, 5- and 10-year OS and CSS were created with the independent prognostic factors. By adding up the scores related to each variable and projecting total scores to the bottom scales, it is easy to calculate the estimated 3-, 5-, and 10-year OS and CSS probabilities.
The nomogram predicting OS and CSS for EOLACC displayed that T stage contributed the most to prognosis, followed by N stage, RNE and surgery (Figures 1A and 2A). Various methods were then performed to identify the discriminating superiority of the nomogram. The C-indexes of the nomogram for the prediction of OS were 0.723 (95%CI, 0.711-0.735), 0.730 (95%CI, 0.714-0.747) and 0.716 (95%CI, 0.644-0.789) in the training, verification and external verification group, respectively (Table 5). The calibration curves showed no obvious deviations from the reference line, which displayed an optimal agreement between actual observations and model prediction for 3-, 5-, 10-year OS (Figure 1B, 1E and 1H). The 3-, 5-, and 10-year AUC values of the nomogram for OS were 75.98%, 73.63%, 70.45% in the training cohort (Figure 1C); 76.53%, 75.33%, 70.06% in the verification cohort (Figure 1F); and 74.74%, 78.41%, 75.62% in the external verification group (Figure 1I), which revealed an excellent sensitivity and specificity for the predictive model. Moreover, DCA demonstrated the excellent clinical utility of the comprehensive nomogram, which possessed superior net benefits to the single independent predictor (Figure 1D, 1G and 1J).
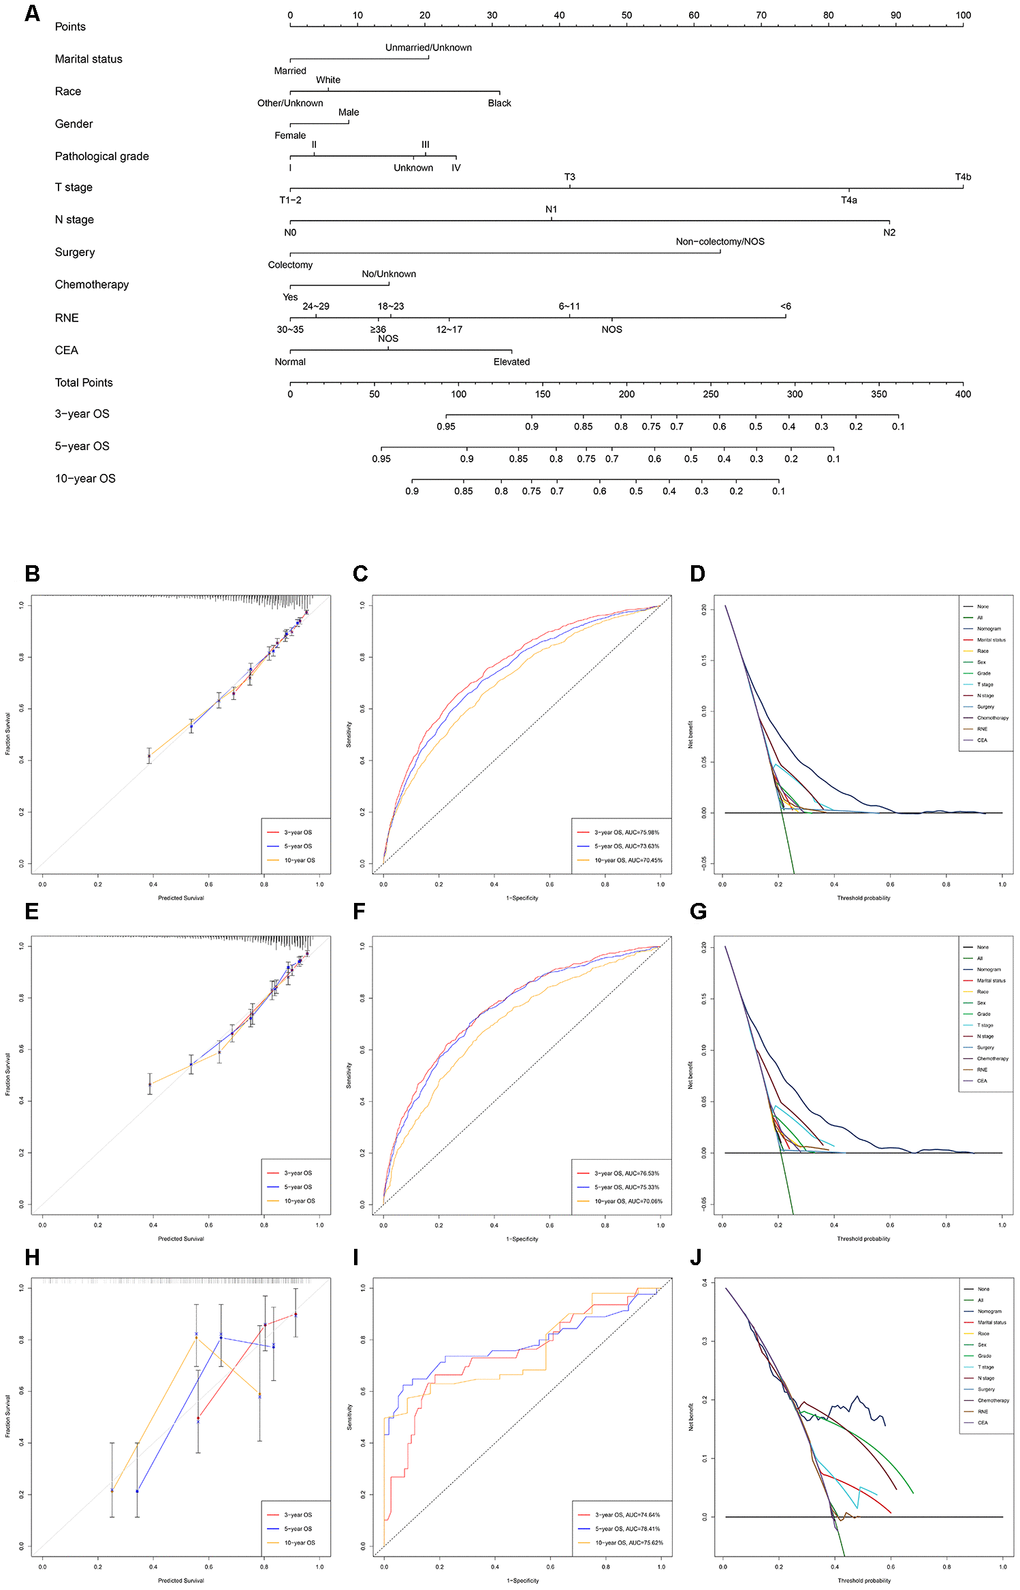
Figure 1. Development and verification of the nomogram predicting OS. (A) The nomogram of predicting OS for patients with EOLACC. (B) The calibration curves predicting OS in the training group. (C) The time-dependent ROC curves of nomogram predicting OS in the training group. (D) The decision curve analysis of the nomogram and all prognostic factors for OS in the training cohort. (E) The calibration curves predicting OS in the verification group. (F) The time-dependent ROC curves of nomogram predicting OS in the verification group. (G) The decision curve analysis of the nomogram and all prognostic factors for OS in the verification. (H) The calibration curves predicting OS in the external verification group. (I) The time-dependent ROC curves of nomogram predicting OS in the external verification group. (J) The decision curve analysis of the nomogram and all prognostic factors for OS in the external verification.
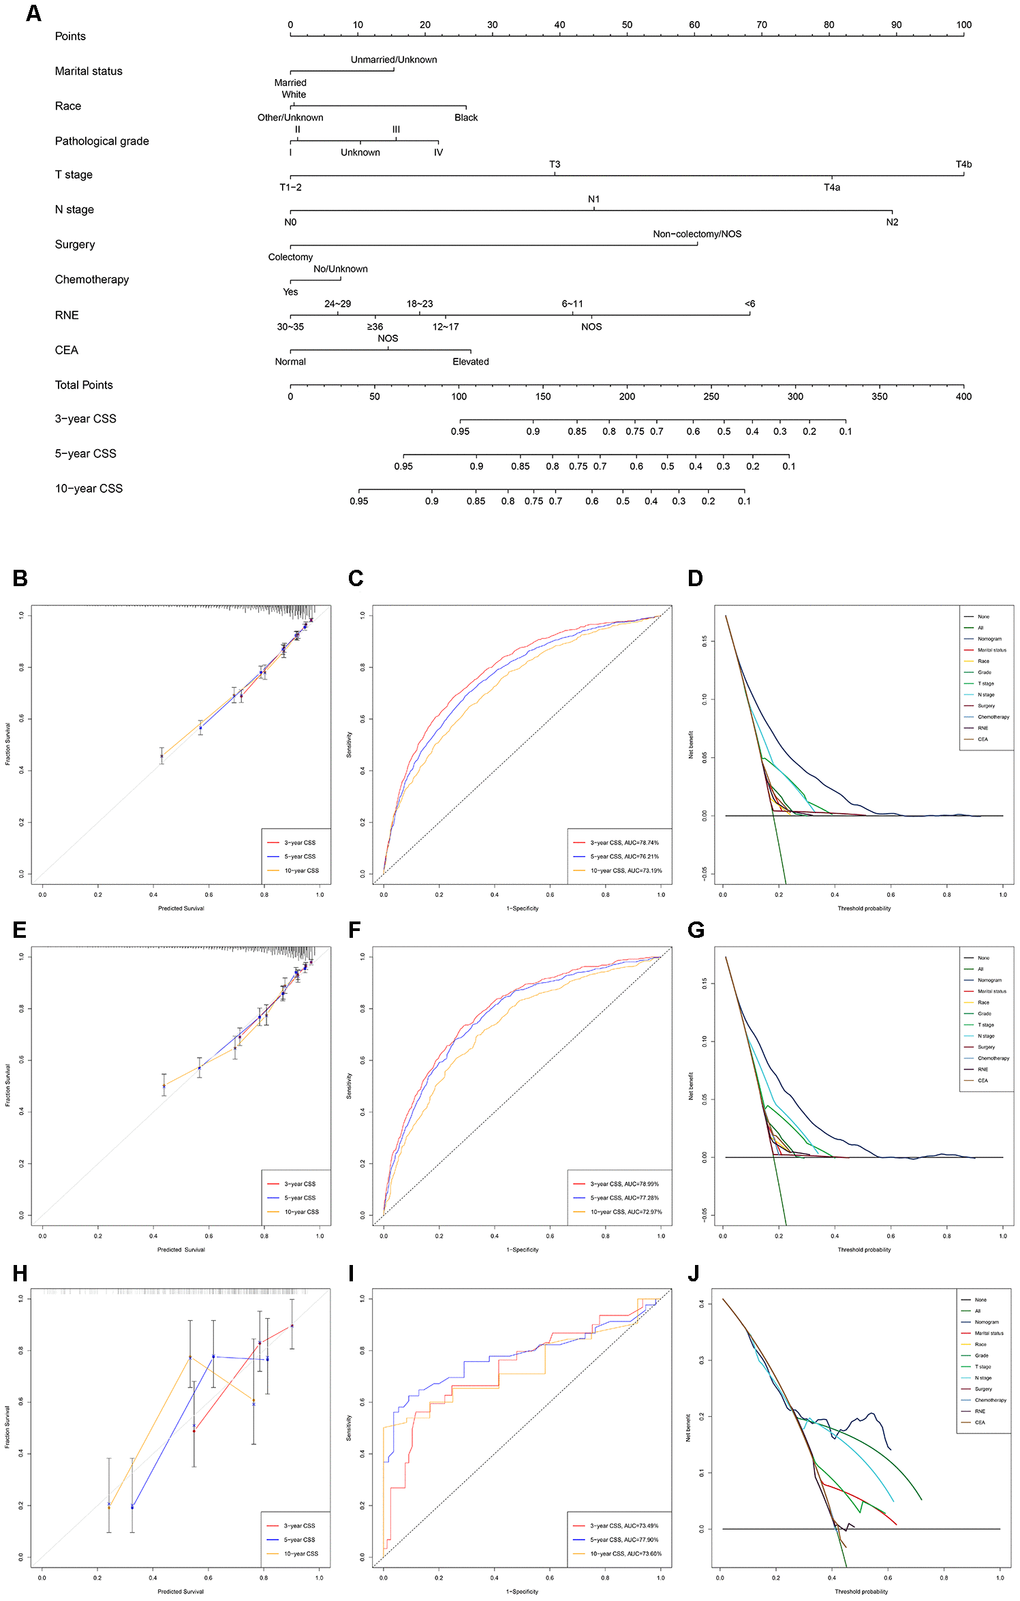
Figure 2. Development and verification of the nomogram predicting CSS. (A) The nomogram of predicting CSS for patients with EOLACC. (B) The calibration curves predicting CSS in the training group. (C) The time-dependent ROC curves of nomogram predicting CSS in the training group. (D) The decision curve analysis of the nomogram and all prognostic factors for CSS in the training cohort. (E) The calibration curves predicting CSS in the verification group. (F) The time-dependent ROC curves of nomogram predicting CSS in the verification group. (G) The decision curve analysis of the nomogram and all prognostic factors for CSS in the verification. (H) The calibration curves predicting CSS in the external verification group. (I) The time-dependent ROC curves of nomogram predicting CSS in the external verification group. (J) The decision curve analysis of the nomogram and all prognostic factors for CSS in the external verification.
Table 5. The C-indices for predictions of overall survival and cancer-specific survival.
| OS | CSS | ||||||||||||||||||||||||||||||||||||||||||||||||||||||||||||||||||||||||||||||||||||||||||||||||||
| C-index | 95% CI | C-index | 95% CI | ||||||||||||||||||||||||||||||||||||||||||||||||||||||||||||||||||||||||||||||||||||||||||||||||
| Training group | 0.723 | 0.711-0.735 | 0.751 | 0.738-0.764 | |||||||||||||||||||||||||||||||||||||||||||||||||||||||||||||||||||||||||||||||||||||||||||||||
| Validation group | 0.730 | 0.714-0.747 | 0.755 | 0.738-0.773 | |||||||||||||||||||||||||||||||||||||||||||||||||||||||||||||||||||||||||||||||||||||||||||||||
| External verification | 0.716 | 0.644-0.789 | 0.712 | 0.638-0.785 | |||||||||||||||||||||||||||||||||||||||||||||||||||||||||||||||||||||||||||||||||||||||||||||||
| Abbreviations: OS: overall survival; CSS: cancer-specific survival; C-index: index of concordance; CI: confidence interval. | |||||||||||||||||||||||||||||||||||||||||||||||||||||||||||||||||||||||||||||||||||||||||||||||||||
The discriminating superiority of the nomogram predicting CSS also performed well (C-index: 0.751, 95%CI 0.738-0.764 in the training group; 0.755, 95%CI 0.738-0.773 in the verification group; 0.712, 95%CI 0.638-0.785 in the external verification group. The 3-, 5-, and 10-year AUC values: 78.74%, 76.21%, 73.19% in the training group; 78.99%, 77.28%, 72.97% in the verification group; 73.49%, 77.90%, 73.60% in the external verification group) (Figure 2).
Performance of the nomograms in stratifying on the basis of risk points
X-tile software was utilized to classify patients as high-risk, medium-risk, and low-risk, according to the risk scores of the nomograms. The cut-off values were 133 and 221 for OS (Figure 3A), 130 and 200 for CSS (Figure 3B). The survival curves in the survival paradox of the AJCC staging system for colon cancer display that patients with T3-4N0 had a similar survival to those with T1-2N+ (OS: p=0.975, Figure 4A; CSS: p=0.709, Figure 4F). Figure 4B and 4G show the correspondence between AJCC stage and the risk stratification in this study.
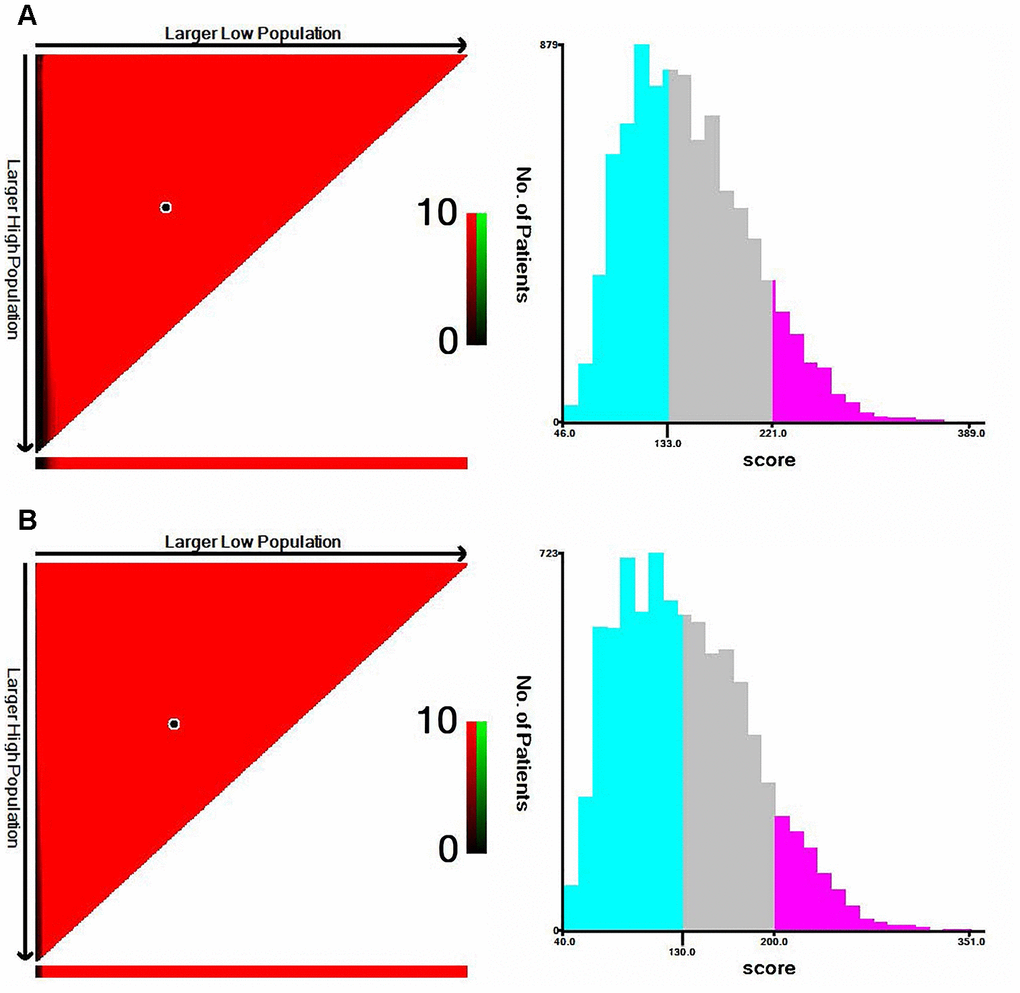
Figure 3. The cut-off values were calculated by using X-tile based on the total scores of nomograms. (A) The cut-off values were 133 and 221 for OS. (B) The cut-off values were 130 and 200 for CSS.
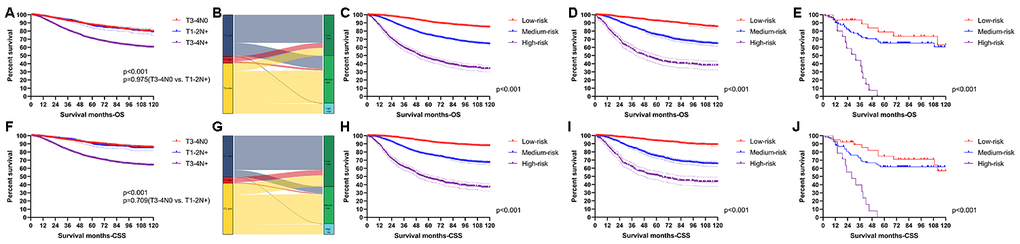
Figure 4. Performance of the nomograms in stratifying on the basis of risk points. (A) The difference of OS among T3-4N0, T1-2N+ and T3-4N+. (B) The correspondence between AJCC stage and the risk stratification based on the nomogram predicting OS. (C) OS in the subgroups according to the risk stratifying in the training cohort. (D) OS in the subgroups according to the risk stratifying in the verification cohort. (E) OS in the subgroups according to the risk stratifying in the external verification cohort. (F) The difference of CSS among T3-4N0, T1-2N+ and T3-4N+. (G) The correspondence between AJCC stage and the risk stratification based on the nomogram predicting CSS. (H) CSS in the subgroups according to the risk stratifying in the training cohort. (I) CSS in the subgroups according to the risk stratifying in the verification cohort. (J) OS in the subgroups according to the risk stratifying in the external verification cohort.
The risk stratification effectively avoided the survival paradox in this study. In the training cohort, the low-risk group showed the best 5-year survival rate (OS: 91.23%; CSS: 92.77%), followed by the medium-risk group (OS: 75.22%; CSS: 76.82%) and the high-risk group (OS: 46.05%; CSS: 47.71%) (Figure 4C and 4H). Similarly, the line of 5-year survival rate went from the low-risk group (OS: 92.38%; CSS: 93.59%) down to the medium-risk group (OS: 75.33%; CSS: 74.75%) and finally to the high-risk group (OS: 45.24%; CSS: 51.29%) (Figure 4D and 4I) in the verification cohort. The risk stratification system was also applicable to patients from our institution (OS: 78.79% in the low-risk group; 65.18% in the medium-risk group; 0.00% in the high-risk group; CSS: 74.90% in the low-risk group; 61.89% in the medium-risk group; 0.00% in the high-risk group) (Figure 4E and 4J).
Discussion
It is well-established that the vast majority of colon cancer occurs in patients over 50 years old. Colon cancer screening, therefore, begins in an average-risk population aged ≥50 years old [14–16]. Meanwhile, numerous studies have focused on colon cancer as a whole or even on elderly patients with colon cancer resulting in the fact that the current treatment strategies are tailored for late-onset colon cancer (in patients >50-years-old). However, early-onset colon cancer is epidemiologically, pathologically, biologically and metabolically different from late-onset colon cancer [17]. There is a current clinical unmet need regarding the diagnostic and therapeutic protocols that should be dedicated to young individuals with colon cancer.
Although widely used to evaluate the prognosis of various tumors, the AJCC staging system contains a survival paradox for locally advanced colon cancer, in that colon cancer patients with T3-4N0 (stage II) possess a similar or even worse survival compared to those with T1-2N+ (stage III) [11–13]. The survival paradox confirms that the AJCC staging system is inaccurate and insufficient for the medical demands related to locally advanced colon cancer. In fact, the root cause of the survival paradox is that T stage contributes more to prognosis than N stage, as the nomograms show. The risk stratification based on the points of the nomograms effectively avoids the survival paradox. Besides, the time-dependent ROC curve clearly shows that the nomograms possess superior sensitivity and specificity. The DCA curves indicate the comprehensive nomograms are conducive to making better clinical decisions in individual treatment compared to each independent predictor. Therefore, the survival nomograms for locally advanced colon cancer patients younger than 50years based on the SEER database are able to accurately evaluate OS and CSS of EOLACC patients and effectively solve the issue of the survival paradox.
Radical resection is the first-choice treatment for locally advanced colon cancer [18, 19]. Both nomograms predicting OS and CSS indicated the tremendous survival advantage of colectomy. Meanwhile, RNE was considered as the priority for the assessment of the quality of surgery [18, 20]. In fact, previous research identified RNE as an important prognostic factor [21, 22]. The general consensus exists that the postoperative specimens of radical operations for colon cancer should contain at least 12 regional lymph nodes, as recommended by the National Comprehensive Cancer Network (NCCN) guidelines [2]. However, previous research indicated that young patients with colorectal cancer suffered a higher risk of lymph node metastasis [23]. Is a minimum of 12 RNE adequate for EOLACC? The nomograms demonstrated that 30-35 RNE was the optimal option. Therefore, expanding lymph node dissection may be a more reasonable option for EOLACC patients.
Early-onset colon cancer patients were 2 to 4 times more likely to receive systemic chemotherapy, especially in multiagent irinotecan-based or oxaliplatin-based regimens, than late-onset patients in each disease stage [24]. However, the more intense chemotherapy did not provide young individuals with survival benefits comparable to those in late-onset colon cancer [24]. The mismatch between tumor treatment management and relative survival highlights the possibility of overtreatment and the increased risk of chemotherapy-related toxicity for early-onset colon cancer patients. Similarly, Manjelievskaia believed that the addition of systemic chemotherapy cannot offer the same survival improvement for early-onset colon cancer [4]. The nomograms confirmed that chemotherapy, which played an independent prognostic factor, contributed very little to improve OS and CSS of EOLACC in this study. Therefore, avoiding excessive chemotherapy for young colon cancer patients is the most notable finding. Patients with EOLACC were classified as high-risk, medium-risk, or low-risk according to the risk score of the nomograms in our study, which could provide a reference for EOLACC patients with respect to receiving chemotherapy or not.
Can the early-onset patients (< 50 years old) with locally advanced colon cancer be analyzed as a whole? This study divided the entire cohort into three sub-group according to age, including 18-29 years old, 30-39 years old and 40-49 years old. There is no significant difference in OS or CSS among the three subgroups in the COX regression analysis. Therefore, this study believed that it was reasonable to classify early-onset colon cancer as a whole, as many studies have done [4, 6, 24–26]. A large body of studies reported that the survival of colon cancer was related to the primary tumor location [27]. However, the primary tumor location cannot be used as an independent prognostic factor in EOLACC patients. The current treatment strategies, including surgery and chemotherapy, may bring approximate survival benefits for right colon cancer and left colon cancer.
To the best of our knowledge, this study was the first to create and validate survival nomograms for EOLACC based on the SEER database. The previous nomograms [19, 21, 28], mainly addressing elderly patients, are not suitable for early-onset colon cancer patients owing to the unequal contribution of each prognostic factor, especially chemotherapy and RNE. Our nomograms focused on EOLACC and were verified by the external information. However, there were some limitations in our study. Firstly, as a retrospective study, the nomograms still need to be validated in the future by prospective studies. Secondarily, detailed treatment information for included patients were not recorded in the SEER cohort, and we could not investigate specific options, including chemotherapy regimens and specific surgical methods, etc., in the survival of EOLACC patients. Lastly, the nomograms need to be verified by more data since the sample size of the external verification group was small.
In conclusion, we established and validated nomograms for predicting OS and CSS based on a national cohort of almost 13,000 patients with EOLACC. The nomograms could effectively solve the survival paradox of the AJCC staging system and be an excellent tool to integrate clinical characteristics to guide the therapeutic choice for EOLACC patients.
Materials and Methods
Data sources
The clinicopathological data of all EOLACC patients were retrieved from the SEER program. The SEER Program of the National Cancer Institute is an authoritative source of information on cancer incidence and survival in the United States that is updated annually. The target population was limited to patients who were older than 18 and younger than 50, with Stage II and III colon adenocarcinoma (ICD-O-3: 8140, 8144, 8201, 8210, 8211, 8220, 8221, 8255, 8260, 8261, 8262, 8263, 8323, 8440, 8460, 8470, 8472, 8480, 8481, 8490), 14,056 patients in total. According to CS extension (http://web2.facs.org/cstage0205/colon/Colon_bao.html), T stage was re-classified to align with the 8th AJCC staging system. Exclusion criteria: diagnosed at autopsy or death certificate (n=6); survival months is 0 (n=246); without Positive histology (n=7); missing detail information for transforming to 8th AJCC staging (n=42). The final study sample contained 13,755 patients with early-onset locally advanced colon cancer (T3-4 and/or N+) (Figure 5).
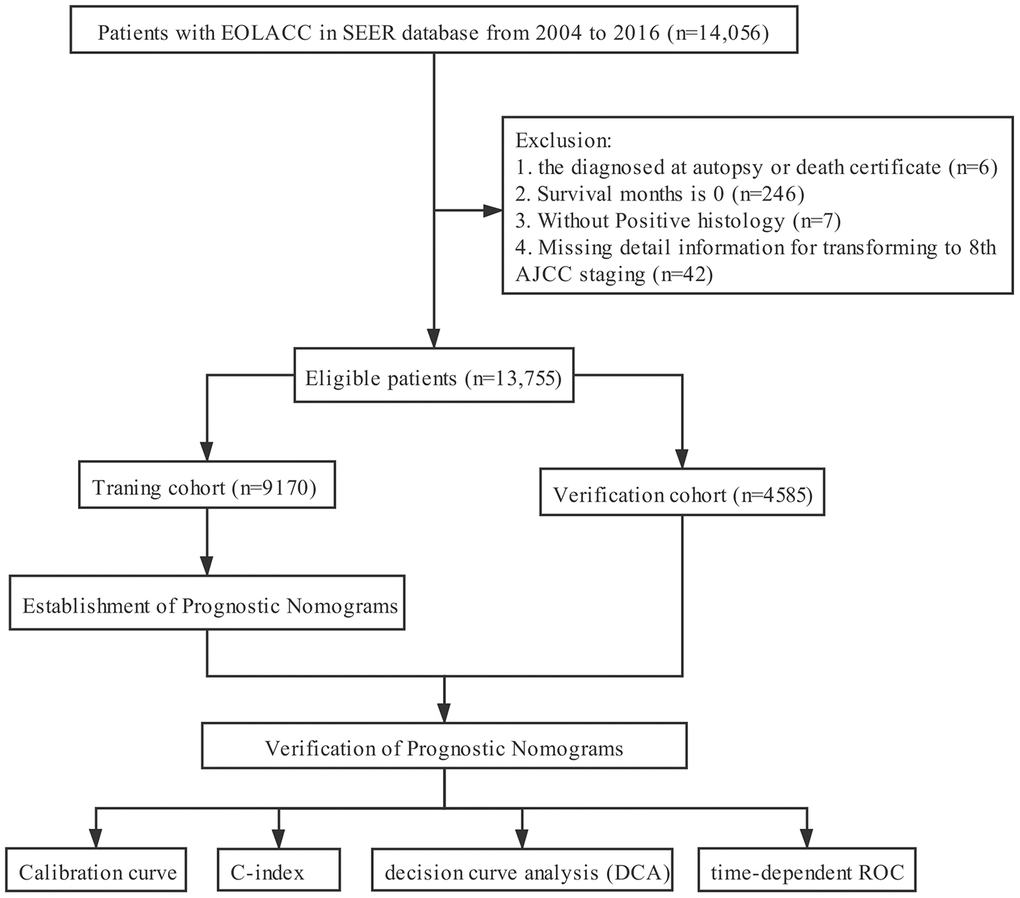
Figure 5. The flow diagram.
For each patient, the following demographic, clinical, pathological and therapeutic variables were acquired: gender, age at diagnosis, race/ethnicity, marital status, tumor size, tumor location, pathological grade, histological type, T stage, N stage, surgery, chemotherapy, radiotherapy, regional nodes examined (RNE), CEA and follow-up information. All qualified patients were randomly divided into two cohorts at the ratio of 2:1 (training cohort, n =9170, and validation cohort, n =4585).
126 EOLACC patients from the Department of Gastrointestinal Surgery of Xiangya Hospital, Central South University (Changsha, China) served as the external verification group. The admission time of these patients was from January 1, 2009 to July 31, 2019. The termination of follow-up was July 31, 2020, in this study. Patients with missing follow-up data were excluded.
Statistical analysis
A 95% confidence interval (CI) and a hazard ratio (HR) were calculated by Cox regression models. The potential prognostic factors with significant differences in the univariate Cox regression analysis were incorporated into multivariate analysis. Then, nomograms were constructed and assessed to predict 3-, 5-, and 10-year survival rates, including OS and CSS, in EOLACC patients by means of R software based on the multivariate analysis results. The distinguishing ability of the novel nomograms was verified by various methods, involving the concordance index (C-index), time-dependent receiver operating characteristic (ROC) curve and the value of the area under the ROC curve (AUC). The calibration curves were plotted to compare the nomogram-predicted survival with the actual survival. The decision curve analysis (DCA) was performed to determine the clinical usefulness by quantifying the net benefits at different threshold probabilities.
X-tile software (Yale University, New Haven, CT, USA) (version 3.6.1) was used to identify the optimal cut-off values. Statistical analyses were performed with R software (version 3.6.1, http://www.r-project.org/) and IBM SPSS software (version 25.0) (IBM, Armonk, NY, USA). The related R packages ‘rms’, ‘survival’, ‘magick’, ‘timeROC’, ‘ggplotify’ and ‘cowplot’ were applied in construction and assessment of the nomograms. All reported p-values lower than 0.05 were considered significant.
Ethics approval
Approval from the ethical board for this study was not required because of the public nature of all the data.
Author Contributions
Yuqiang Li, Wenxue Liu and Fengbo Tan conceived and designed the study. Yuqiang Li and Wenxue Liu wrote the article. Lilan Zhao downloaded and screened the data from SEER database. Zhongyi Zhou, Heming Ge and Qian Pei collected the data from our institute using for external verification. All authors participated in analyzing the data. All authors read and approved the final manuscript.
Acknowledgments
The first author, Yuqiang Li, gratefully acknowledges financial support from China Scholarship Council.
Conflicts of Interest
The authors declare that they have no conflicts of interest.
Funding
This study was supported by the Nature Scientific Foundation of China (Grant No.81702956); the Strategy-Oriented Special Project of Central South University in China (Grant No. ZLXD2017003); the Natural Science Foundation of Hunan Province “The effect and mechanism of SSH1L mediate YAP1 activity on invasion and metastasis of colorectal cancer” and “Study of ECM stiffness responsed FIRRE as ceRNA of MAPK1 to promote invasion and metastasis of colorectal cancer”.
References
- 1. Siegel RL, Miller KD, Jemal A. Cancer statistics, 2019. CA Cancer J Clin. 2019; 69:7–34. https://doi.org/10.3322/caac.21551 [PubMed]
- 2. Clinical Practice Guidelines in Oncology (NCCN Guidelines®), Colon Cancer, Version 2.2020.
- 3. Bailey CE, Hu CY, You YN, Bednarski BK, Rodriguez-Bigas MA, Skibber JM, Cantor SB, Chang GJ. Increasing disparities in the age-related incidences of colon and rectal cancers in the United States, 1975-2010. JAMA Surg. 2015; 150:17–22. https://doi.org/10.1001/jamasurg.2014.1756 [PubMed]
- 4. Manjelievskaia J, Brown D, McGlynn KA, Anderson W, Shriver CD, Zhu K. Chemotherapy use and survival among young and middle-aged patients with colon cancer. JAMA Surg. 2017; 152:452–59. https://doi.org/10.1001/jamasurg.2016.5050 [PubMed]
- 5. Li J, Yuan Y, Yang F, Wang Y, Zhu X, Wang Z, Zheng S, Wan D, He J, Wang J, Ba Y, Bai C, Bai L, et al. Expert consensus on multidisciplinary therapy of colorectal cancer with lung metastases (2019 edition). J Hematol Oncol. 2019; 12:16. https://doi.org/10.1186/s13045-019-0702-0 [PubMed]
- 6. Russo AG, Andreano A, Sartore-Bianchi A, Mauri G, Decarli A, Siena S. Increased incidence of colon cancer among individuals younger than 50 years: a 17 years analysis from the cancer registry of the municipality of Milan, Italy. Cancer Epidemiol. 2019; 60:134–40. https://doi.org/10.1016/j.canep.2019.03.015 [PubMed]
- 7. Tamas K, Walenkamp AM, de Vries EG, van Vugt MA, Beets-Tan RG, van Etten B, de Groot DJ, Hospers GA. Rectal and colon cancer: not just a different anatomic site. Cancer Treat Rev. 2015; 41:671–79. https://doi.org/10.1016/j.ctrv.2015.06.007 [PubMed]
- 8. O’Connell MJ, Lavery I, Yothers G, Paik S, Clark-Langone KM, Lopatin M, Watson D, Baehner FL, Shak S, Baker J, Cowens JW, Wolmark N. Relationship between tumor gene expression and recurrence in four independent studies of patients with stage II/III colon cancer treated with surgery alone or surgery plus adjuvant fluorouracil plus leucovorin. J Clin Oncol. 2010; 28:3937–44. https://doi.org/10.1200/JCO.2010.28.9538 [PubMed]
- 9. Benson AB
3rd , Hamilton SR. Path toward prognostication and prediction: an evolving matrix. J Clin Oncol. 2011; 29:4599–601. https://doi.org/10.1200/JCO.2011.37.8646 [PubMed] - 10. Hankey BF, Ries LA, Edwards BK. The surveillance, epidemiology, and end results program: a national resource. Cancer Epidemiol Biomarkers Prev. 1999; 8:1117–21. [PubMed]
- 11. Kim MJ, Jeong SY, Choi SJ, Ryoo SB, Park JW, Park KJ, Oh JH, Kang SB, Park HC, Heo SC, Park JG. Survival paradox between stage IIB/C (T4N0) and stage IIIA (T1-2N1) colon cancer. Ann Surg Oncol. 2015; 22:505–12. https://doi.org/10.1245/s10434-014-3982-1 [PubMed]
- 12. Li J, Guo BC, Sun LR, Wang JW, Fu XH, Zhang SZ, Poston G, Ding KF. TNM staging of colorectal cancer should be reconsidered by T stage weighting. World J Gastroenterol. 2014; 20:5104–12. https://doi.org/10.3748/wjg.v20.i17.5104 [PubMed]
- 13. Gunderson LL, Jessup JM, Sargent DJ, Greene FL, Stewart AK. Revised TN categorization for colon cancer based on national survival outcomes data. J Clin Oncol. 2010; 28:264–71. https://doi.org/10.1200/JCO.2009.24.0952 [PubMed]
- 14. Bibbins-Domingo K, Grossman DC, Curry SJ, Davidson KW, Epling JW
Jr , García FA, Gillman MW, Harper DM, Kemper AR, Krist AH, Kurth AE, Landefeld CS, Mangione CM, et al, and US Preventive Services Task Force. Screening for colorectal cancer: US preventive services task force recommendation statement. JAMA. 2016; 315:2564–75. https://doi.org/10.1001/jama.2016.5989 [PubMed] - 15. Rex DK, Boland CR, Dominitz JA, Giardiello FM, Johnson DA, Kaltenbach T, Levin TR, Lieberman D, Robertson DJ. Colorectal cancer screening: recommendations for physicians and patients from the U.S. Multi-society task force on colorectal cancer. Gastroenterology. 2017; 153:307–23. https://doi.org/10.1053/j.gastro.2017.05.013 [PubMed]
- 16. Sung JJ, Ng SC, Chan FK, Chiu HM, Kim HS, Matsuda T, Ng SS, Lau JY, Zheng S, Adler S, Reddy N, Yeoh KG, Tsoi KK, et al, and Asia Pacific Working Group. An updated Asia pacific consensus recommendations on colorectal cancer screening. Gut. 2015; 64:121–32. https://doi.org/10.1136/gutjnl-2013-306503 [PubMed]
- 17. Stoffel EM, Murphy CC. Epidemiology and mechanisms of the increasing incidence of colon and rectal cancers in young adults. Gastroenterology. 2020; 158:341–53. https://doi.org/10.1053/j.gastro.2019.07.055 [PubMed]
- 18. Li Y, Zhao L, Güngör C, Tan F, Zhou Z, Li C, Song X, Wang D, Pei Q, Liu W. The main contributor to the upswing of survival in locally advanced colorectal cancer: an analysis of the SEER database. Therap Adv Gastroenterol. 2019; 12:1756284819862154. https://doi.org/10.1177/1756284819862154 [PubMed]
- 19. Zheng P, Lai C, Yang W, Guo J, Xiao S, Chen Z. Nomogram predicting cancer-specific survival in elderly patients with stages I-III colon cancer. Scand J Gastroenterol. 2020; 55:202–208. https://doi.org/10.1080/00365521.2020.1720280 [PubMed]
- 20. Cai Y, Cheng G, Lu X, Ju H, Zhu X. The re-evaluation of optimal lymph node yield in stage II right-sided colon cancer: is a minimum of 12 lymph nodes adequate? Int J Colorectal Dis. 2020; 35:623–31. https://doi.org/10.1007/s00384-019-03483-z [PubMed]
- 21. Zhou Z, Mo S, Dai W, Xiang W, Han L, Li Q, Wang R, Liu L, Zhang L, Cai S, Cai G. Prognostic nomograms for predicting cause-specific survival and overall survival of stage I-III colon cancer patients: a large population-based study. Cancer Cell Int. 2019; 19:355. https://doi.org/10.1186/s12935-019-1079-4 [PubMed]
- 22. Ning FL, Pei JP, Zhang NN, Wang J, Quan HG, Mei ZB, Zeng XT, Abe M, Zhang CD. Harvest of at least 18 lymph nodes is associated with improved survival in patients with pN0 colon cancer: a retrospective cohort study. J Cancer Res Clin Oncol. 2020; 146:2117–33. https://doi.org/10.1007/s00432-020-03212-y [PubMed]
- 23. Li M, Zhang J, Dan Y, Yao Y, Dai W, Cai G, Yang G, Tong T. A clinical-radiomics nomogram for the preoperative prediction of lymph node metastasis in colorectal cancer. J Transl Med. 2020; 18:46. https://doi.org/10.1186/s12967-020-02215-0 [PubMed]
- 24. Kneuertz PJ, Chang GJ, Hu CY, Rodriguez-Bigas MA, Eng C, Vilar E, Skibber JM, Feig BW, Cormier JN, You YN. Overtreatment of young adults with colon cancer: more intense treatments with unmatched survival gains. JAMA Surg. 2015; 150:402–09. https://doi.org/10.1001/jamasurg.2014.3572 [PubMed]
- 25. Chen JN, Zhang QW, Pan YB, Wang QW, Zhang XT, Li XB. Young-onset early colorectal cancer had similar relative survival to but better overall survival than conventional early colorectal cancer: a large population-based study. Front Oncol. 2020; 10:96. https://doi.org/10.3389/fonc.2020.00096 [PubMed]
- 26. Hofseth LJ, Hebert JR, Chanda A, Chen H, Love BL, Pena MM, Murphy EA, Sajish M, Sheth A, Buckhaults PJ, Berger FG. Early-onset colorectal cancer: initial clues and current views. Nat Rev Gastroenterol Hepatol. 2020; 17:352–364. https://doi.org/10.1038/s41575-019-0253-4 [PubMed]
- 27. Ghidini M, Petrelli F, Tomasello G. Right versus left colon cancer: resectable and metastatic disease. Curr Treat Options Oncol. 2018; 19:31. https://doi.org/10.1007/s11864-018-0544-y [PubMed]
- 28. Wang Z, Wang Y, Yang Y, Luo Y, Liu J, Xu Y, Liu X. A competing-risk nomogram to predict cause-specific death in elderly patients with colorectal cancer after surgery (especially for colon cancer). World J Surg Oncol. 2020; 18:30. https://doi.org/10.1186/s12957-020-1805-3 [PubMed]