


Introduction
Lung cancer, particularly non-small-cell lung cancer (NSCLC) and small-cell lung cancer, is a malignant tumor with the highest rate of cancer-related mortality worldwide [1]. NSCLC accounts for 80–85% of cases of diagnosed lung cancer and can be pathologically divided into three types, namely, adenocarcinoma, squamous cell carcinoma, and large-cell carcinoma [2]. Among these subtypes, lung adenocarcinoma (LUAD) is the most prevalent, accounting for approximately 40% of all lung tumors [3]. However, it has been reported that LUAD is a highly heterogeneous and aggressive disease, which is frequently associated with genetic alterations, including TP53, Kirsten rat sarcoma viral oncogene homolog (KRAS), and epidermal growth factor receptor (EGFR) gene mutations, as well as the anaplastic lymphoma kinase (ALK)–NPM fusion [4]. Advances in chemotherapy, radiation therapy, and targeted therapy have reduced mortality among patients with LUAD over the years; however, the long-term survival rates have barely improved, especially compared with those of other cancers [5]. Thus, it is imperative to explore the molecular mechanisms of LUAD progression and develop better tumor prognostic markers that accurately predict the survival of patients with LUAD [6, 7].
Epithelial–mesenchymal transition (EMT) is a biological process whereby epithelial cells acquire a mesenchymal phenotype. During EMT, epithelial cells lose their adhesiveness, secrete enzymes that dissolve the extracellular matrix, and acquire migratory ability [8]. Recently, an increasing number of studies have demonstrated that EMT leads to tumor metastasis and is an important process by which more than 90% of malignant epithelial cells become involved in carcinogenesis in adults [9–11]. Furthermore, a number of studies have reported that EMT is a marker of poor prognosis in patients with LUAD [12–15]. However, the information on the prognostic significance of EMT-related genes (ERGs) and their biological function in LUAD remains rudimentary and inconclusive.
Therefore, the development of new biomarkers, based on ERG signatures, may optimize the selection of patients at the highest risk of mortality and provide novel insights into gene-targeting therapy. To this end, this study aimed to identify an ERG signature that could predict the prognosis of patients with LUAD with high accuracy.
Results
Development of an ERG signature using a training set
To examine the correlation of gene expression profiles with EMT scores, the expression data for ERGs and corresponding survival time were subjected to univariate Cox regression analysis. Eventually, 139 and 293 ERGs were found to be significantly correlated with the prognosis of patients based on The Cancer Genome Atlas (TCGA) and GSE31210 datasets, respectively (P < 0.05; Supplementary Tables 1, 2). Thereafter, 54 prognostic ERGs that overlapped between the two datasets were used to develop a prognostic gene signature (Figure 1A). Using LASSO-penalized Cox regression analysis of the training set, we identified 19 genes (Figure 1B, 1C). Subsequently, multivariate Cox regression analysis was used to establish the ERG signature, and nine genes were finally selected as predictors of overall survival (OS) in patients with LUAD (Figure 1D).
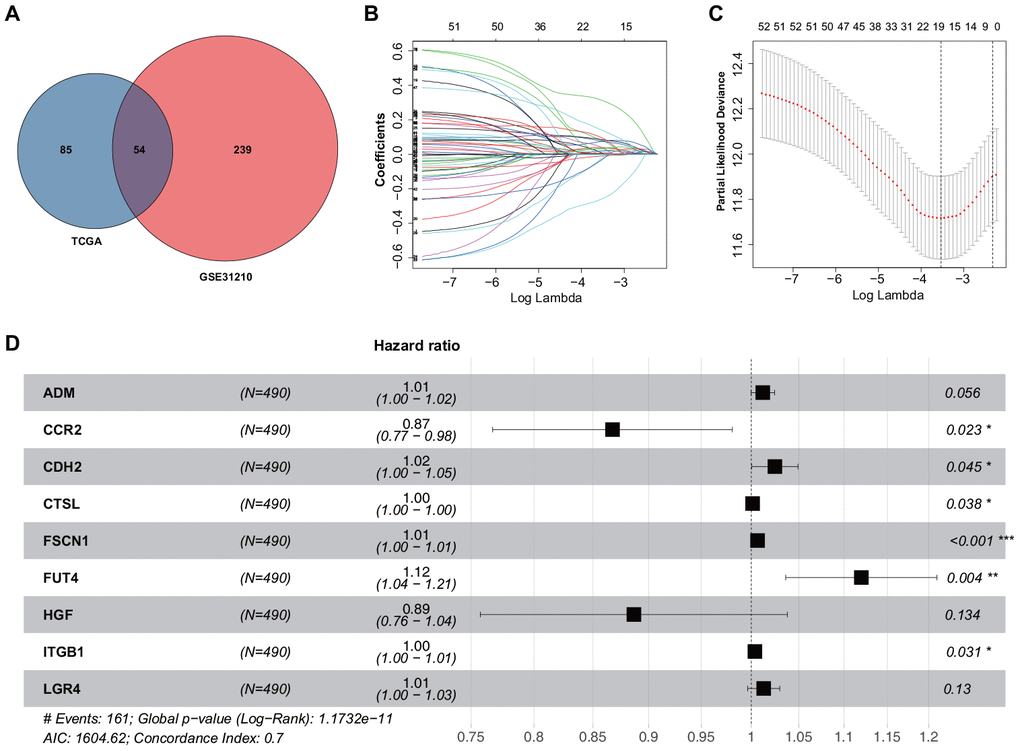
Figure 1. Construction of the ERG signature. (A) Identification of ERGs correlated with survival. (B) LASSO coefficients of the ERGs. Each curve represents an ERG. (C) Cross-validation of gene selection using 1-SE criteria in the LASSO regression analysis. (D) Forest plot of multivariate Cox regression analysis.
ERG expression and alterations in LUAD
The mRNA expression levels of the nine identified ERGs that were selected as the LUAD signature were examined using the training set. It was found that in the LUAD tissue samples, the adrenomedullin (ADM), cadherin 2 (CDH2), cathepsin L (CTSL), fascin-1 (FSCN1), fucosyltransferase 4 (FUT4), integrin beta-1 (ITGB1), and leucine-rich repeat-containing G-protein-coupled receptor 4 (LGR4) gene expression levels were significantly higher and the C-C chemokine receptor 2 (CCR2) and hepatocyte growth factor (HGF) gene expression levels were significantly lower than those in the normal lung tissues (Figure 2A). To further validate the data, the corresponding protein expression levels were analyzed using the Human Protein Atlas (HPA) database. It was found that the protein levels matched the mRNA expression levels of these ERGs (Figure 2B).
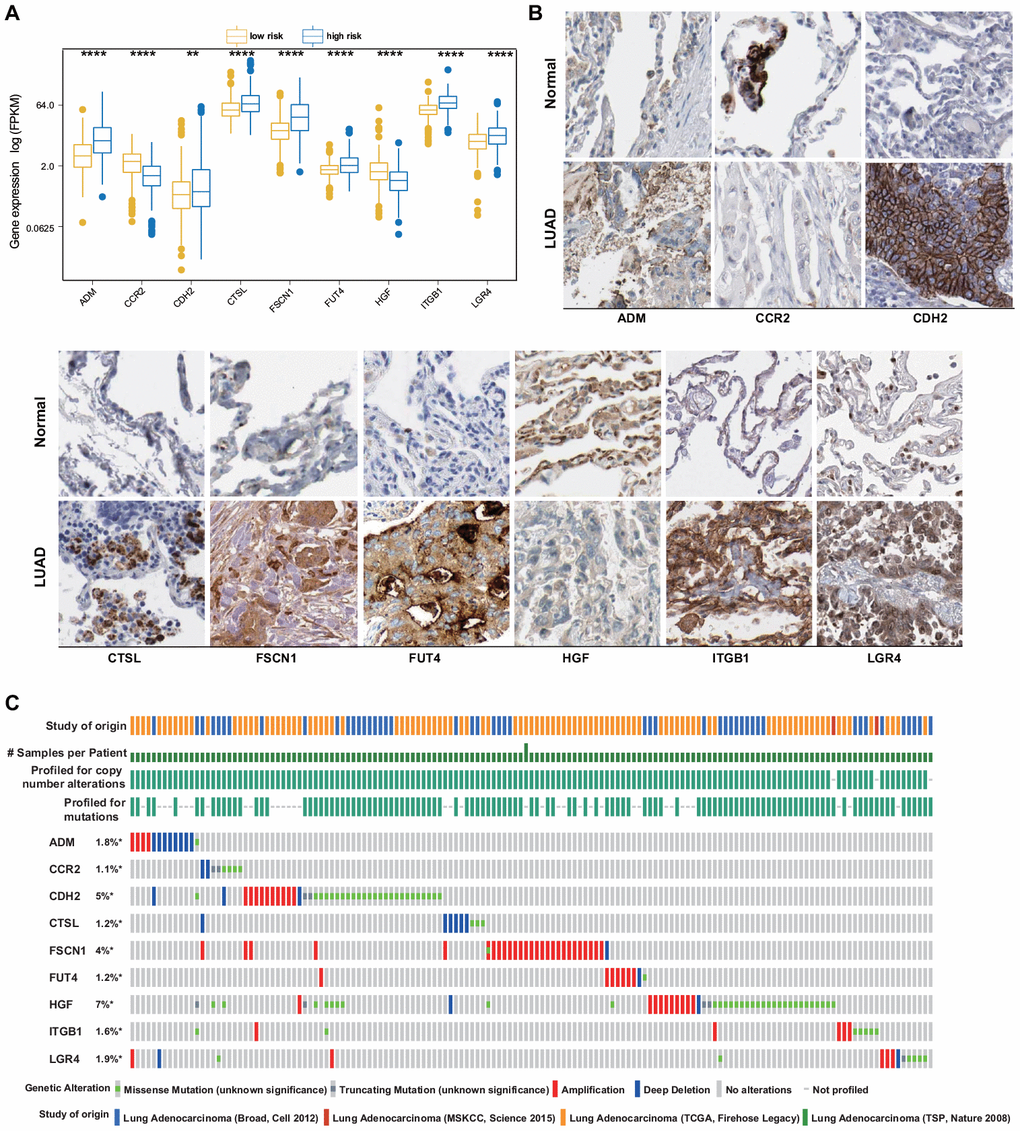
Figure 2. ERG expression and mutation landscape of LUAD. (A) Comparison of mRNA expression levels between LUAD and normal tissues in the training set. (B) Comparison of protein levels between LUAD and normal tissues in the HPA. (C) Mutational profiles of LUAD (obtained from the cBioPortal for Cancer Genomics).
The presence of potential genetic alterations in our signature was explored in patients with LUAD using the cBioPortal database, including four LUAD datasets. Among these datasets, the rates of gene alterations, including missense and truncating mutations, amplifications, and deep deletions, ranged from 1.1% to 7%, with amplifications being the most commonly observed alterations (Figure 2C).
Gene set enrichment analysis (GSEA) and gene set variation analysis (GSVA)
Further, we investigated and compared the potential functional mechanisms between high- and low-risk groups. GSEA was conducted on the training set, and a number of enriched terms were observed in the high-risk group, most of which were cancer-related biological functions and signaling pathways. The top five Gene Ontology (GO) biological processes and Kyoto Encyclopedia of Genes and Genomes (KEGG) pathways, which include the chromosomal region, chromosome segregation, condensed chromosome, cell cycle, DNA replication, and homologous recombination, are shown in Figure 3A, 3B. The GSVA results demonstrated that the EMT-related signaling pathways, such as E2F targets, G2M checkpoint, MYC targets v1, MYC targets v2, and Mtorc1 signaling, were significantly activated in the high-risk group (Figure 3C).
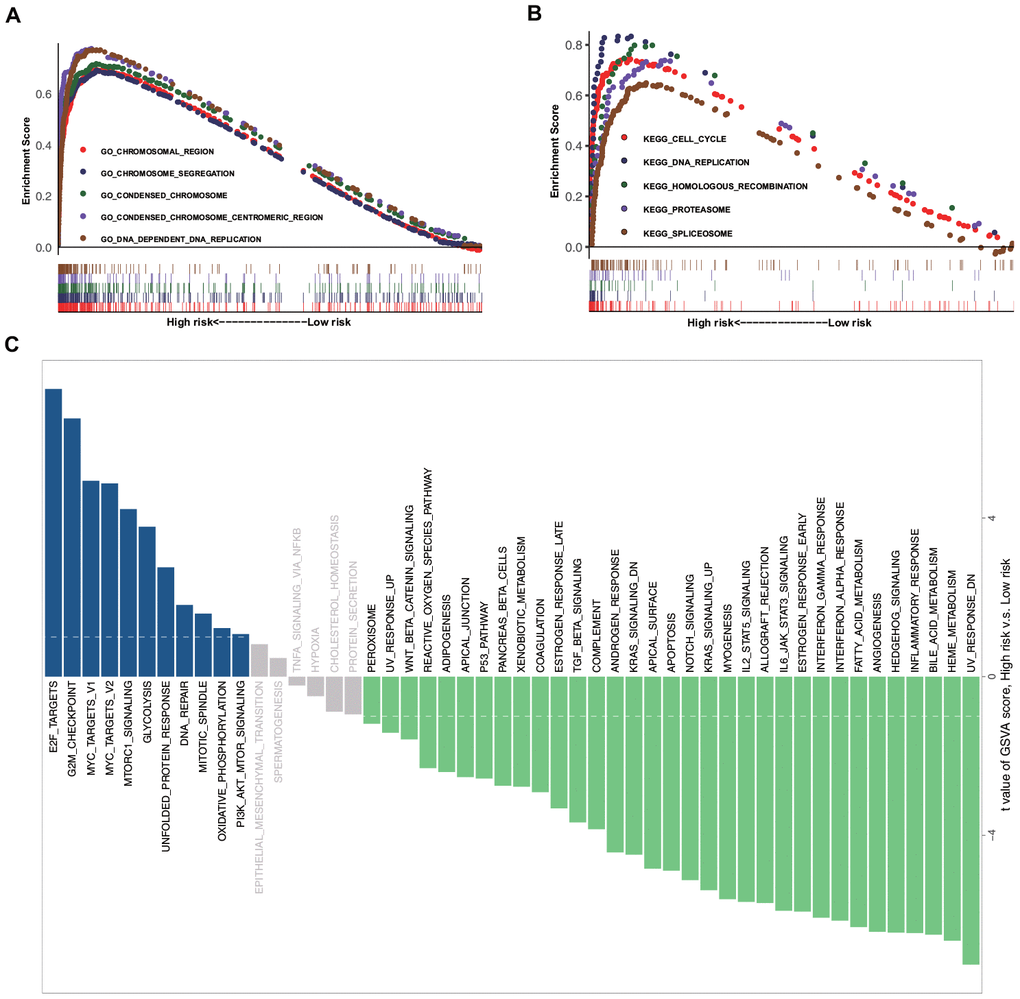
Figure 3. GSEA and GSVA data. (A) Top five representative GO annotation terms in the high-risk group. (B) Top five representative KEGG pathways in the high-risk group. (C) Comparison of the low- and high-risk groups using GSVA.
Prognostic value of the ERG signature in the training set
Based on the median risk score, the included 490 patients with LUAD from TCGA were equally divided into low-risk (n = 245) and high-risk (n = 245) groups. Figure 4A shows the coefficient of the formula and the risk scores [risk scores = (0.011794409 × ADM mRNA level) + (−0.142467012 × CCR2 mRNA level) + (0.024230703 × CDH2 mRNA level) + (0.001349971 × CTSL mRNA level) + (0.006464507 × FSCN1 mRNA level) + (0.113002543 × FUT4 mRNA level) + (−0.120528327 × HGF mRNA level) + (0.003726199 × ITGB1 mRNA level) + (0.012745463 × LGR4 mRNA level)]. Figure 4B–4D shows a heatmap of the expression profiles of the nine ERGs, the risk score distribution, and the vital statuses of the patients with LUAD from the high- and low-risk groups. Kaplan–Meier survival curves exhibited a significantly worse OS in the high-risk than in the low-risk group (P = 2.35e−8; Figure 4E). Next, receiver operating characteristic (ROC) curve analysis was carried out to assess the discrimination capacity of the nine-gene signature. The areas under the curves (AUCs) for 1-, 3-, and 5-year OS predictions were 0.763, 0.704, and 0.712, respectively (Figure 4F), which indicated a good performance of this nine-ERG signature for prognostic prediction. Univariate and multivariate Cox regression analyses suggested that the ERG signature could be regarded as an independent predictor of OS after adjustment for demographic and clinical features, including age, sex, tumor grade, and TNM stage (Figure 4G, 4H).
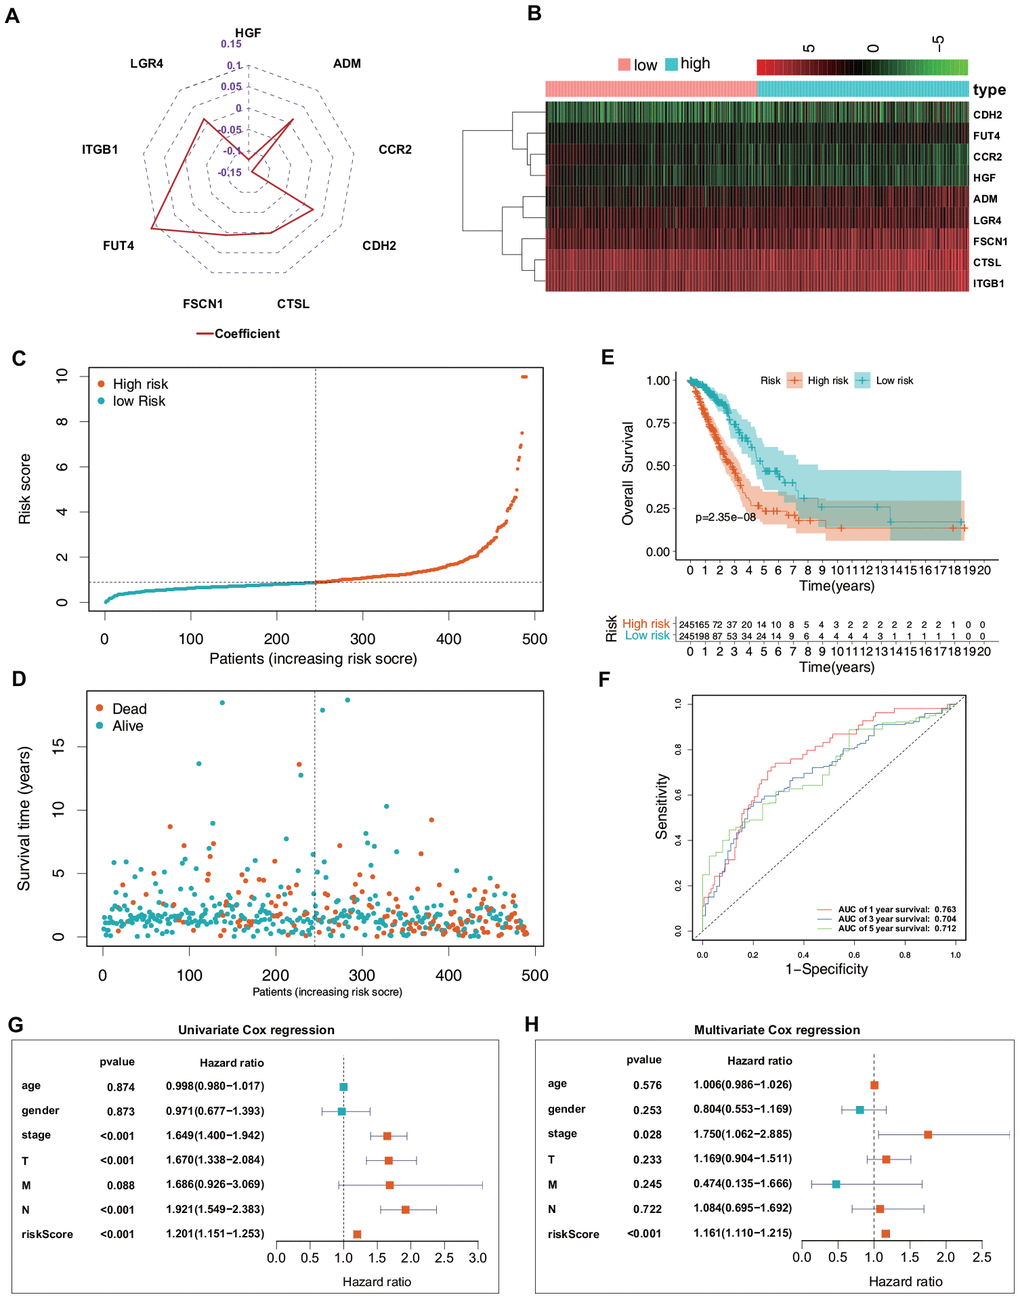
Figure 4. Predictive value of the ERG signature for LUAD in the training set (TCGA). (A) Value of each coefficient representing its relative contribution to the predictive signature. (B) Heatmap of the mRNA expression levels of the nine signature-comprising ERGs. (C) Rank of risk signature and score distribution. (D) Distribution of patients in the low- and high-risk groups based on their survival status (OS). (E) OS times of the patients between high- and low-risk groups. (F) Time-dependent ROC curve analysis for the prediction of 1-, 3-, and 5-year OS using the ERG signature. (G) Univariate Cox regression analysis of the ERG signature and clinical features of the patients. (H) Multivariate Cox regression analysis of the ERG signature and clinical features of the patients.
Validation of the ERG signature
To validate the reliability of the ERG signature, the risk score was calculated for each patient in the validation set (GSE31210) using the same formula that was used for the patients from TCGA. The samples were then separated into high- and low-risk groups based on the median value of the risk scores. In the validation set, the distribution of the risk scores, survival statuses of the patients, and a heatmap of expression profiles of the nine ERGs (Figure 5A–5D) showed similar trends to those in the training set. Further survival analysis indicated that the high-risk patients had a significantly worse OS and relapse-free survival (RFS) than did the low-risk patients (Figure 5E, 5F). Time-dependent ROC curves were generated to explore the prognostic values of the nine ERG-based risk scores. It was found that the ERG signature could accurately predict the prognosis of the patients (Figure 5G, 5H). Taken together, the ERG signature was capable of predicting the survival of patients with LUAD.
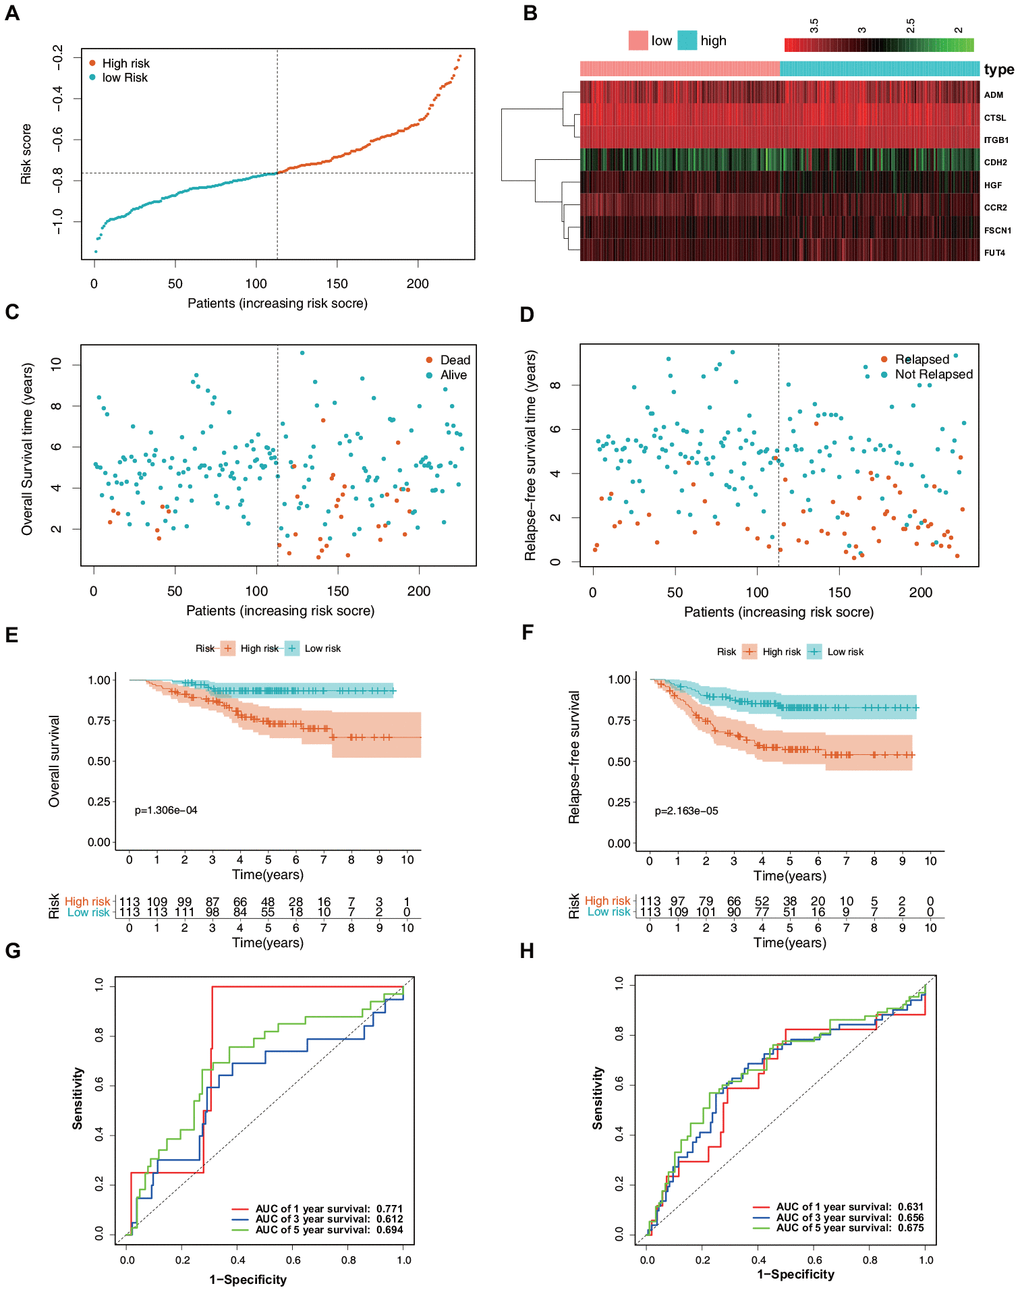
Figure 5. Verification of the predictive value of the ERG signature for LUAD in the validation set (GSE31210). (A) Risk signature rank and score distribution. (B) Heatmap of the mRNA expression levels of the nine genes included in the signature. (C) Distribution of patients in the high- and low-risk groups based on their survival status (OS). (D) Distribution of patients in the high- and low-risk groups based on their survival status (RFS). (E) OS of the patients in the low- and high-risk groups. (F) RFS of the patients in the low- and high-risk groups. (G) Time-dependent ROC curve analysis for the prediction of 1-, 3-, and 5-year OS using the ERG signature. (H) Time-dependent ROC curve analysis for the prediction of 1-, 3-, and 5-year RFS using the ERG signature.
Correlation between the ERG signature and clinical and demographic features of patients
Clinical and demographic features, including age, sex, pathological TNM stage, and pathological tumor stage, were analyzed in the training set, and the relationships between the screened genes and clinical indexes were explored. The results suggested a differential expression of CTSL, FSCN1, HGF, ITGB1, and FUT4 in patients with various clinical features (Figure 6A–6I).
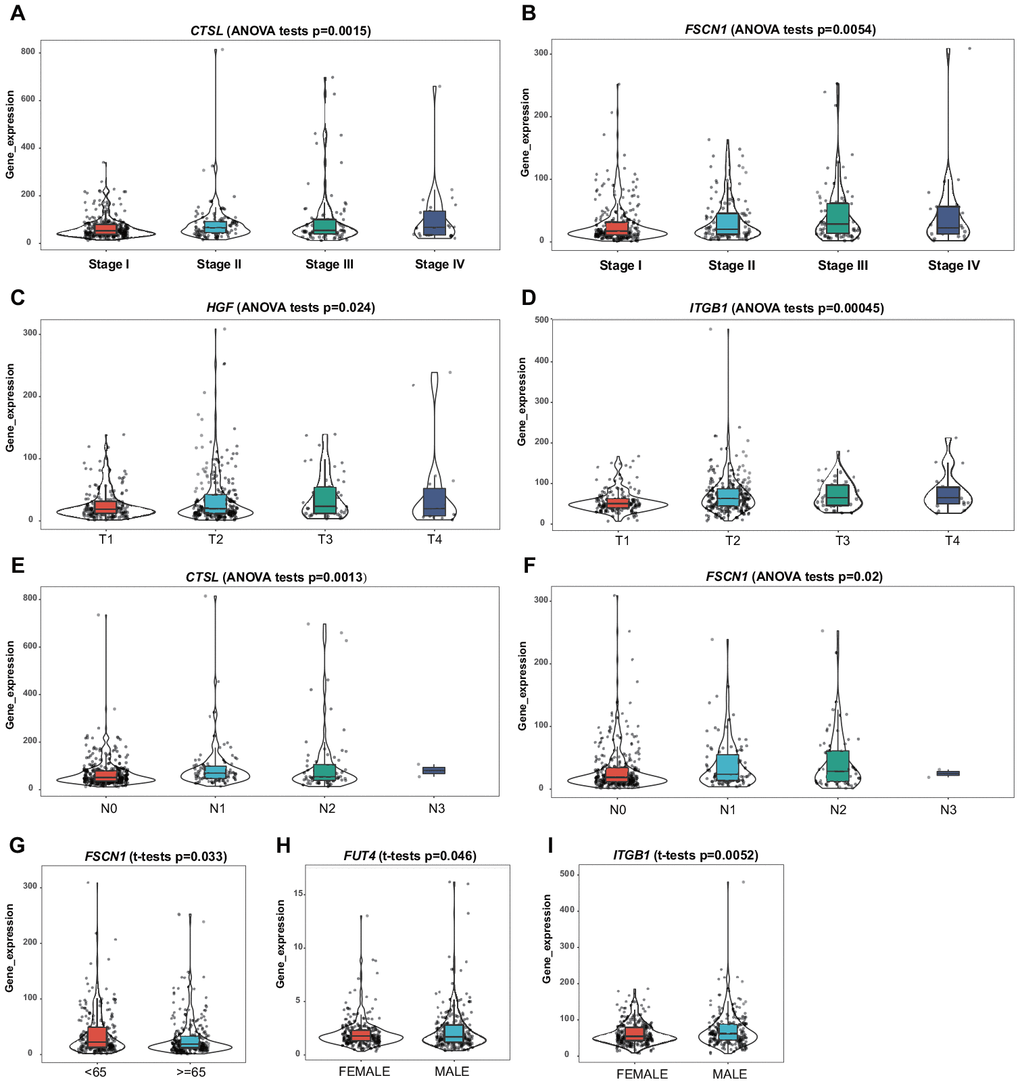
Figure 6. Correlation of the mRNA expression levels of the prognostic ERG signature with demographic and clinicopathological characteristics of patients with LUAD. (A) CTSL and TNM stage. (B) FSCN1 and TNM stage. (C) HGF and T stage. (D) ITGB1 and T stage. (E) CTSL and N stage. (F) FSCN1 and N stage. (G) FSCN1 and age. (H) FUT4 and sex. (I) ITGB1 and sex.
Subgroup analysis of the ERG signature
The prognostic value of the ERG signature was further explored in subgroups of patients with LUAD with various clinical and demographic features. Stratification analysis was carried out according to the clinical and demographic features, including age, sex, T stage, N stage, M stage, and pathological tumor stage (Figure 7A–7K). It was found that the ERG signature was useful in most of the subgroups (Tables 1, 2).
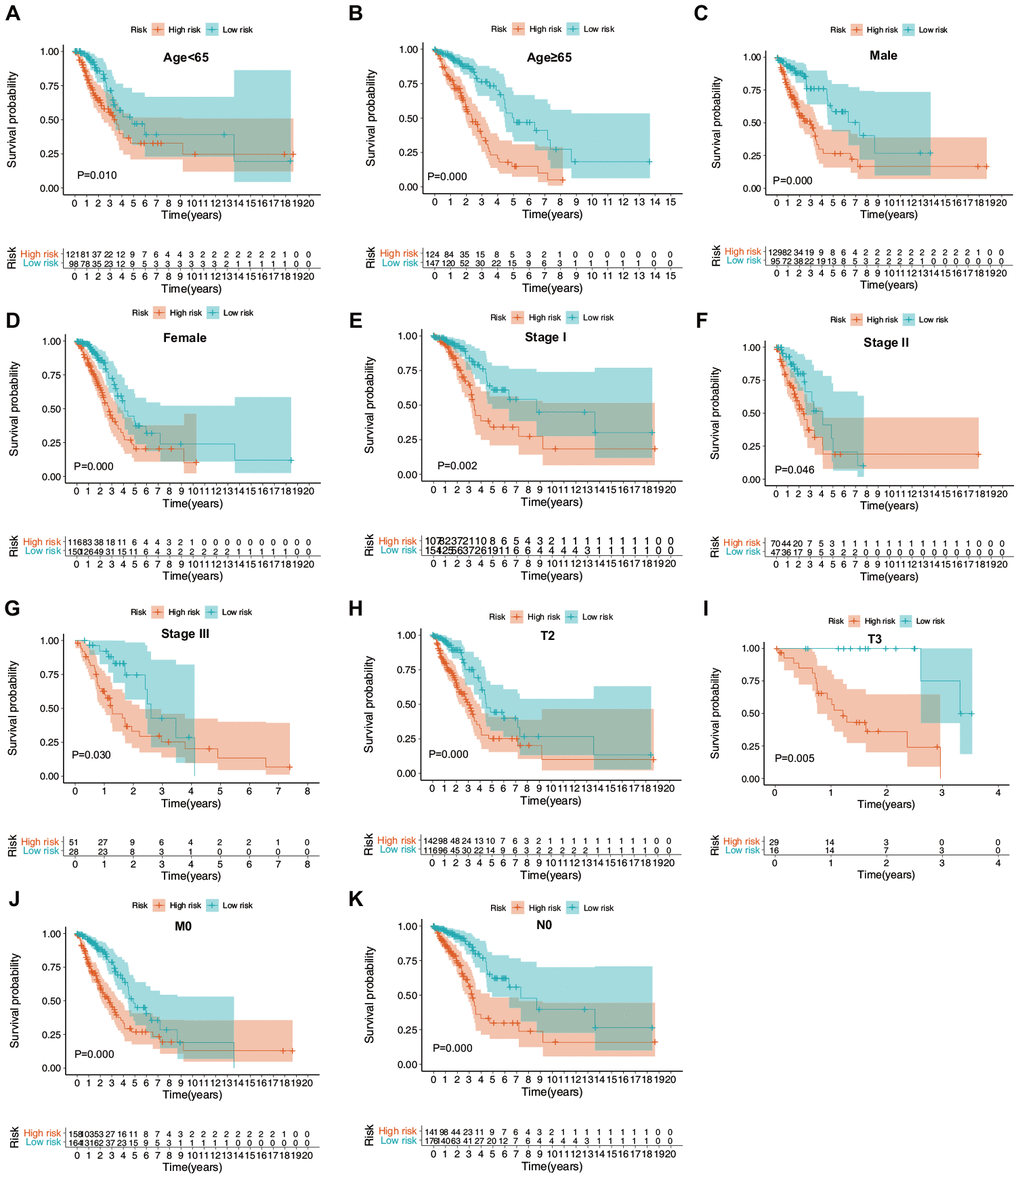
Figure 7. Confirmation of the ERG signature via stratification of patients from the training set based on specific demographic and clinical features. (A) Age < 65 years; (B) age ≥ 65 years; (C) male; (D) female; (E) stage I; (F) stage II; (G) stage III; (H) T2; (I) T3; (J) M0; and (K) N0.
Table 1. Association between the ERG signature and OS of patients with LUAD in the training set (TCGA, n = 490), stratified by demographic and clinical characteristics.
| Characteristics | Number (high-/low-risk group) | Proportion of patients | HR (95% CI) | P-value | |||||||||||||||||||||||||||||||||||||||||||||||||||||||||||||||||||||||||||||||||||||||||||||||
| Age (years) | |||||||||||||||||||||||||||||||||||||||||||||||||||||||||||||||||||||||||||||||||||||||||||||||||||
| ≥ 65 | 124/147 | 55.3% | 0.554 (0.445–0.688) | 0.000 | |||||||||||||||||||||||||||||||||||||||||||||||||||||||||||||||||||||||||||||||||||||||||||||||
| < 65 | 121/98 | 44.7% | 0.509 (0.306–0.849) | 0.010 | |||||||||||||||||||||||||||||||||||||||||||||||||||||||||||||||||||||||||||||||||||||||||||||||
| Sex | |||||||||||||||||||||||||||||||||||||||||||||||||||||||||||||||||||||||||||||||||||||||||||||||||||
| Female | 116/150 | 54.3% | 0.450 (0.290–0.698) | 0.000 | |||||||||||||||||||||||||||||||||||||||||||||||||||||||||||||||||||||||||||||||||||||||||||||||
| Male | 129/95 | 45.7% | 0.592 (0.457–0.765) | 0.000 | |||||||||||||||||||||||||||||||||||||||||||||||||||||||||||||||||||||||||||||||||||||||||||||||
| Stage | |||||||||||||||||||||||||||||||||||||||||||||||||||||||||||||||||||||||||||||||||||||||||||||||||||
| I | 107/154 | 53.3% | 0.654 (0.499–0.858) | 0.002 | |||||||||||||||||||||||||||||||||||||||||||||||||||||||||||||||||||||||||||||||||||||||||||||||
| II | 70/47 | 23.9% | 0.731 (0.537–0.995) | 0.046 | |||||||||||||||||||||||||||||||||||||||||||||||||||||||||||||||||||||||||||||||||||||||||||||||
| III | 51/28 | 16.1% | 0.673 (0.470–0.962) | 0.030 | |||||||||||||||||||||||||||||||||||||||||||||||||||||||||||||||||||||||||||||||||||||||||||||||
| IV | 16/9 | 5.1% | 0.611 (0.322–1.159) | 0.132 | |||||||||||||||||||||||||||||||||||||||||||||||||||||||||||||||||||||||||||||||||||||||||||||||
| NA | 1/7 | 1.6% | − | − | |||||||||||||||||||||||||||||||||||||||||||||||||||||||||||||||||||||||||||||||||||||||||||||||
| T stage | |||||||||||||||||||||||||||||||||||||||||||||||||||||||||||||||||||||||||||||||||||||||||||||||||||
| T1 | 63/103 | 21.6% | 0.744 (0.545–1.016) | 0.063 | |||||||||||||||||||||||||||||||||||||||||||||||||||||||||||||||||||||||||||||||||||||||||||||||
| T2 | 142/116 | 52.7% | 0.667 (0.534–0.833) | 0.000 | |||||||||||||||||||||||||||||||||||||||||||||||||||||||||||||||||||||||||||||||||||||||||||||||
| T3 | 29/16 | 9.2% | 0.233 (0.084–0.643) | 0.005 | |||||||||||||||||||||||||||||||||||||||||||||||||||||||||||||||||||||||||||||||||||||||||||||||
| T4 | 10/8 | 3.7% | 0.500 (0.224–1.114) | 0.090 | |||||||||||||||||||||||||||||||||||||||||||||||||||||||||||||||||||||||||||||||||||||||||||||||
| NA | ½ | 0.6% | − | − | |||||||||||||||||||||||||||||||||||||||||||||||||||||||||||||||||||||||||||||||||||||||||||||||
| M stage | |||||||||||||||||||||||||||||||||||||||||||||||||||||||||||||||||||||||||||||||||||||||||||||||||||
| M0 | 158/164 | 65.7% | 0.644 (0.527–0.787) | 0.000 | |||||||||||||||||||||||||||||||||||||||||||||||||||||||||||||||||||||||||||||||||||||||||||||||
| M1 | 16/8 | 4.9% | 0.518 (0.243–1.103) | 0.088 | |||||||||||||||||||||||||||||||||||||||||||||||||||||||||||||||||||||||||||||||||||||||||||||||
| NA | 71/73 | 29.4% | − | − | |||||||||||||||||||||||||||||||||||||||||||||||||||||||||||||||||||||||||||||||||||||||||||||||
| N stage | |||||||||||||||||||||||||||||||||||||||||||||||||||||||||||||||||||||||||||||||||||||||||||||||||||
| N0 | 141/176 | 64.7% | 0.589 (0.463–0.749) | 0.000 | |||||||||||||||||||||||||||||||||||||||||||||||||||||||||||||||||||||||||||||||||||||||||||||||
| N1 | 57/35 | 18.8% | 0.811 (0.600–1.096) | 0.173 | |||||||||||||||||||||||||||||||||||||||||||||||||||||||||||||||||||||||||||||||||||||||||||||||
| N2 | 45/23 | 13.9% | 0.777 (0.531–1.138) | 0.195 | |||||||||||||||||||||||||||||||||||||||||||||||||||||||||||||||||||||||||||||||||||||||||||||||
| N3 | 0/2 | 0.4% | − | − | |||||||||||||||||||||||||||||||||||||||||||||||||||||||||||||||||||||||||||||||||||||||||||||||
| NA | 2/9 | 2.2% | − | − | |||||||||||||||||||||||||||||||||||||||||||||||||||||||||||||||||||||||||||||||||||||||||||||||
| NA, not available; HR, hazard ratio; CI, confidence interval. | |||||||||||||||||||||||||||||||||||||||||||||||||||||||||||||||||||||||||||||||||||||||||||||||||||
Table 2. Association between the ERG signature and survival of patients with LUAD in the validation set (GSE31210, n=226), stratified by demographic and clinical characteristics.
| Characteristics | Number (high-/low-risk group) | Proportion of patients | OS | RFS | |||||||||||||||||||||||||||||||||||||||||||||||||||||||||||||||||||||||||||||||||||||||||||||||
| HR (95% CI) | P-value | HR (95% CI) | P-value | ||||||||||||||||||||||||||||||||||||||||||||||||||||||||||||||||||||||||||||||||||||||||||||||||
| Age (years) | |||||||||||||||||||||||||||||||||||||||||||||||||||||||||||||||||||||||||||||||||||||||||||||||||||
| ≥ 65 | 87/77 | 72.6% | 0.643 (0.371−1.112) | 0.114 | 0.666 (0.429−1.005) | 0.053 | |||||||||||||||||||||||||||||||||||||||||||||||||||||||||||||||||||||||||||||||||||||||||||||
| < 65 | 26/36 | 27.4% | 0.103 (0.024−0.442) | 0.002 | 0.504 (0.348−0.729) | 0.000 | |||||||||||||||||||||||||||||||||||||||||||||||||||||||||||||||||||||||||||||||||||||||||||||
| Sex | |||||||||||||||||||||||||||||||||||||||||||||||||||||||||||||||||||||||||||||||||||||||||||||||||||
| Female | 56/65 | 53.5% | 0.300 (0.096−0.937) | 0.038 | 0.348 (0.165−0.737) | 0.006 | |||||||||||||||||||||||||||||||||||||||||||||||||||||||||||||||||||||||||||||||||||||||||||||
| Male | 57/48 | 46.5% | 0.437 (0.236−0.810) | 0.009 | 0.559 (0.374−0.834) | 0.004 | |||||||||||||||||||||||||||||||||||||||||||||||||||||||||||||||||||||||||||||||||||||||||||||
| Smoking status | |||||||||||||||||||||||||||||||||||||||||||||||||||||||||||||||||||||||||||||||||||||||||||||||||||
| Ever smoker | 61/50 | 49.1% | 0.434 (0.235−0.802) | 0.008 | 0.506 (0.334−0.767) | 0.001 | |||||||||||||||||||||||||||||||||||||||||||||||||||||||||||||||||||||||||||||||||||||||||||||
| Never smoker | 52/63 | 50.9% | 0.556 (0.313−0.988) | 0.046 | 0.647 (0.446−0.940) | 0.022 | |||||||||||||||||||||||||||||||||||||||||||||||||||||||||||||||||||||||||||||||||||||||||||||
| Stage | |||||||||||||||||||||||||||||||||||||||||||||||||||||||||||||||||||||||||||||||||||||||||||||||||||
| I | 75/93 | 74.3% | 0.415 (0.222−0.775) | 0.006 | 0.518 (0.359−0.741) | 0.000 | |||||||||||||||||||||||||||||||||||||||||||||||||||||||||||||||||||||||||||||||||||||||||||||
| II | 38/20 | 25.7% | 0.663 (0.380−1.158) | 0.148 | 0.812 (0.537−1.228) | 0.323 | |||||||||||||||||||||||||||||||||||||||||||||||||||||||||||||||||||||||||||||||||||||||||||||
| Mutation | |||||||||||||||||||||||||||||||||||||||||||||||||||||||||||||||||||||||||||||||||||||||||||||||||||
| ALK fusion | 9/2 | 4.9% | 0.189 (0.000−377.477) | 0.668 | 0.187 (0.000−313.329) | 0.658 | |||||||||||||||||||||||||||||||||||||||||||||||||||||||||||||||||||||||||||||||||||||||||||||
| EGFR mutation | 37/31 | 30.1% | 0.496 (0.264−0.932) | 0.029 | 0.638 (0.420−0.968) | 0.035 | |||||||||||||||||||||||||||||||||||||||||||||||||||||||||||||||||||||||||||||||||||||||||||||
| KRAS mutation | 52/75 | 56.2% | 0.523 (0.292−0.934) | 0.029 | 0.558 (0.381−0.815) | 0.003 | |||||||||||||||||||||||||||||||||||||||||||||||||||||||||||||||||||||||||||||||||||||||||||||
| Wild-type EGFR/KRAS/ALK | 15/5 | 8.8% | 0.175 (0.001−41.803) | 0.532 | 0.172 (0.004−7.474) | 0.360 | |||||||||||||||||||||||||||||||||||||||||||||||||||||||||||||||||||||||||||||||||||||||||||||
| HR, hazard ratio; CI, confidence interval. | |||||||||||||||||||||||||||||||||||||||||||||||||||||||||||||||||||||||||||||||||||||||||||||||||||
Comparison of immune cell types between the low- and high-risk groups
Using the CIBERSORT algorithm, we assessed the proportions of 22 immune cell types between the high- and low-risk patients with LUAD. Figure 8A shows the results for the 490 patients with LUAD from the training set. Regarding specific differences, the high-risk group had significantly higher proportions of naïve B cells, resting natural killer (NK) cells, M0 macrophages, activated mast cells, and neutrophils but significantly lower proportions of plasma cells, resting memory CD4 T cells, monocytes, resting dendritic cells, and resting mast cells than those in the low-risk group (Figure 8B).
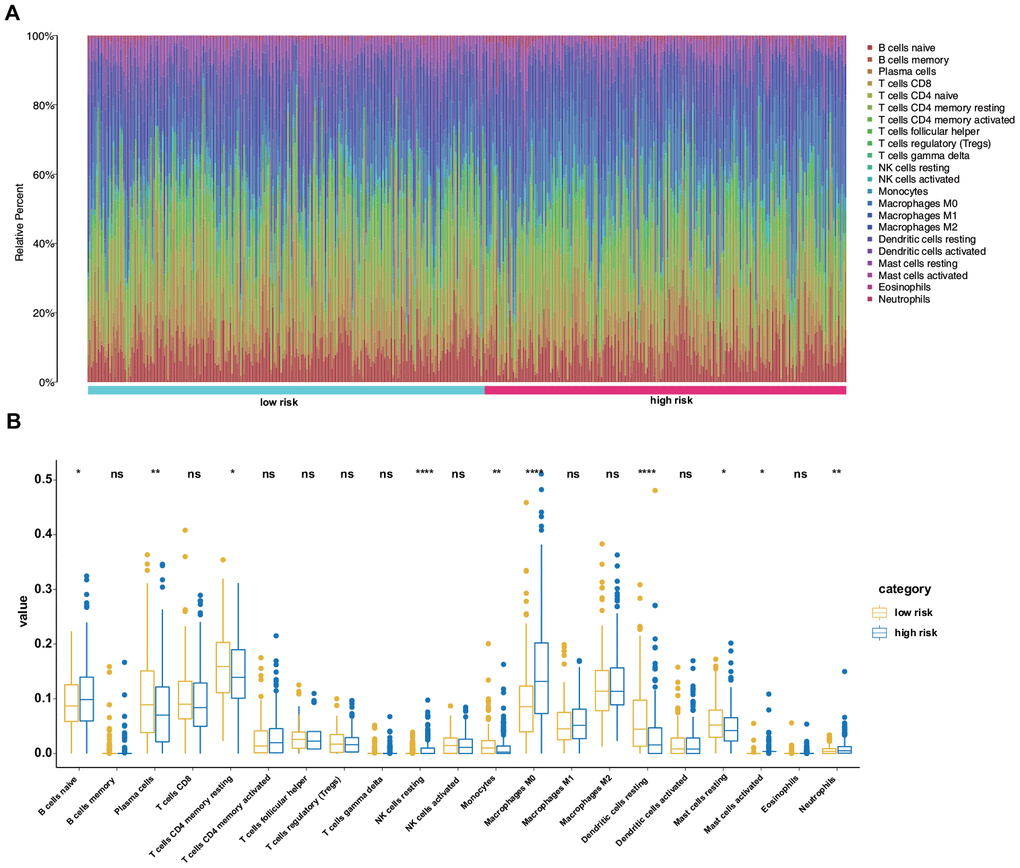
Figure 8. Differences in the immune landscape between low- and high-risk patients with LUAD. (A) Relative proportions of immune cell infiltration in the high- and low-risk patients. (B) Vioplot visualization of significantly different proportions of immune cells between low- and high-risk patients.
Construction and validation of a nomogram
As this novel ERG signature showed good predictive value for the LUAD prognosis, a more convenient and sensitive nomogram model, which included the ERG signature and pathological stage, age, and sex was developed based on the training set (Figure 9A). The AUC values for the 1-, 3-, and 5-year OS predictions using the nomogram were 0.774, 0.757, and 0.762, respectively (Figure 9B). In the validation set, the AUC values for 1-, 3-, and 5-year OS using the nomogram were 0.917, 0.752, and 0.745, respectively (Figure 9C), and those for 1-, 3-, and 5-year RFS were 0.914, 0.783, and 0.733, respectively (Figure 9D). To further test the nomogram, we performed survival analysis and ROC analysis by using another independent dataset, GSE41271 (test set). In the test group, survival analysis indicated that the high-risk patients had a significantly worse OS than the low-risk patients (Figure 9E). The AUC values for 1-, 3-, and 5-year OS using the nomogram were 0.709, 0.702, and 0.728, respectively (Figure 9F).
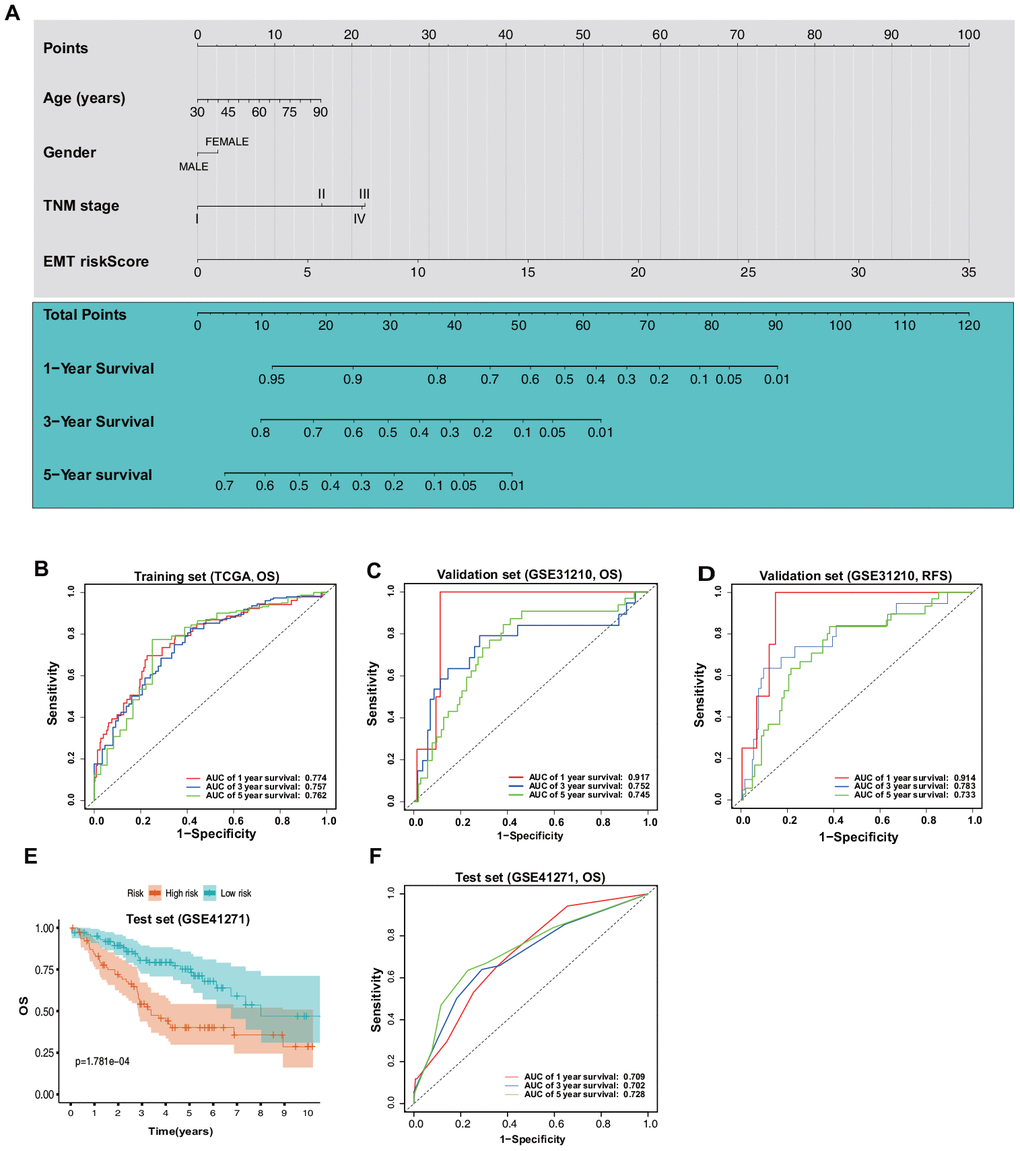
Figure 9. Construction and validation of a nomogram based on the ERG signature. (A) Nomogram based on the ERG signature and clinical information of patients with LUAD. (B) ROC curves of the nomogram for the prediction of OS in the training set. (C) ROC curves of the nomogram for the prediction of OS in the validation set (GSE31210). (D) ROC curves of the nomogram for the prediction of RFS in the validation set. (E) OS of the patients in the low- and high-risk scores based on the nomogram in the test set (GSE41271). (F) ROC curves of the nomogram for the prediction of OS in the test set.
Calibration plots based on the training set showed that the nomogram could accurately predict 1-, 3-, and 5-year OS (Figure 10A). In addition, decision curve analysis (DCA) was performed for the nomogram and TNM stage and indicated marked clinical usefulness of this model (Figure 10B).
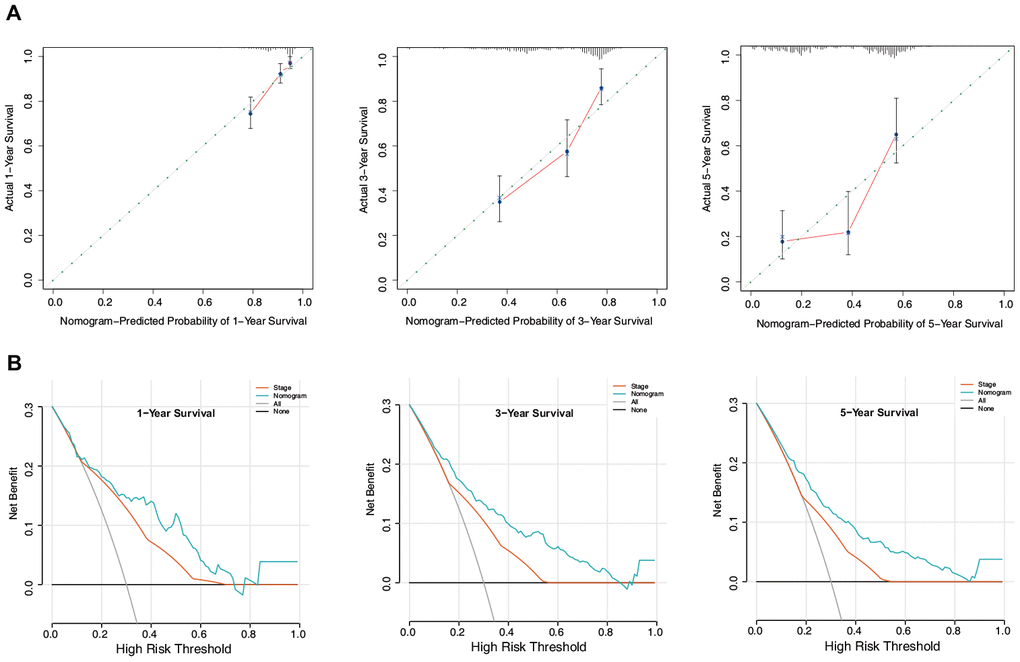
Figure 10. Evaluation of the nomogram in the training set. (A) Calibration plot of the nomogram for the prediction of OS. (B) DCA of the nomogram for the prediction of OS.
Discussion
LUAD, which is typically characterized by high recurrence and fatality and low recovery rates, is one of the deadliest malignant cancers in humans [16]. Many methods and tools have been developed to predict the survival of patients with LUAD, such as the American Joint Committee on Cancer staging system. However, TNM staging does not consider individual differences in the expression of tumor-related genes, including ERGs [17]. EMT, a process whereby epithelial cells gradually acquire a mesenchymal identity, is widely recognized to be involved in LUAD metastasis [18]. Most of the previous studies have focused on the functions and mechanisms of some ERGs [19–21]. However, ERG-based prognostic models have not been previously explored in LUAD. Herein, we systematically explored the data for patients with LUAD available in TCGA and GEO databases and established a novel ERG-based prognostic model.
In the present study, a total of 54 overlapping survival-related ERGs were identified in TCGA and GEO datasets using univariate Cox regression analysis and were then subjected to LASSO regression analysis with tenfold cross-validation. Finally, we utilized multivariate Cox analysis to select a novel, nine-ERG signature, including ADM, CDH2, CTSL, FSCN1, FUT4, ITGB1, LGR4, CCR2, and HGF. The patients with LUAD were categorized into high- and low-risk groups using the median risk score. The Kaplan–Meier analysis suggested that the high-risk group had a remarkably worse prognosis than that of the low-risk group. Furthermore, the estimation accuracy of the ERG signature was verified using the GSE31210 dataset, and the data indicated good reproducibility. Multivariate analyses confirmed the risk score as an independent prognostic index for LUAD.
Previous studies have shown that the process of EMT is accompanied by the release of soluble factors, which create an inflammatory milieu promoting the recruitment of immune cells to the site of tumorigenesis [22]. It is generally agreed that immune cell infiltration into the tumor microenvironment promotes tumor growth [23]. However, the modulation of immune cells by ERGs is relatively underexplored in LUAD. In this study, we assessed the immune microenvironment in the high- and low-risk groups and found that the former had distinctly higher proportions of naïve B cells, resting NK cells, M0 macrophages, activated mast cells, and neutrophils but significantly lower proportions of plasma cells, resting memory CD4 T cells, monocytes, resting dendritic cells, and resting mast cells than those in the low-risk group. Therefore, targeting ERGs may alter the tumor microenvironment and immune responses. However, as the critical roles of these immune cells are complex, further in-depth research is required.
A nomogram is an easy-to-use tool for predicting prognosis and disease incidence [24, 25]. Nomograms are currently widely used for predicting the survival of patients with malignant tumors [26, 27]. In the present study, a nomogram was established that integrated the ERG signature with the sex, age, and TNM staging and accurately predicted OS. Subsequently, ROC curve analysis, calibration plots, and DCA analysis demonstrated satisfactory predictive performance of the integrated nomogram. We also performed GSEA and GSVA to identify the most critical biological processes and signaling cascades in the high- and low-risk groups, based on our ERG signature. These analyses revealed that the chromosomal region, cell cycle, and E2F targets might play essential roles in the distinct EMT-associated risk.
In this study, nine ERGs were selected and included in the prognostic signature. ADM, a multifunctional peptide, is highly expressed in several tumors, including those of the brain, breast, colon, prostate, and lung, and plays important roles in tumor angiogenesis, cell growth, and survival [28, 29]. A previous study has investigated the prognostic role of ADM in lung cancer; however, it was found that ADM expression was not correlated with the survival of patients with lung cancer [30]. Our results were not consistent with the previous observation, likely because the previous study included squamous cell carcinoma and small-cell carcinoma. CDH2, which encodes the N-cadherin protein, is also a marker of EMT. CDH2 is involved in the EMT process and promotes the growth and migration of cancer cells in LUAD [31]. It has been reported that CDH2 has a prognostic significance for LUAD [32], which is consistent with our data. CTSL is a key effector that induces EMT in various tumors, taking part in the regulation of invasion and metastasis of cancer cells and also modulating transcription of ERGs [33, 34]. However, the critical role of CTSL in LUAD is unclear and needs to be studied in the future. FSCN1, an actin-bundling protein, is highly upregulated in aggressive tumors [35]. Consistent with our results, FSCN1 expression was shown to be associated with worse survival of patients with NSCLC [36]. FUT4, which encodes a key glycosyltransferase, is abnormally upregulated in different types of tumors [37] and has been related to the progression and poor prognosis of LUAD [38]. ITGB1, a member of the integrin family, is aberrantly overexpressed or downregulated in different solid cancers [39]. It was found that low ITGB1 levels were significantly linked to a better prognosis of NSCLC [39]. LGR4, also known as GPR48, is involved in tumorigenesis via regulating Wnt/β-catenin signaling [40]. However, few studies have focused on the prognostic value of LGR4. Further studies are needed to elucidate the critical roles of the nine ERGs identified in this study in LUAD, which may provide insights for targeted treatment of this disease.
There are some limitations to this study. First, considering the great heterogeneity of LUAD, some important clinical variables were not available from the public datasets at the time of the prognostic model construction. Thus, future studies should include more clinical variables. Second, the potential mechanisms underlying the prognostic capacity of the ERGs in LUAD remain to be explored. Third, the model has exclusively been based on the bioinformatics analysis and has not been tested in the clinic.
In conclusion, this is the first study to identify nine relevant genes and validate a novel ERG signature for the prediction of the prognosis of patients with LUAD. By integrating the ERG signature with the age, sex, and TNM staging, we constructed a predictive nomogram that could effectively estimate the outcomes of patients with LUAD via appropriate risk-score stratification. These findings could produce an effective formula for the risk score to monitor EMT and predict the prognosis of patients with LUAD.
Materials and Methods
Data acquisition
We extracted 1,184 ERGs from the EMT gene database (dbEMT 2.0; http://dbemt.bioinfo-minzhao.org/download.cgi) [41] and downloaded the mRNA sequencing data, as well as clinical information, for patients with LUAD from two public databases, TCGA and GEO. After excluding samples with incomplete survival data (or follow-up times of less than 1 day), records of 490 patients with LUAD were obtained from TCGA (https://portal.gdc.cancer.gov) as a training set. Similarly, records of 226 patients with LUAD were obtained from GSE31210 (https://www.ncbi.nlm.nih.gov/geo/) as a validation set. Moreover, 179 patients with LUAD were obtained from GSE41271 as a test set. Moreover, protein expression of ERGs in LUAD and normal lung tissues was evaluated using the HPA database (https://www.proteinatlas.org/). Mutation data were obtained from the cBioPortal for Cancer Genomics (https://www.cbioportal.org/).
Construction and validation of the ERG signature
We first identified 54 overlapping survival-related ERGs in TCGA and GSE31210 datasets, with a P-value of < 0.05 using univariate Cox analysis, followed by LASSO regression analysis to screen these genes. Finally, multivariate Cox regression analysis was conducted based on the ERGs selected by LASSO regression to construct a multigene signature for predicting the survival of patients with LUAD using a linear combination of regression coefficients (βi) derived from the LASSO Cox regression model. The risk score was calculated for each patient based on βi combined with the corresponding expression data (Expi) of the identified ERGs as follows:
Subsequently, the patients with LUAD were classified into low- and high-risk groups in either cohort based on the median risk score.
Functional enrichment analysis
The GSEA software (v4.0.3; http://software.broadinstitute.org/gsea/index.jsp) was used to assess the related pathways and the molecular mechanisms by comparing the high- and low-risk groups from the training set using the KEGG gene set (c2.cp.kegg.v7.1.symbols) and GO gene set (c5.all.v7.1.symbols). For each analysis, 1,000 gene-set permutations were performed. The top five terms in each analysis were employed in multiple GSEA gene sets to demonstrate the range of biological functions and signaling pathways involved in the ERG signature in LUAD. Additionally, GSVA was performed using the GSVA package to further identify activated pathways that were determined based on the gene sets.
Estimation of immune cell-type fractions
CIBERSORT (https://cibersort.stanford.edu/), a leukocyte gene signature matrix consisting of 547 genes, was used to estimate the putative proportions of 24 types of immune cells between the ERG signature-based low- and high-risk groups.
Construction and validation of the nomogram
A nomogram was constructed using the “rms,” “Hmisc,” “lattice,” “Formula,” and “foreign” R packages, and the corresponding calibration map was built to evaluate the prognostic performance of the nomogram. To validate the constructed novel nomogram, we performed DCA to quantify its clinical applicability by analyzing the clinical outcomes of the nomogram-based decisions.
Statistical analysis
The mRNA expression profiles are shown as raw data, and each mRNA expression level was log2-normalized for further analysis. Kaplan–Meier analysis with a log-rank test was performed for comparison between the low- and high-risk groups. ROC survival analysis was conducted to evaluate the predictive accuracy of the nomogram in patients with LUAD in terms of the ERG signature. The R software (version 3.6.2; https://www.r-project.org) was used to conduct all statistical analyses. A P-value of < 0.05 was considered to indicate statistical significance.
Author Contributions
YT collected and analyzed the data. ZZ designed the study. JW and CQ performed statistical analysis of the data. YT and YJ prepared the manuscript, and ZZ secured funding for the project. All authors have read and approved the final manuscript.
Conflicts of Interest
The authors declare that they have no conflicts of interest.
Funding
This work was supported by the National Natural Science Foundation of China (Nos. 81760351 and 82060361).
References
- 1. Siegel RL, Miller KD, Jemal A. Cancer statistics, 2020. CA Cancer J Clin. 2020; 70:7–30. https://doi.org/10.3322/caac.21590 [PubMed]
- 2. Reck M, Rabe KF. Precision diagnosis and treatment for advanced non-small-cell lung cancer. N Engl J Med. 2017; 377:849–61. https://doi.org/10.1056/NEJMra1703413 [PubMed]
- 3. Shi J, Hua X, Zhu B, Ravichandran S, Wang M, Nguyen C, Brodie SA, Palleschi A, Alloisio M, Pariscenti G, Jones K, Zhou W, Bouk AJ, et al. Somatic genomics and clinical features of lung adenocarcinoma: a retrospective study. PLoS Med. 2016; 13:e1002162. https://doi.org/10.1371/journal.pmed.1002162 [PubMed]
- 4. Devarakonda S, Morgensztern D, Govindan R. Genomic alterations in lung adenocarcinoma. Lancet Oncol. 2015; 16:e342–51. https://doi.org/10.1016/S1470-2045(15)00077-7 [PubMed]
- 5. Mulshine JL, D'Amico TA. Issues with implementing a high-quality lung cancer screening program. CA Cancer J Clin. 2014; 64:352–63. https://doi.org/10.3322/caac.21239 [PubMed]
- 6. Wang J, Hu ZG, Li D, Xu JX, Zeng ZG. Gene expression and prognosis of insulin-like growth factor-binding protein family members in non-small cell lung cancer. Oncol Rep. 2019; 42:1981–95. https://doi.org/10.3892/or.2019.7314 [PubMed]
- 7. Zeng Z, Yang Y, Qing C, Hu Z, Huang Y, Zhou C, Li D, Jiang Y. Distinct expression and prognostic value of members of SMAD family in non-small cell lung cancer. Medicine (Baltimore). 2020; 99:e19451. https://doi.org/10.1097/MD.0000000000019451 [PubMed]
- 8. Williams ED, Gao D, Redfern A, Thompson EW. Controversies around epithelial-mesenchymal plasticity in cancer metastasis. Nat Rev Cancer. 2019; 19:716–32. https://doi.org/10.1038/s41568-019-0213-x [PubMed]
- 9. Iwatsuki M, Mimori K, Yokobori T, Ishi H, Beppu T, Nakamori S, Baba H, Mori M. Epithelial-mesenchymal transition in cancer development and its clinical significance. Cancer Sci. 2010; 101:293–99. https://doi.org/10.1111/j.1349-7006.2009.01419.x [PubMed]
- 10. Thompson EW, Newgreen DF, Tarin D. Carcinoma invasion and metastasis: a role for epithelial-mesenchymal transition? Cancer Res. 2005; 65:5991–95. https://doi.org/10.1158/0008-5472.CAN-05-0616 [PubMed]
- 11. Rho JK, Choi YJ, Lee JK, Ryoo BY, Na II, Yang SH, Kim CH, Lee JC. Epithelial to mesenchymal transition derived from repeated exposure to gefitinib determines the sensitivity to EGFR inhibitors in A549, a non-small cell lung cancer cell line. Lung Cancer. 2009; 63:219–26. https://doi.org/10.1016/j.lungcan.2008.05.017 [PubMed]
- 12. Miao Y, Li AL, Wang L, Fan CF, Zhang XP, Xu HT, Yang LH, Liu Y, Wang EH. Overexpression of NEDD9 is associated with altered expression of E-Cadherin, β-Catenin and N-Cadherin and predictive of poor prognosis in non-small cell lung cancer. Pathol Oncol Res. 2013; 19:281–86. https://doi.org/10.1007/s12253-012-9580-2 [PubMed]
- 13. Soltermann A, Tischler V, Arbogast S, Braun J, Probst-Hensch N, Weder W, Moch H, Kristiansen G. Prognostic significance of epithelial-mesenchymal and mesenchymal-epithelial transition protein expression in non-small cell lung cancer. Clin Cancer Res. 2008; 14:7430–37. https://doi.org/10.1158/1078-0432.CCR-08-0935 [PubMed]
- 14. Oka S, Uramoto H, Chikaishi Y, Tanaka F. The expression of CD146 predicts a poor overall survival in patients with adenocarcinoma of the lung. Anticancer Res. 2012; 32:861–64. [PubMed]
- 15. Tischler V, Pfeifer M, Hausladen S, Schirmer U, Bonde AK, Kristiansen G, Sos ML, Weder W, Moch H, Altevogt P, Soltermann A. L1CAM protein expression is associated with poor prognosis in non-small cell lung cancer. Mol Cancer. 2011; 10:127. https://doi.org/10.1186/1476-4598-10-127 [PubMed]
- 16. Uprety D, Mandrekar SJ, Wigle D, Roden AC, Adjei AA. Neoadjuvant immunotherapy for NSCLC: current concepts and future approaches. J Thorac Oncol. 2020; 15:1281–97. https://doi.org/10.1016/j.jtho.2020.05.020 [PubMed]
- 17. Ho CC, Lin CK, Yang CY, Chang LY, Lin SY, Yu CJ. Current advances of endobronchial ultrasonography in the diagnosis and staging of lung cancer. J Thorac Dis. 2016 (Suppl 9); 8:S690–96. https://doi.org/10.21037/jtd.2016.08.21 [PubMed]
- 18. Sung WJ, Kim H, Park KK. The biological role of epithelial-mesenchymal transition in lung cancer (Review). Oncol Rep. 2016; 36:1199–206. https://doi.org/10.3892/or.2016.4964 [PubMed]
- 19. Huo SF, Shang WL, Yu M, Ren XP, Wen HX, Chai CY, Sun L, Hui K, Liu LH, Wei SH, Wang XX, Wang Y, Tian YX. STEAP1 facilitates metastasis and epithelial-mesenchymal transition of lung adenocarcinoma via the JAK2/STAT3 signaling pathway. Biosci Rep. 2020; 40:BSR20193169. https://doi.org/10.1042/BSR20193169 [PubMed]
- 20. Xue F, Jia Y, Zhao J. Overexpression of FYN suppresses the epithelial-to-mesenchymal transition through down-regulating PI3K/AKT pathway in lung adenocarcinoma. Surg Oncol. 2020; 33:108–17. https://doi.org/10.1016/j.suronc.2020.02.002 [PubMed]
- 21. Yang B, Zhang W, Zhang M, Wang X, Peng S, Zhang R. KRT6A promotes EMT and cancer stem cell transformation in lung adenocarcinoma. Technol Cancer Res Treat. 2020; 19:1533033820921248. https://doi.org/10.1177/1533033820921248 [PubMed]
- 22. Singh S, Chakrabarti R. Consequences of EMT-driven changes in the immune microenvironment of breast cancer and therapeutic response of cancer cells. J Clin Med. 2019; 8:642. https://doi.org/10.3390/jcm8050642 [PubMed]
- 23. Sarode P, Schaefer MB, Grimminger F, Seeger W, Savai R. Macrophage and tumor cell cross-talk is fundamental for lung tumor progression: we need to talk. Front Oncol. 2020; 10:324. https://doi.org/10.3389/fonc.2020.00324 [PubMed]
- 24. Iasonos A, Schrag D, Raj GV, Panageas KS. How to build and interpret a nomogram for cancer prognosis. J Clin Oncol. 2008; 26:1364–70. https://doi.org/10.1200/JCO.2007.12.9791 [PubMed]
- 25. Balachandran VP, Gonen M, Smith JJ, DeMatteo RP. Nomograms in oncology: more than meets the eye. Lancet Oncol. 2015; 16:e173–80. https://doi.org/10.1016/S1470-2045(14)71116-7 [PubMed]
- 26. Kawai K, Ishihara S, Yamaguchi H, Sunami E, Kitayama J, Miyata H, Watanabe T. Nomogram prediction of metachronous colorectal neoplasms in patients with colorectal cancer. Ann Surg. 2015; 261:926–32. https://doi.org/10.1097/SLA.0000000000000881 [PubMed]
- 27. Huang YQ, Liang CH, He L, Tian J, Liang CS, Chen X, Ma ZL, Liu ZY. Development and validation of a radiomics nomogram for preoperative prediction of lymph node metastasis in colorectal cancer. J Clin Oncol. 2016; 34:2157–64. https://doi.org/10.1200/JCO.2015.65.9128 [PubMed]
- 28. Greillier L, Tounsi A, Berenguer-Daizé C, Dussault N, Delfino C, Benyahia Z, Cayol M, Mabrouk K, Garcia S, Martin PM, Barlesi F, Ouafik L. Functional analysis of the adrenomedullin pathway in Malignant pleural mesothelioma. J Thorac Oncol. 2016; 11:94–107. https://doi.org/10.1016/j.jtho.2015.09.004 [PubMed]
- 29. Miller MJ, Martínez A, Unsworth EJ, Thiele CJ, Moody TW, Elsasser T, Cuttitta F. Adrenomedullin expression in human tumor cell lines. Its potential role as an autocrine growth factor. J Biol Chem. 1996; 271:23345–51. https://doi.org/10.1074/jbc.271.38.23345 [PubMed]
- 30. Buyukberber S, Sari I, Camci C, Buyukberber NM, Sevinc A, Turk HM. Adrenomedullin expression does not correlate with survival in lung cancer. Med Oncol. 2007; 24:245–49. https://doi.org/10.1007/BF02698047 [PubMed]
- 31. Zakaria N, Yahaya BH. Adipose-derived mesenchymal stem cells promote growth and migration of lung adenocarcinoma cancer cells. Adv Exp Med Biol. 2020; 1292:83–95. https://doi.org/10.1007/5584_2019_464 [PubMed]
- 32. Zhuo H, Zhao Y, Cheng X, Xu M, Wang L, Lin L, Lyu Z, Hong X, Cai J. Tumor endothelial cell-derived cadherin-2 promotes angiogenesis and has prognostic significance for lung adenocarcinoma. Mol Cancer. 2019; 18:34. https://doi.org/10.1186/s12943-019-0987-1 [PubMed]
- 33. Xiong Y, Ji W, Fei Y, Zhao Y, Wang L, Wang W, Han M, Tan C, Fei X, Huang Q, Liang Z. Cathepsin L is involved in X-ray-induced invasion and migration of human glioma U251 cells. Cell Signal. 2017; 29:181–191. https://doi.org/10.1016/j.cellsig.2016.10.012 [PubMed]
- 34. Lankelma JM, Voorend DM, Barwari T, Koetsveld J, Van der Spek AH, De Porto AP, Van Rooijen G, Van Noorden CJ. Cathepsin L, target in cancer treatment? Life Sci. 2010; 86:225–33. https://doi.org/10.1016/j.lfs.2009.11.016 [PubMed]
- 35. Boer EF, Howell ED, Schilling TF, Jette CA, Stewart RA. Fascin1-dependent filopodia are required for directional migration of a subset of neural crest cells. PLoS Genet. 2015; 11:e1004946. https://doi.org/10.1371/journal.pgen.1004946 [PubMed]
- 36. Zhang Y, Liang B, Dong H. Expression of fascin_1 protein in cancer tissues of patients with nonsmall cell lung cancer and its relevance to patients’ clinicopathologic features and prognosis. J Cancer Res Ther. 2018; 14:856–59. https://doi.org/10.4103/jcrt.JCRT_732_17 [PubMed]
- 37. Lai Y, Yang Y. SMYD2 facilitates cancer cell Malignancy and xenograft tumor development through ERBB2-mediated FUT4 expression in colon cancer. Mol Cell Biochem. 2020. [Epub ahead of print]. https://doi.org/10.1007/s11010-020-03738-2 [PubMed]
- 38. Liu C, Li Z, Wang S, Fan Y, Zhang S, Yang X, Hou K, Tong J, Hu X, Shi X, Wang X, Liu Y, Che X, Qu X. FUT4 is involved in PD-1-related immunosuppression and leads to worse survival in patients with operable lung adenocarcinoma. J Cancer Res Clin Oncol. 2019; 145:65–76. https://doi.org/10.1007/s00432-018-2761-y [PubMed]
- 39. Sun Q, Zhou C, Ma R, Guo Q, Huang H, Hao J, Liu H, Shi R, Liu B. Prognostic value of increased integrin-beta 1 expression in solid cancers: a meta-analysis. Onco Targets Ther. 2018; 11:1787–99. https://doi.org/10.2147/OTT.S155279 [PubMed]
- 40. Li Z, Zhang W, Mulholland MW. LGR4 and its role in intestinal protection and energy metabolism. Front Endocrinol (Lausanne). 2015; 6:131. https://doi.org/10.3389/fendo.2015.00131 [PubMed]
- 41. Zhao M, Kong L, Liu Y, Qu H. dbEMT: an epithelial-mesenchymal transition associated gene resource. Sci Rep. 2015; 5:11459. https://doi.org/10.1038/srep11459 [PubMed]