


Introduction
Renal cell carcinoma (RCC), one of the most common malignant urological tumors, accounts for approximately 2-3% of adult malignancies and can be divided into several pathological subtypes, such as clear cell renal cell carcinoma (ccRCC), chromophobe RCC and papillary RCC, among which the clear cell type accounts for approximately 80% of all RCCs [1, 2]. At present, partial nephrectomy is the best method for the treatment of localized ccRCC, but the incidence and mortality rates of metastatic and advanced ccRCC are still high because of their insensitivity to traditional chemoradiotherapy. Although new targeted therapies represent the current general trend for the treatment of advanced ccRCC, variable drug response rates and obvious side effects reflect the wide variability in the efficacy and survival benefits of these drugs [1]. Thus, investigating the underlying mechanisms of ccRCC progression and finding new biomarkers for early diagnosis and effective therapeutic targets are urgently needed.
RNA binding proteins (RBPs) are proteins that modulate gene expression by forming extensive protein-RNA interactions at the posttranscriptional level [3, 4]. They bind RNA transcripts in the 3′-untranslated region (3′-UTR) and exert essential roles in numerous biological processes, including RNA degradation, localization, turnover, storage, splicing, transport to the cytoplasm, and protein translation [5–7]. In total, 1542 RBPs were identified by genome-wide sequencing and bioinformatics analysis, which represent approximately seven percent of all protein-coding genes [3]. These RBPs were demonstrated to modulate molecular functions and biological processes such as RNA turnover, splicing, localization, and protein translation [8]. Furthermore, dysregulation of RBPs has been found in various human cancers, suggesting that RBPs may be reliable early molecular markers and therapeutic targets [9]. Thus, it is essential to investigate the regulatory mechanisms of RBPs in the initiation and progression of various cancers.
To date, numerous reports have indicated that RBPs are dysregulated in ccRCC tumorigenesis and are involved in RNA modification and turnover [10, 11]. For example, the RBP NONO binds to SKP2 and E2F8 mRNA to promote the proliferation of breast cancer at the posttranscriptional level [12]. Quaking (QKI) suppresses tumor proliferation and metastasis by downregulating the activity of Yes-associated protein in renal cancer [13]. SART3 binds to miR-34a to affect the cell cycle progression of lung cancer cells by downregulating miR-34a target genes CDK4/6 [14]. Taken together, the results of these studies demonstrate that individual RBPs can play essential biological roles in tumor progression. Furthermore, a comprehensive analysis of RBPs may assist us in sufficiently understanding the potential mechanisms that occur during cancer progression. Therefore, the ccRCC RNA sequencing dataset and corresponding clinical features were screened from The Cancer Genome Atlas (TCGA). In addition, a number of differentially expressed RBPs in normal and cancerous samples were identified via bioinformatics methods. Then, an effective gene signature was constructed using these RBPs to predict patient prognosis. In this study, we determined that multiple RBPs are related to the progression of ccRCC, which may be conducive to the identification of novel diagnostic and prognostic molecular markers.
Results
Identification of differentially expressed RBPs in ccRCC
The workflow of our study is presented in Figure 1. A total of 1542 RBP-related genes were processed using the “limma” package, and 397 complied with our standards (false discovery rate (FDR) < 0.05, |log2FC| > 0.5), including 153 significantly downregulated genes and 244 significantly upregulated genes. The results are displayed as heat maps and volcano plots (Figure 2A, 2B).
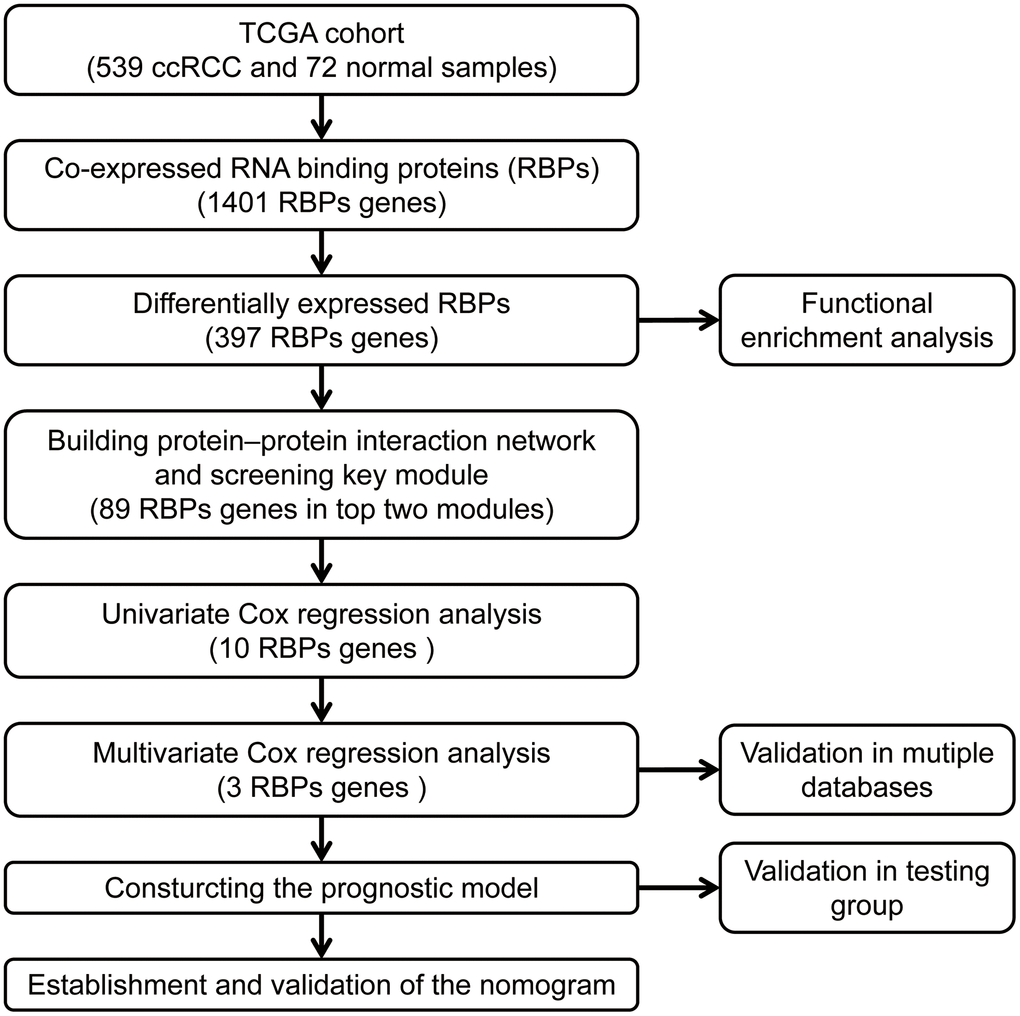
Figure 1. The workflow for analyzing the RBPs in ccRCC.
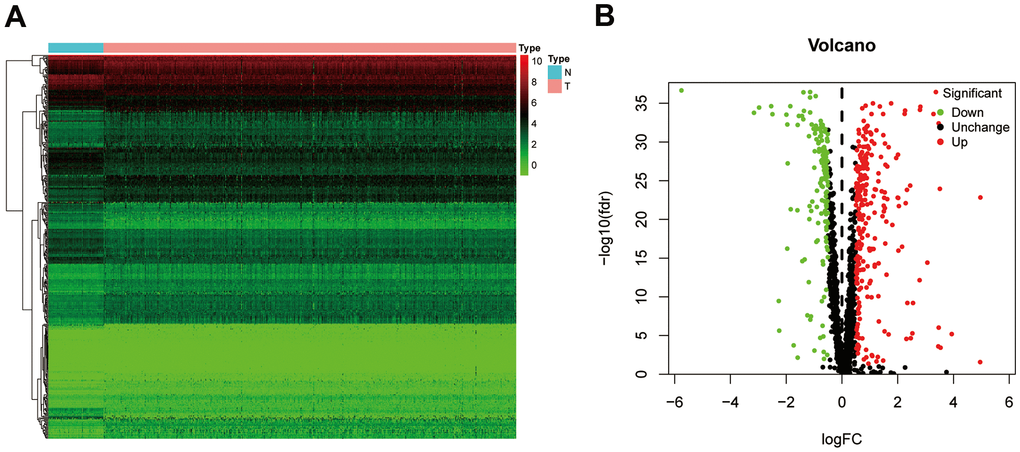
Figure 2. The differentially expressed RBPs in ccRCC. (A) Heatmap of differentially RBPs in different samples. Red represents upregulation and green represents downregulation. (B) Volcanic plot showing dysregulated RBPs in ccRCC tissue samples. ccRCC, clear cell renal cell carcinoma; RBPs, RNA-binding proteins.
Functional enrichment analysis of the differentially expressed RBPs
To investigate the mechanism of the differentially expressed RBPs, we conducted Gene Ontology (GO) and Kyoto Encyclopedia of Genes Genomes (KEGG) pathway enrichment analyses. According to the P value, from lowest to highest, the top three biological process (BP) terms were RNA catabolic process, mRNA catabolic process, and RNA splicing. In the molecular function (MF) category, the top three terms were catalytic activity acting on RNA, mRNA 3'-UTR binding, and ribonuclease activity. In the cellular component (CC) category, ribosomal subunit, ribonucleoprotein granule, and cytoplasmic ribonucleoprotein granule were the top-ranking terms. KEGG pathway analysis showed that these genes were closely related to the ribosome, RNA transport, and mRNA surveillance pathways. These results are presented in a bubble chart (Figure 3A, 3B).
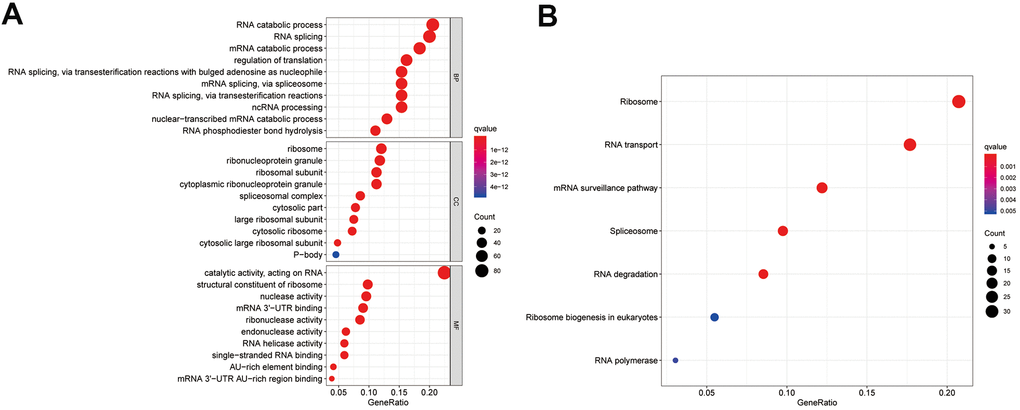
Figure 3. Enrichment analysis of differentially expressed RBPs. (A) Top 10 enriched BP terms, CC terms, MF terms. (B) The significant KEGG signal pathways. BP, biological process; CC, cellular components; MF, molecular functions; KEGG, Kyoto Encyclopedia of Genes and Genomes.
Protein-protein interaction (PPI) network construction and key module screening
The PPI network was constructed to explore the underlying molecular biological function of these differentially expressed RBPs. A total of 398 nodes and 4067 edges were analyzed using plugin string. Then, we further analyzed the coexpression network to screen potential significant modules. Finally, the top two key modules were confirmed (Figure 4A). Module 1 consisted of 46 nodes and 905 edges (Figure 4B), and module 2 included 43 nodes and 429 edges (Figure 4C). Subsequently, the GO and KEGG pathway analysis revealed that the genes of module 1 were mostly enriched in the nuclear-transcribed mRNA catabolic process, ribosomal subunit, structural constituent of ribosome, and ribosome terms, whereas the genes in module 2 were primarily enriched in the RNA splicing, spliceosomal complex, catalytic activity acting on RNA, and spliceosome terms.
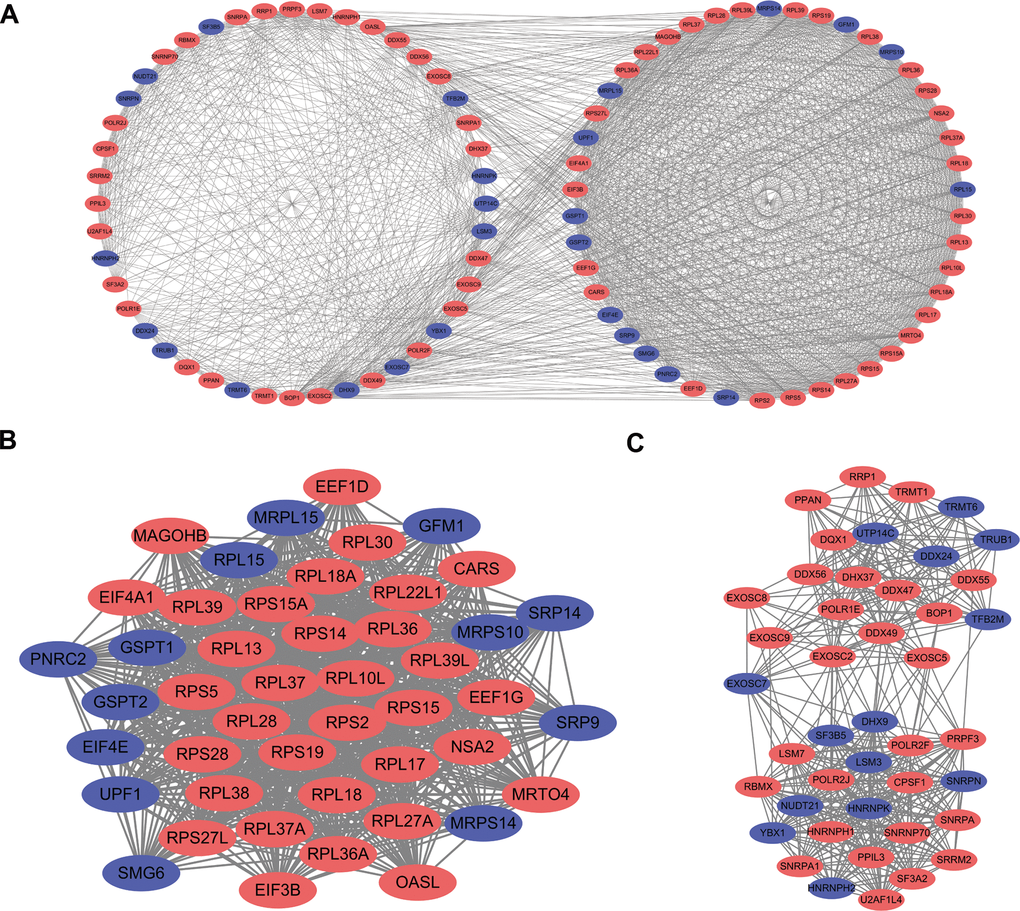
Figure 4. PPI network construction and key module screening. (A) Protein-protein interaction network. (B) Significant module 1. (C) Significant module 2. Blue: down-regulation genes. Red: up-regulation genes.
Selection and verification of prognosis-related genes
Among the 89 differentially expressed RBPs in the top two critical modules, 10 genes were identified as significantly related to prognosis by univariate Cox regression analysis (Figure 5A). Then, multivariate Cox regression was used to screen the RBP-related genes with independent prognostic value (Figure 5B), and three genes (EIF4A1, CARS, and RPL22L1) were selected as factors related to high risk in the prognostic model (Table 1). Additionally, we constructed a predictive model with these three genes in the training groups using LASSO regression analysis. Survival analyses were performed according to the expression of these three genes (Figure 6A–6C).
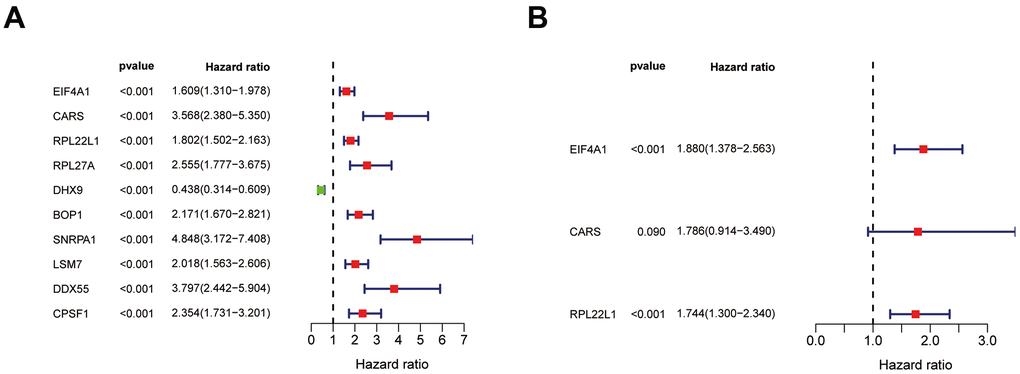
Figure 5. Identification of prognosis related hub RBPs. (A) Significance and Hazard ratio values of differentially expressed RBPs in univariate Cox regression. (B) Identification of prognosis related hub RBPs using multivariate Cox regression analysis.
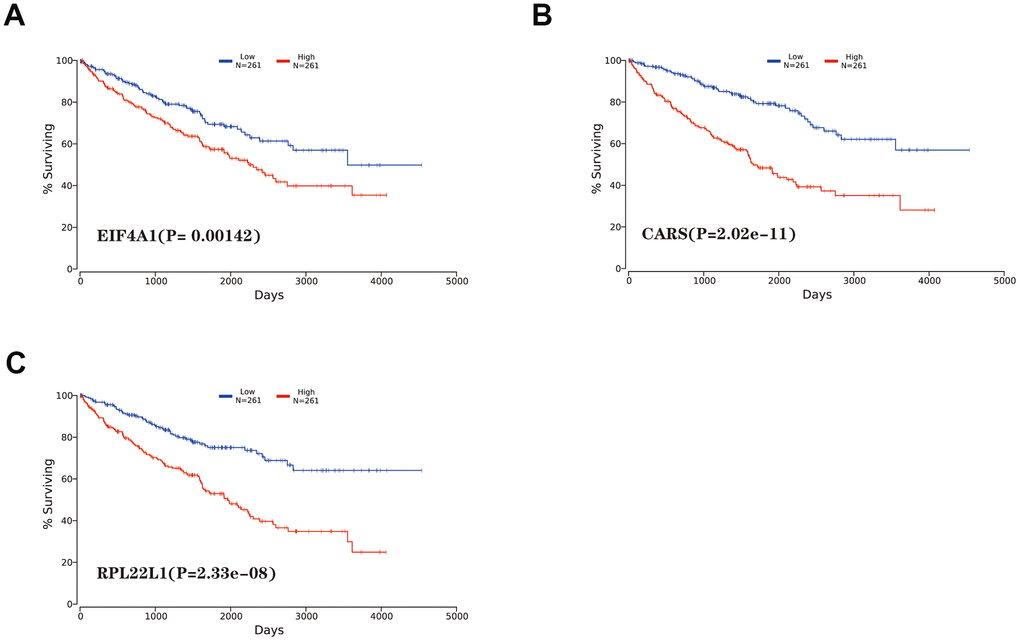
Figure 6. Kaplan-Meier survival analysis of hub genes. (A) EIF4A1. (B) CARS. (C) RPL22L1.
Table 1. List of the hub genes related with ccRCC patient prognosis.
| Gene name | Gene ID | Protein name | Location | Expression status |
| EIF4A1 | 1973 | Eukaryotic translation initiation factor 4A1 | Chromosome 17 | Up-regulated |
| CARS | 833 | Cysteinyl-tRNA synthetase | Chromosome 11 | Up-regulated |
| RPL22L1 | 200916 | Ribosomal protein L22 like 1 | Chromosome 3 | Up-regulated |
As shown in Figure 7A–7C, the mRNA expression levels of EIF4A1, CARS, and RPL22L1 between renal tumor and normal tissues demonstrated that these genes were significantly upregulated in ccRCC patients (p < 0.001). Furthermore, these three genes were also significantly abnormally expressed at the protein level (Figure 8A). The higher magnified pictures of IHC staining were provided (Supplementary Figure 3A). In the Gene Alteration Atlas database, CARS possessed the most frequent genetic alteration, at a frequency of 1.9% among the samples; the other two genes also showed mutations (Figure 8B).
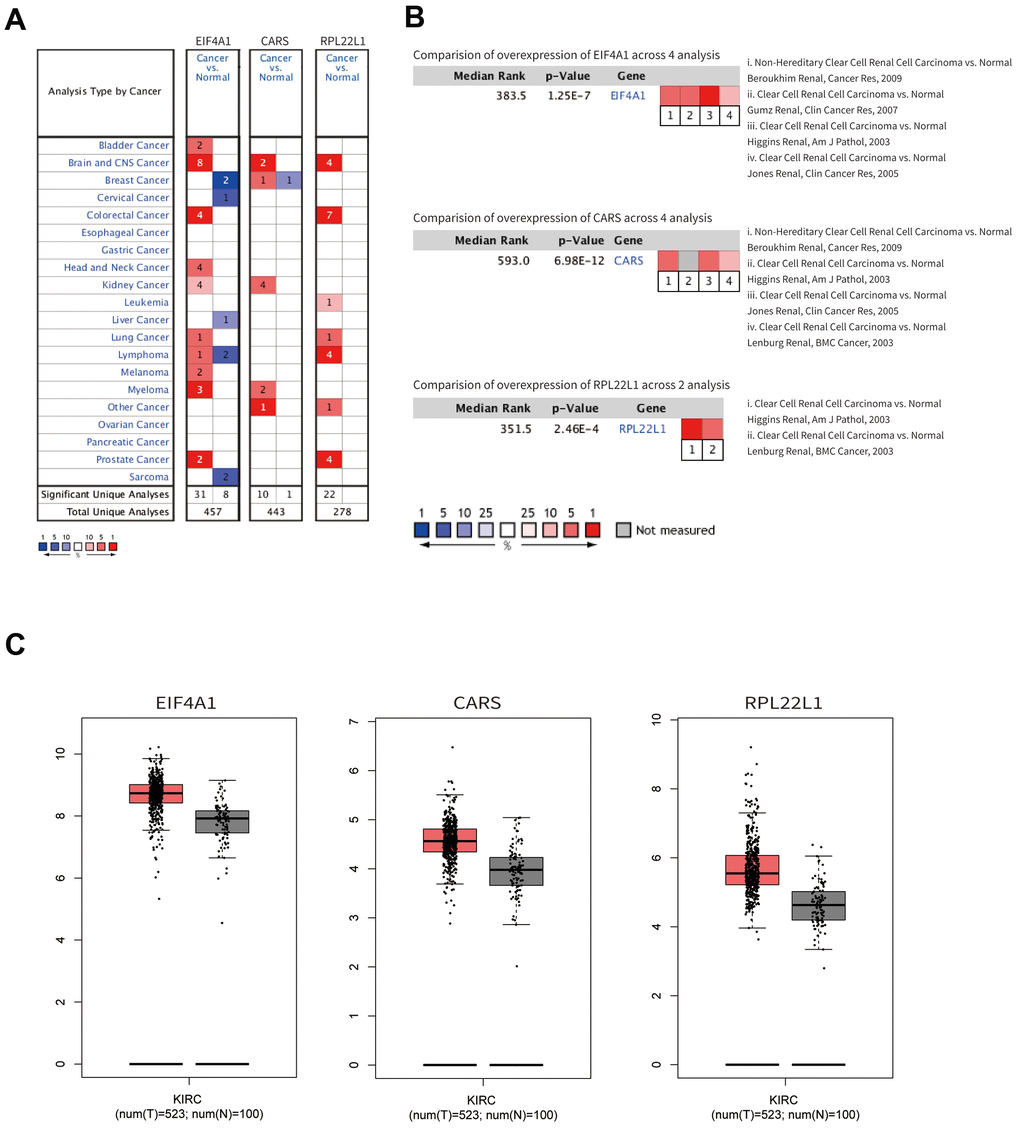
Figure 7. The mRNA expression profiles of hub genes. (A) The expression levels among different cancers. (B) The expression levels of the hub genes based on the published research. (C) The mRNA expression of hub genes in normal renal tissue and ccRCC.
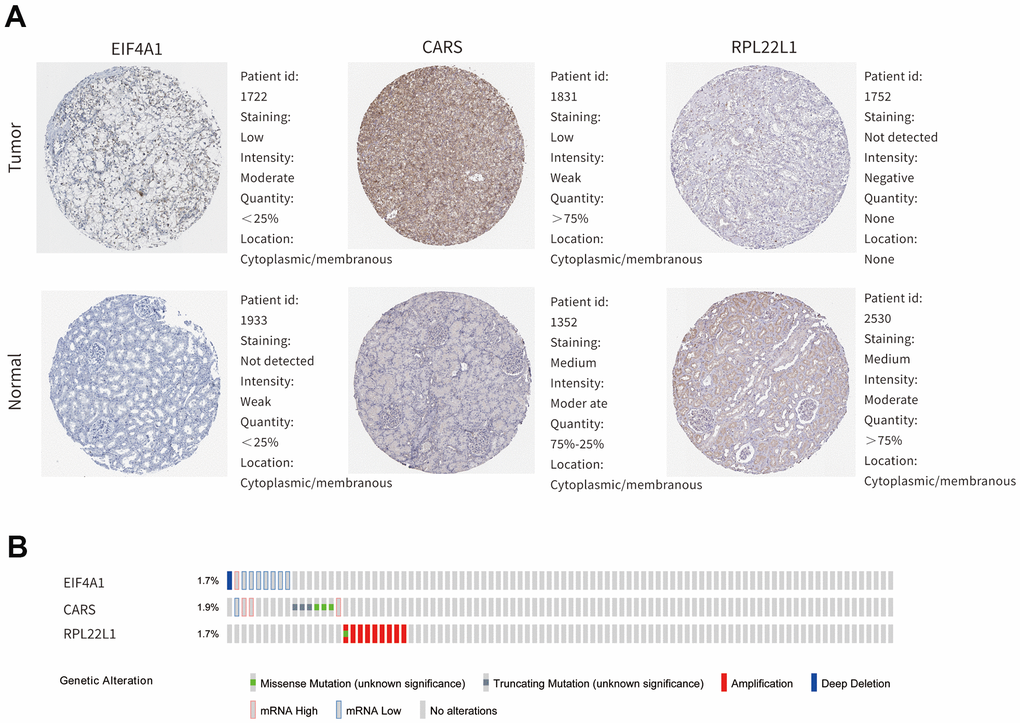
Figure 8. The expression profiles of hub genes in online bioinformatics databases. (A) The protein expression of hub genes in normal renal tissue and ccRCC on the HPA database. (B) Alterations of the hub genes on the cBioportal database.
Construction of the prognosis-related genetic risk score model
Subsequently, we calculated the risk scores using the following formula based on their Cox coefficients for the training dataset: Risk score = 0.631*ExpEIF4A1 + 0.5801*ExpCARS + 0.556*ExpRPL22L1. Then, ccRCC patients in the training group were split into a high-risk subgroup and a low-risk subgroup according to the median value of the risk score (Figure 9A). The dot plots show the survival status of the training group patients (Figure 9B). The expression heat maps of the three genes are shown in Figure 9C. Patients in the high-risk subgroup had considerably poorer overall survival (OS) than those in the low-risk subgroup (Figure 9D). Subsequently, receiver operating characteristic (ROC) analysis was performed to assess the predictive power of the three-RBP gene risk model; the area under the ROC curve (AUC) of this risk model for 5-year OS was 0.748 (Figure 9E). These results indicated that our risk model exhibited good specificity and sensitivity.
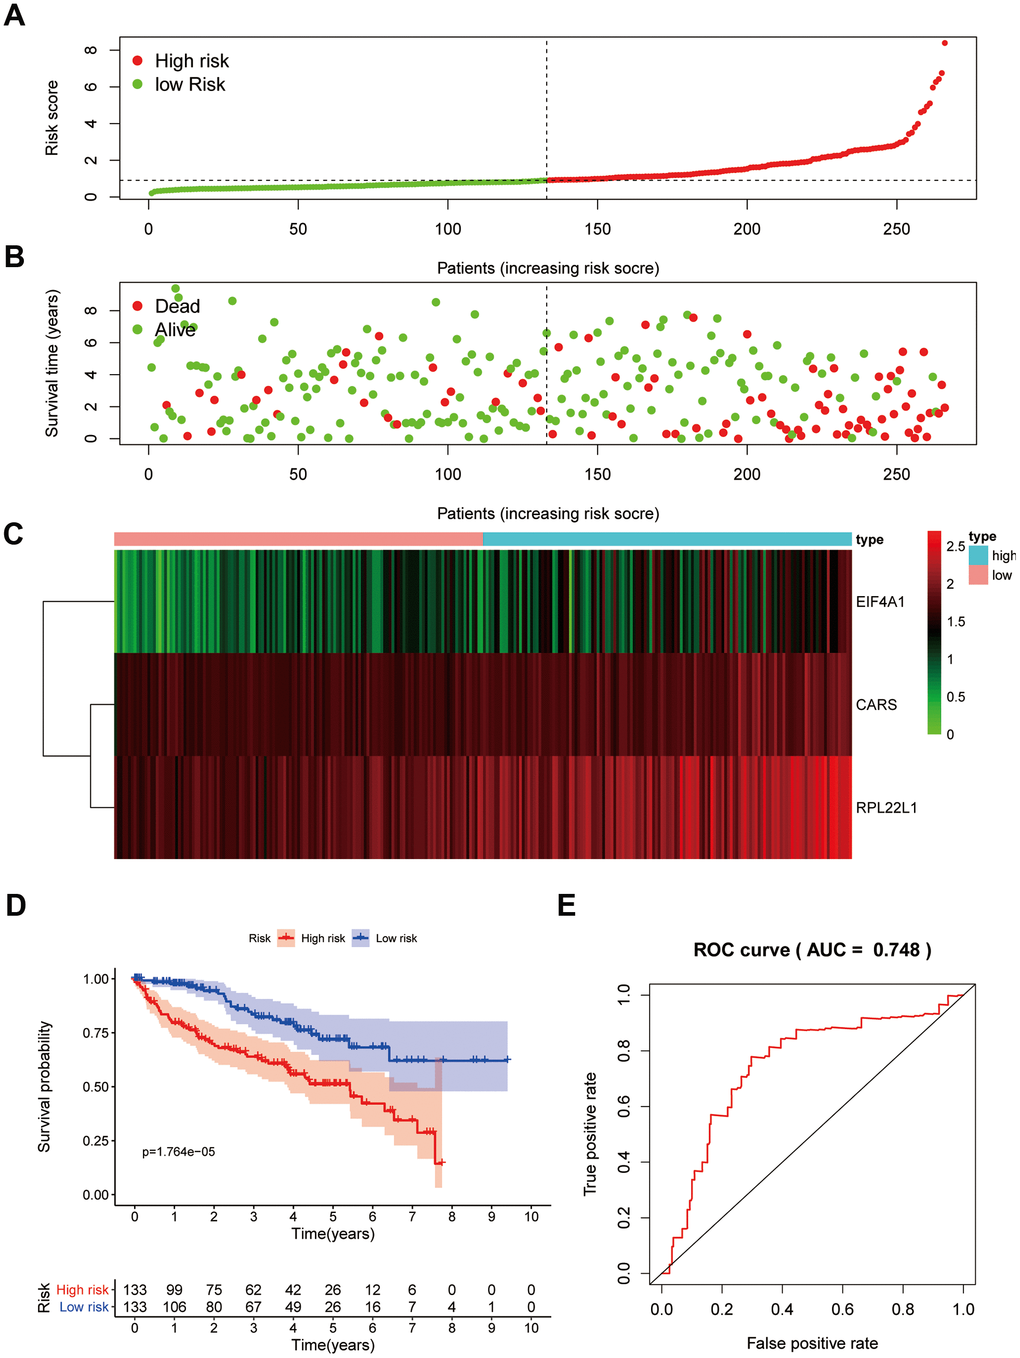
Figure 9. Prognostic analysis of three-gene model in the training group. The samples were divided into high- and low-risk subgroup according to the median of risk score. (A) The curve of risk score. (B) Survival status of patients. (C) Expression heatmap of three prognostic genes. (D) Survival curve for high- and low-risk subgroup. (E) ROC analysis of three-gene model. ROC, receiver operating characteristic.
Then, ccRCC patients were stratified according to grade and stage. For all different stratifications, the OS time of the high-risk group was shorter than that of the low-risk group (Supplementary Figure 1). These results suggest that the RBP-related risk model for OS can predict the prognosis of ccRCC patients without the need to consider clinicopathological variables. Additionally, high expression of CARS and RPL22L1 was significantly correlated with late stage and high grade (p<0.001), whereas EIF4A1 expression was not correlated with stage and grade (Supplementary Figure 2).
Verification of the risk score model in the testing group
To confirm that our risk model has similar predictive value in other ccRCC patient datasets, we performed the same analysis in the testing group. Patients in the testing group were divided into a high-risk subgroup and a low-risk subgroup according to the median risk score with the same risk assessment formula as the training group. The results demonstrated that high-risk patients exhibited worse outcomes than low-risk patients in the testing group (Figure 10A–10E). Furthermore, we analyzed the association of the risk score model and clinical features, such as sex, age, tumor grade, and stage, with patient survival. As displayed in Figure 11A, age, tumor stage, tumor grade, and risk score were related to the OS of patients using univariate Cox regression analysis. Next, we conducted multivariate Cox regression analysis, which demonstrated that tumor grade, tumor stage, and the risk score were significantly related to OS (Figure 11B). These results indicate that the risk score prognostic model can be used as an independent predictor of OS in ccRCC patients. Finally, we constructed a nomogram plot by combining the three-RBP signature with clinical characteristics, and this quantitative method can be used to assess the outcomes of ccRCC patients (Figure 11C). Gene set enrichment analysis (GSEA) was conducted to unravel the underlying molecular function of the risk model (Figure 12).
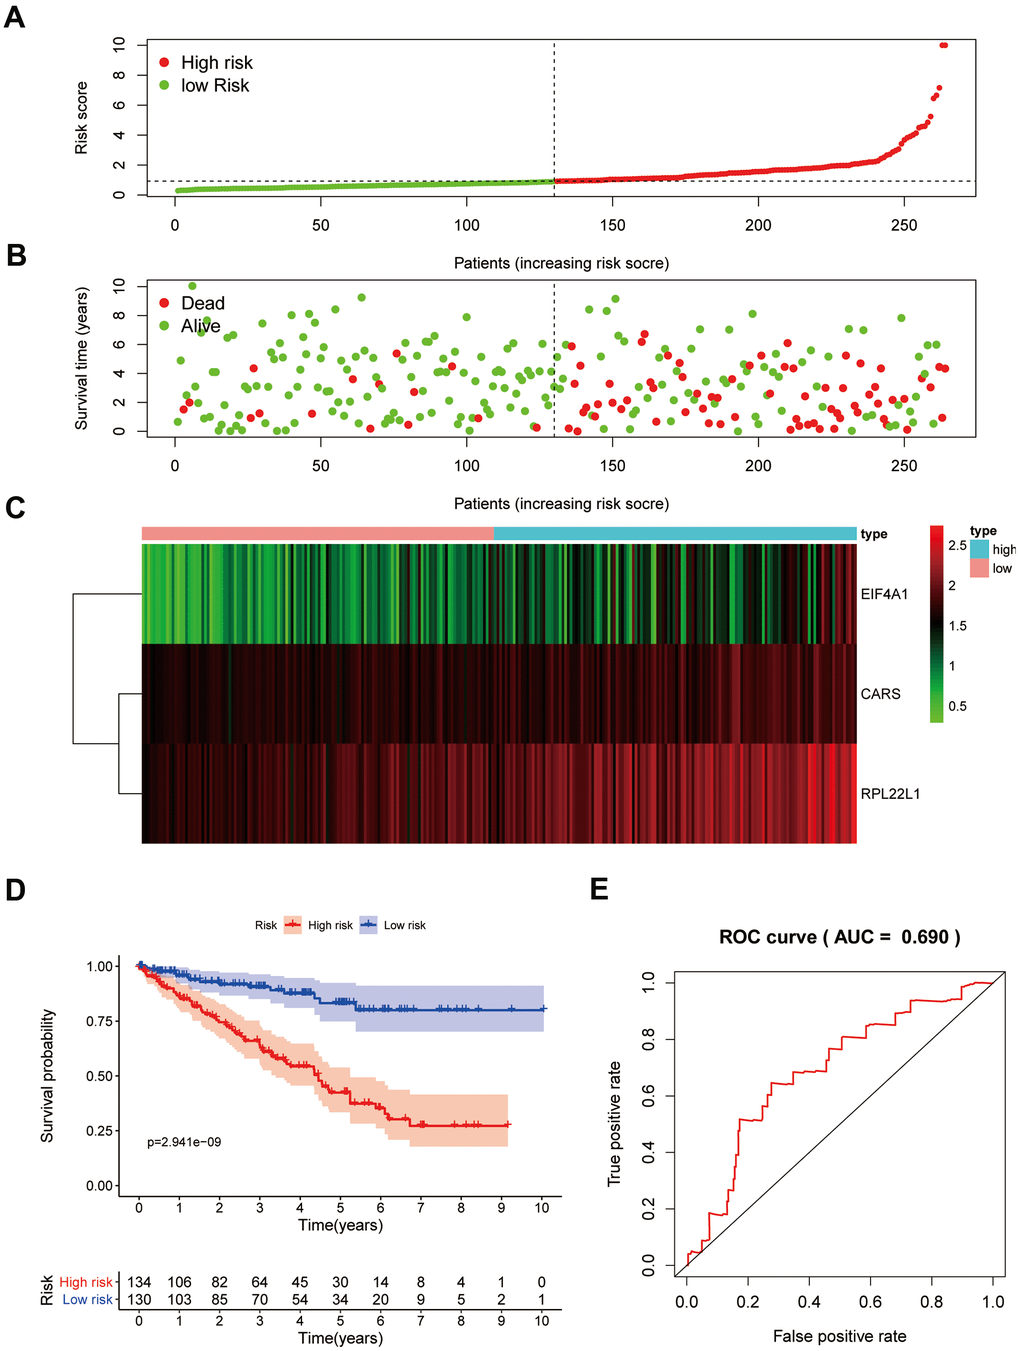
Figure 10. Prognostic analysis of three-gene model in the testing group. The samples were divided into high- and low-risk subgroup according to the median of risk score. (A) The curve of risk score. (B) Survival status of patients. (C) Expression heatmap of three prognostic genes. (D) Survival curve for high- and low-risk subgroup. (E) ROC analysis of three-gene model.
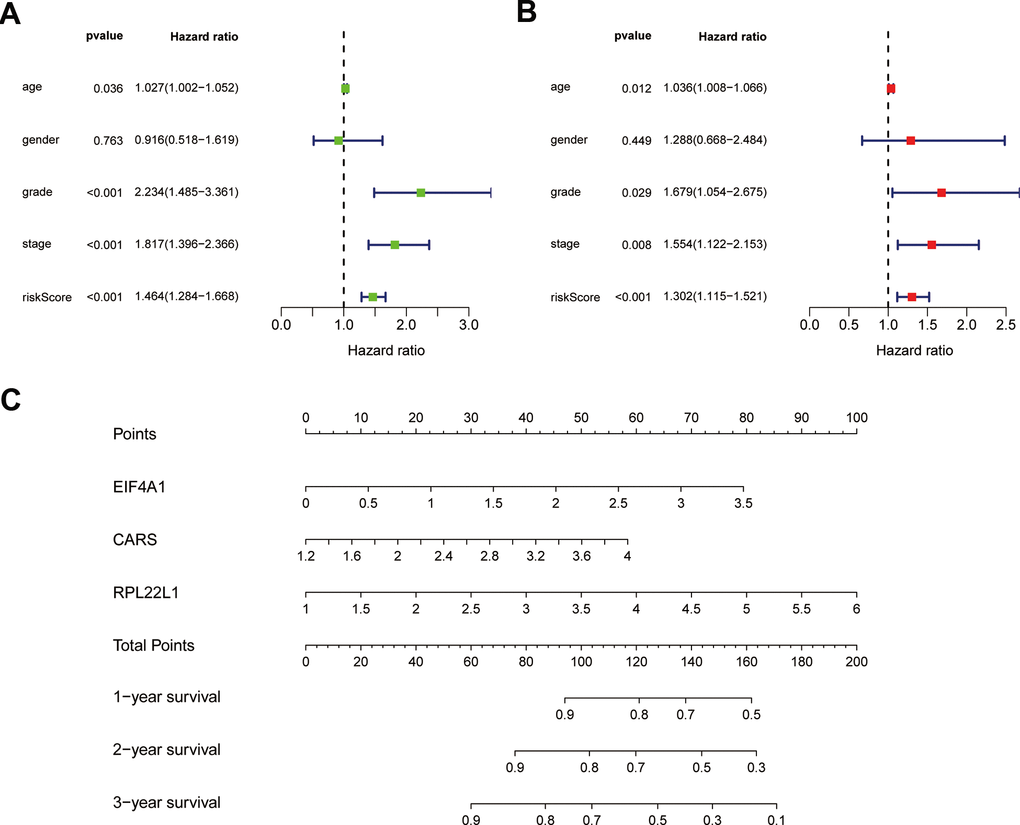
Figure 11. Results of Cox regression for risk factors for ccRCC and construction of nomograms. (A) Result of univariate Cox regression. (B) Result of multivariate Cox regression. (C) The nomograms for overall survival.
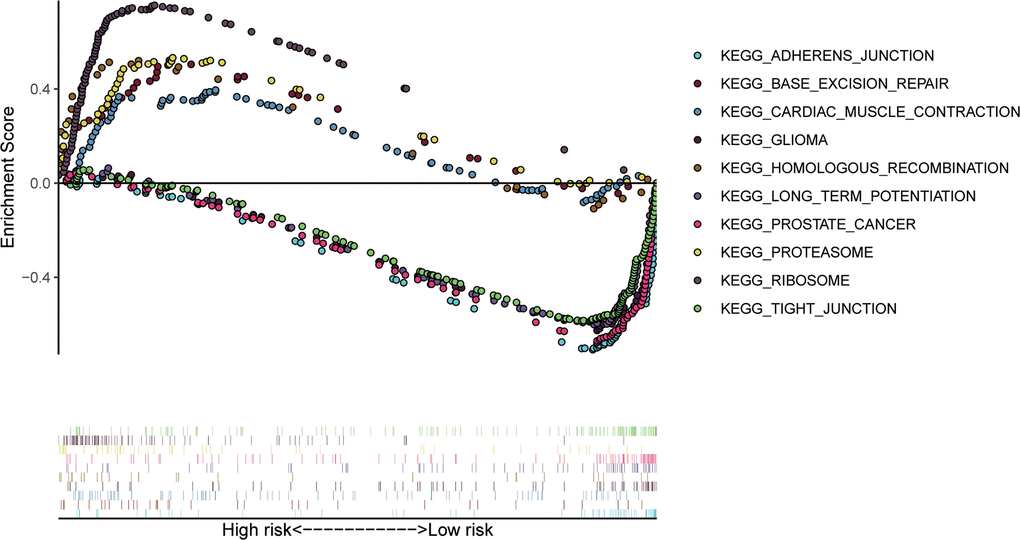
Figure 12. The top 10 significant enriched KEGG pathways in the training group.
Discussion
Despite great progress in tumor diagnosis and treatment, the OS and mortality rates of ccRCC patients remain unsatisfactory [1, 15]. Therefore, understanding the pathological mechanism of ccRCC is critical to improving its survival rate. Several studies have demonstrated that RBPs promote the progression of various malignant tumors [16–18]. However, there is little data regarding the potential function of RBPs in ccRCC tumorigenesis.
In our current study, we screened 397 differentially expressed RBPs between normal and ccRCC tissues based on RNA sequencing information from the TCGA. Then, we comprehensively investigated their potential biological functions and built a PPI network based on these RBPs. We also conducted univariate and multivariate Cox regression analysis, ROC analysis, KM survival analysis and copy number alteration analysis of the key RBPs to comprehensively investigate their underlying biological roles and clinical value. Moreover, a risk model based on three prognosis-related RBPs was constructed to assess the prognosis of ccRCC patients. These studies may promote the development of diagnostic and therapeutic approaches for ccRCC patients.
Functional enrichment analysis of the differentially expressed RBPs suggested that these were mainly enriched in the RNA catabolic process, RNA splicing, regulation of translation, ribonucleoprotein granule, ribosome, spliceosomal complex, and mRNA 3'-UTR binding terms, which indicated that RBPs play significant roles as posttranscriptional regulators. During the last ten years, multiple studies have reported that RNA processing and metabolism are associated with the development and progression of human diseases [19–21]. RBP NONO promotes breast cancer cell growth by increasing the stability of STAT3 mRNA [22]. hnRNPL impacts the pathological conditions of membranous nephropathy by stabilizing the MTNR1A transcript [23]. In addition, SRSF3 inhibits B7-H3 expression by regulating in its RNA splicing in colorectal cancer [24]. Furthermore, the KEGG enrichment analysis demonstrated that the abnormally expressed RBPs participate in the progression of ccRCC by regulating ribosomes, RNA transport, spliceosomes, ribosome biogenesis in eukaryotes, RNA degradation, and polymerases.
Subsequently, a PPI network was constructed based on these abnormally expressed RBPs. We obtained 89 key RBPs from two key modules. Many of these key RBPs have been reported to exert significant effects on tumorigenesis and the development of tumors. EIF4A1, a eukaryotic translation initiation factor, plays vital roles in protein translation initiation, participates in epithelial-to-mesenchymal transition (EMT) and is related to a poor prognosis in patients with gastric cancer [25]. Another study showed that EIF4A1 contributes to gastric cancer progression by binding miR-1284 with high specificity [26]. CARS, cysteinyl-tRNA synthetase, boosts antitumor immunity by specifically interacting with TLR2/6 of antigen-presenting cells [27]. RPL22L1 is a ribosomal protein that regulates pre-mRNA splicing to control morphogenesis [28]. Numerous previous studies have demonstrated that the expression of RPL22L1 is aberrant in human cancer, and this feature is associated with a poor prognosis in malignant tumors [29–31]. Another study systematically analyzed the influence of RBPs by bioinformatics analyses of colorectal cancer metastasis, which provided novel insights for diagnosis and targeted therapy [32]. In addition, multiple published studies have identified promising risk models for predicting tumor patient prognosis. For example, two studies explored the prognostic value of RBPs using bioinformatics analyses and built risk models based on RBP-related genes in lung adenocarcinoma that play essential roles in predicting patient prognosis and developing novel therapeutic targets [33, 34]. In head and neck squamous cell carcinoma (HNSCC), a two-RBP gene signature (consisting of EZH2 and NOVA1) was constructed to predict the clinical prognosis of HNSCC patients, and this model will assist clinicians in providing a clinical diagnosis, individualized therapy, and prognostic assessment [35].
In our study, the key RBPs were selected using survival analyses and univariate and multivariate Cox regression analyses. We ultimately identified three RBPs related to the prognosis of ccRCC patients, including EIF4A1, CARS, and RPL22L1. The expression of these three key RBPs was verified at the transcription and translation levels using the Gene Expression Profiling Interactive Analysis (GEPIA) and Human Protein Atlas (HPA) databases, and the results indicated that these genes are upregulated in ccRCC tissues compared to normal tissues. These findings indicate that EIF4A1, CARS, and RPL22L1 may exert carcinogenic effects. Subsequently, we constructed an effective prognostic risk model based on these genes using LASSO regression analysis. Next, the ROC curve analysis showed the superior diagnostic accuracy of the three-gene risk model over clinical features alone, with an AUC of 74.8% in the training group and 69% in the test group. However, the pathological mechanism by which these three RBPs promote ccRCC tumorigenesis is still unclear, and further molecular function studies are necessary. A nomogram was constructed to assist clinicians in predicting the outcomes of ccRCC patients. Our prognostic nomogram based on three RBPs may provide more reliable information for individualized treatment than conventional clinical characteristics.
In summary, this study provides new insights into the roles of RBPs during ccRCC development and reports the construction of an effective prognostic risk model to evaluate patient prognosis. In addition, RBP-related genes play a vital role in tumorigenesis, which suggests that these key RBPs may provide additional clues to aid in the exploration of new diagnostic strategies. However, there are some limitations to our study. First, the prognostic model was built based only on expression data from the TCGA. Although all samples were classified into a training group and testing group and the predictive efficacy of the prognostic model was verified in the testing group, our outcome would be more convincing with verification in other public datasets. We will collect the expression profiles and corresponding clinical data of patients from our own research center to complete this work. Second, our conclusions are based on a retrospective analysis, and these outcomes should be verified in prospective clinical research. Finally, the biological roles of the key RBPs in this risk model must be further investigated in ccRCC.
Overall, we systematically investigated the biological functions and prognostic value of differently expressed RBPs by comprehensive bioinformatics analysis in ccRCC. A prognostic signature consisting of three RBP-coding genes was established to serve as a novel prognostic factor for ccRCC. To the best of our knowledge, this study is the first to develop an RBP-related prognostic model for ccRCC. Our results contribute to the identification of novel diagnostic and prognostic molecular markers.
Materials and Methods
Source of data
The RNA sequencing data of 539 ccRCC samples and 72 normal renal samples and the corresponding clinical features of the patients were extracted from the TCGA (https://tcga-data.nci.nih.gov/tcga/). Patients who lacked information on age, sex, and survival status were excluded from the subsequent analysis. Finally, 530 ccRCC tumor samples and 72 normal samples were screened from the TCGA database. R language (version 3.6.0) was used to process the data.
Identification of differentially expressed RBPs and functional enrichment analysis
The Wilcox signed-rank test was used to screen the differentially expressed RBPs, with FDR less than 0.05 and absolute fold change (FC) more than 0.5 as the cutoffs. The functional enrichment analysis included KEGG and GO analyses, which were applied to evaluate the functional categories related to the differentially expressed RBPs using the R package “clusterProfiler”; FDR less than 0.05 was set as the significance threshold. The results were visualized with the R package ggplot2. Then, a PPI network of the differentially expressed RBPs was built using the Search Tool for the Retrieval of Interacting Genes/Proteins (STRING) database (https://string-db.org/). We imported these data into Cytoscape (version 3.6.1). The key modules were screened by using the MCODE plugin in Cytoscape.
External validation of the prognostic signature
The mRNA expression levels of the key genes between renal tumors and normal samples were obtained from the GEPIA online database (http://gepia.cancer-pku.cn/). Differential protein expression between renal tumor and normal tissues was assessed with data from the HPA database (https://www.proteinatlas.org/). Then, mutation data and overall copy number alteration data were obtained for hub genes in the cBioPortal database (http://www.cbioportal.org/). We validated the significance and the expression rank of hub RBPs in the Oncomine database (https://www.oncomine.org/). Kaplan-Meier survival analysis was performed with the OncoLnc online software (http://www.oncolnc.org/). GSEA was conducted with online software (version 4.0.3).
Statistical analysis
The data were analyzed using the PERL programming language (version 5.32.0). All statistical analyses were conducted using the R language (version 3.6.0). Differences with P < 0.05 were regarded as statistically significant.
Supplementary Materials
Abbreviations
ccRCC: clear cell renal cell carcinoma; AJCC: American Joint Committee on Cancer; TCGA: The Cancer Genome Atlas; OS: overall survival; FC: fold change; GO: Gene Ontology; KEGG: Kyoto Encyclopedia of Genes and Genomes; BP: biological process; CC: cellular components; MF: molecular functions; ROC: receiver operating characteristic; AUC: area under the ROC curve; GSEA: Gene Set Enrichment Analysis.
Author Contributions
QC and ZLL designed the study and performed the data analysis. SQF, SY W, YTL, MM, and XRY revised the figures. QC, ZLL, WJX, and BBG collected data and performed the literature search for the manuscript. QC and TS revised the manuscript.
Acknowledgments
We thank American Journal Experts (AJE) for its editing assistance during the preparation of this manuscript.
Conflicts of Interest
The authors declare no conflicts of interest.
Funding
This study was supported by National Natural Science Foundation of China (NSFC) [81460137], Natural Science Foundation of Jiangxi [20151BAB205015], Special Fund for Postgraduate Innovation of Nanchang University [CX2018183].
References
- 1. Siegel RL, Miller KD, Jemal A. Cancer statistics, 2019. CA Cancer J Clin. 2019; 69:7–34. https://doi.org/10.3322/caac.21551 [PubMed]
- 2. Miller KD, Nogueira L, Mariotto AB, Rowland JH, Yabroff KR, Alfano CM, Jemal A, Kramer JL, Siegel RL. Cancer treatment and survivorship statistics, 2019. CA Cancer J Clin. 2019; 69:363–85. https://doi.org/10.3322/caac.21565 [PubMed]
- 3. Gerstberger S, Hafner M, Tuschl T. A census of human RNA-binding proteins. Nat Rev Genet. 2014; 15:829–45. https://doi.org/10.1038/nrg3813 [PubMed]
- 4. Gerstberger S, Hafner M, Ascano M, Tuschl T. Evolutionary conservation and expression of human RNA-binding proteins and their role in human genetic disease. Adv Exp Med Biol. 2014; 825:1–55. https://doi.org/10.1007/978-1-4939-1221-6_1 [PubMed]
- 5. Nahalka J. The role of the protein-RNA recognition code in neurodegeneration. Cell Mol Life Sci. 2019; 76:2043–58. https://doi.org/10.1007/s00018-019-03096-3 [PubMed]
- 6. Corley M, Burns MC, Yeo GW. How RNA-binding proteins interact with RNA: molecules and mechanisms. Mol Cell. 2020; 78:9–29. https://doi.org/10.1016/j.molcel.2020.03.011 [PubMed]
- 7. Glisovic T, Bachorik JL, Yong J, Dreyfuss G. RNA-binding proteins and post-transcriptional gene regulation. FEBS Lett. 2008; 582:1977–86. https://doi.org/10.1016/j.febslet.2008.03.004 [PubMed]
- 8. Jackson TC, Kochanek PM. RNA binding motif 5 (RBM5) in the CNS-moving beyond cancer to harness RNA splicing to mitigate the consequences of brain injury. Front Mol Neurosci. 2020; 13:126. https://doi.org/10.3389/fnmol.2020.00126 [PubMed]
- 9. Kosti A, de Araujo PR, Li WQ, Guardia GD, Chiou J, Yi C, Ray D, Meliso F, Li YM, Delambre T, Qiao M, Burns SS, Lorbeer FK, et al. The RNA-binding protein SERBP1 functions as a novel oncogenic factor in glioblastoma by bridging cancer metabolism and epigenetic regulation. Genome Biol. 2020; 21:195. https://doi.org/10.1186/s13059-020-02115-y [PubMed]
- 10. Pereira B, Billaud M, Almeida R. RNA-binding proteins in cancer: old players and new actors. Trends Cancer. 2017; 3:506–28. https://doi.org/10.1016/j.trecan.2017.05.003 [PubMed]
- 11. Chatterji P, Rustgi AK. RNA binding proteins in intestinal epithelial biology and colorectal cancer. Trends Mol Med. 2018; 24:490–506. https://doi.org/10.1016/j.molmed.2018.03.008 [PubMed]
- 12. Iino K, Mitobe Y, Ikeda K, Takayama KI, Suzuki T, Kawabata H, Suzuki Y, Horie-Inoue K, Inoue S. RNA-binding protein NONO promotes breast cancer proliferation by post-transcriptional regulation of SKP2 and E2F8. Cancer Sci. 2020; 111:148–59. https://doi.org/10.1111/cas.14240 [PubMed]
- 13. Zhu Z, Wei D, Li X, Wang F, Yan F, Xing Z, Yan Z, Lu H, Zhai D, Ye Z, Zhang G, Meng P, Zheng Y, et al. RNA-binding protein QKI regulates contact inhibition via yes-associate protein in ccRCC. Acta Biochim Biophys Sin (Shanghai). 2019; 51:9–19. https://doi.org/10.1093/abbs/gmy142 [PubMed]
- 14. Sherman EJ, Mitchell DC, Garner AL. The RNA-binding protein SART3 promotes miR-34a biogenesis and G1 cell cycle arrest in lung cancer cells. J Biol Chem. 2019; 294:17188–96. https://doi.org/10.1074/jbc.AC119.010419 [PubMed]
- 15. Joosten SC, Hamming L, Soetekouw PM, Aarts MJ, Veeck J, van Engeland M, Tjan-Heijnen VC. Resistance to sunitinib in renal cell carcinoma: from molecular mechanisms to predictive markers and future perspectives. Biochim Biophys Acta. 2015; 1855:1–16. https://doi.org/10.1016/j.bbcan.2014.11.002 [PubMed]
- 16. Zhang J, Zheng Z, Wu M, Zhang L, Wang J, Fu W, Xu N, Zhao Z, Lao Y, Xu H. The natural compound neobractatin inhibits tumor metastasis by upregulating the RNA-binding-protein MBNL2. Cell Death Dis. 2019; 10:554. https://doi.org/10.1038/s41419-019-1789-5 [PubMed]
- 17. Soni S, Anand P, Padwad YS. MAPKAPK2: the master regulator of RNA-binding proteins modulates transcript stability and tumor progression. J Exp Clin Cancer Res. 2019; 38:121. https://doi.org/10.1186/s13046-019-1115-1 [PubMed]
- 18. Dong W, Dai ZH, Liu FC, Guo XG, Ge CM, Ding J, Liu H, Yang F. The RNA-binding protein RBM3 promotes cell proliferation in hepatocellular carcinoma by regulating circular RNA SCD-circRNA 2 production. EBioMedicine. 2019; 45:155–67. https://doi.org/10.1016/j.ebiom.2019.06.030 [PubMed]
- 19. Li Y, McGrail DJ, Xu J, Li J, Liu NN, Sun M, Lin R, Pancsa R, Zhang J, Lee JS, Wang H, Mills GB, Li X, et al. MERIT: systematic analysis and characterization of mutational effect on RNA interactome topology. Hepatology. 2019; 70:532–46. https://doi.org/10.1002/hep.30242 [PubMed]
- 20. Kim TH, Tsang B, Vernon RM, Sonenberg N, Kay LE, Forman-Kay JD. Phospho-dependent phase separation of FMRP and CAPRIN1 recapitulates regulation of translation and deadenylation. Science. 2019; 365:825–29. https://doi.org/10.1126/science.aax4240 [PubMed]
- 21. Siang DT, Lim YC, Kyaw AM, Win KN, Chia SY, Degirmenci U, Hu X, Tan BC, Walet AC, Sun L, Xu D. The RNA-binding protein HuR is a negative regulator in adipogenesis. Nat Commun. 2020; 11:213. https://doi.org/10.1038/s41467-019-14001-8 [PubMed]
- 22. Kim SJ, Ju JS, Kang MH, Eun JW, Kim YH, Raninga PV, Khanna KK, Győrffy B, Pack CG, Han HD, Lee HJ, Gong G, Shin Y, et al. RNA-binding protein NONO contributes to cancer cell growth and confers drug resistance as a theranostic target in TNBC. Theranostics. 2020; 10:7974–92. https://doi.org/10.7150/thno.45037 [PubMed]
- 23. Huang YS, Lu KC, Chao HW, Chen A, Chao TK, Guo CY, Hsieh HY, Shih HM, Sytwu HK, Wu CC. The MTNR1A mRNA is stabilized by the cytoplasmic hnRNPL in renal tubular cells. J Cell Physiol. 2020. [Epub ahead of print]. https://doi.org/10.1002/jcp.29988 [PubMed]
- 24. Zhang C, Chen Y, Li F, Yang M, Meng F, Zhang Y, Chen W, Wang W. B7-H3 is spliced by SRSF3 in colorectal cancer. Cancer Immunol Immunother. 2020. [Epub ahead of print]. https://doi.org/10.1007/s00262-020-02683-9 [PubMed]
- 25. Gao C, Guo X, Xue A, Ruan Y, Wang H, Gao X. High intratumoral expression of eIF4A1 promotes epithelial-to-mesenchymal transition and predicts unfavorable prognosis in gastric cancer. Acta Biochim Biophys Sin (Shanghai). 2020; 52:310–19. https://doi.org/10.1093/abbs/gmz168 [PubMed]
- 26. Wei W, Cao W, Zhan Z, Yan L, Xie Y, Xiao Q. MiR-1284 suppresses gastric cancer progression by targeting EIF4A1. Onco Targets Ther. 2019; 12:3965–76. https://doi.org/10.2147/OTT.S191015 [PubMed]
- 27. Cho S, Kim SB, Lee Y, Song EC, Kim U, Kim HY, Suh JH, Goughnour PC, Kim Y, Yoon I, Shin NY, Kim D, Kim IK, et al. Endogenous TLR2 ligand embedded in the catalytic region of human cysteinyl-tRNA synthetase 1. J Immunother Cancer. 2020; 8:e000277. https://doi.org/10.1136/jitc-2019-000277 [PubMed]
- 28. Zhang Y, O’Leary MN, Peri S, Wang M, Zha J, Melov S, Kappes DJ, Feng Q, Rhodes J, Amieux PS, Morris DR, Kennedy BK, Wiest DL. Ribosomal proteins Rpl22 and Rpl22l1 control morphogenesis by regulating pre-mRNA splicing. Cell Rep. 2017; 18:545–56. https://doi.org/10.1016/j.celrep.2016.12.034 [PubMed]
- 29. Liang Z, Mou Q, Pan Z, Zhang Q, Gao G, Cao Y, Gao Z, Pan Z, Feng W. Identification of candidate diagnostic and prognostic biomarkers for human prostate cancer: RPL22L1 and RPS21. Med Oncol. 2019; 36:56. https://doi.org/10.1007/s12032-019-1283-z [PubMed]
- 30. Ma J, Jing X, Chen Z, Duan Z, Zhang Y. MiR-361-5p decreases the tumorigenicity of epithelial ovarian cancer cells by targeting at RPL22L1 and c-Met signaling. Int J Clin Exp Pathol. 2018; 11:2588–96. [PubMed]
- 31. Rao S, Peri S, Hoffmann J, Cai KQ, Harris B, Rhodes M, Connolly DC, Testa JR, Wiest DL. RPL22L1 induction in colorectal cancer is associated with poor prognosis and 5-FU resistance. PLoS One. 2019; 14:e0222392. https://doi.org/10.1371/journal.pone.0222392 [PubMed]
- 32. Zhou B, Guo R. Integrative analysis of significant RNA-binding proteins in colorectal cancer metastasis. J Cell Biochem. 2018; 119:9730–9741. https://doi.org/10.1002/jcb.27290 [PubMed]
- 33. Li W, Gao LN, Song PP, You CG. Development and validation of a RNA binding protein-associated prognostic model for lung adenocarcinoma. Aging (Albany NY). 2020; 12:3558–73. https://doi.org/10.18632/aging.102828 [PubMed]
- 34. Li W, Li X, Gao LN, You CG. Integrated analysis of the functions and prognostic values of RNA binding proteins in lung squamous cell carcinoma. Front Genet. 2020; 11:185. https://doi.org/10.3389/fgene.2020.00185 [PubMed]
- 35. Jin Y, Qin X. Comprehensive analysis of the roles and prognostic value of RNA-binding proteins in head and neck squamous cell carcinoma. DNA Cell Biol. 2020; 39:1789–98. https://doi.org/10.1089/dna.2020.5641 [PubMed]