


Introduction
Endometrial cancer (EC) is a common malignant tumor in gynecology that seriously threatens the physical and mental health of females. The latest data from the American Cancer Society indicate that EC is the most-common malignant tumor of the female reproductive system in the United States [1]. EC has also become the second-most-common gynecological malignant tumor (after cervical cancer) in China, where its incidence is increasing and the mean onset age is decreasing. Although surgery is effective for treating most patients with early-stage EC, the prognosis of cases at stages III and IV remains very poor, with 5-year overall survival (OS) rates of 47~69% and 15~17%, respectively [2], and there remains a risk of recurrence or metastasis even after surgery in some EC patients. This situation indicates the importance of the early identification of EC patients at high risk of recurrence and metastasis.
The indicators that are commonly used in clinical risk assessments of EC are mainly based on clinicopathological characteristics such as the pathological tissue type, tumor pathological grade, FIGO stage, muscle invasion depth, and tumor size [3]. Advanced age and lymphatic vascular space invasion are also predictors of a poor prognosis in patients with EC [4, 5]. However, these prognosis criteria and classifications of EC have limitations in clinical practice that make them unsuitable for accurately predicting the prognosis of EC patients [6, 7]. This may lead to inaccurate assessments of the condition of EC patients, and hence either undertreatment or overtreatment. There is therefore an urgent need for effective indicators of the prognosis to be identified in order to help EC patients with more-targeted treatment options so as to improve their prognosis. In short, the development of new predictive biomarkers is essential for the pathogenesis, prognosis, evaluation, and biological treatment of EC.
Autophagy is a degradation pathway that is highly conserved during the evolution of eukaryotes. The formation of a double-layer membrane structure allows the transportation of damaged organelles, misfolded and aggregated proteins, and other macromolecular substances to the lysosome for degradation or recycling [8]. Autophagy plays very complex roles in tumors, including inhibiting or promoting them in different environments and stages of cancer development [9, 10]. Autophagy is generally beneficial during the normal state of the body and the early stages of tumors, by eliminating oncogenic protein substrates, misfolded proteins, and damaged organelles, maintaining cell homeostasis, and either preventing tumors from occurring or inhibiting their progression [11]. However, once tumor develop to an advanced stage, autophagy—as a dynamic degradation and recycling system—promotes their survival and growth by enhancing the living ability of cancer cells in an environment characterized by nutrient starvation and hypoxia [12, 13]. Autophagy can also enhance the resistance of tumors to anticancer treatments such as radiotherapy, chemotherapy, and targeted therapy [14].
The dynamic role of autophagy in tumor progression has received considerable attention in research into clinical treatments. Regulating autophagy activity to inhibit tumor development has emerged as a new direction for tumor treatments. Autophagy and EC are closely related, with studies showing that autophagy plays a vital role in the development and survival mechanism of EC [15]. Giatromanolaki et al. and Deng et al. found that certain autophagy-related factors are overexpressed in EC tissues and can promote the occurrence and development of these tumors [16, 17]. The PI3K-Akt-mTOR signal transduction pathway is often overactivated in EC [18], and autophagy inhibitors such as rapamycin and chloroquine can inhibit the proliferation of EC cells [19, 20]. Autophagy is therefore a potential target for exploring the pathogenesis of EC.
Long noncoding RNA (lncRNA) is a noncoding RNA longer than 200 nucleotides that has no protein coding function. This type of RNA can participate in regulation via various mechanism, such as epigenetic regulation, transcription regulation, and posttranscriptional regulation. Gene expression plays an important role in various biological processes such as cell proliferation, differentiation, and apoptosis [21–23]. lncRNAs have been shown to be closely related to human diseases, especially those involving tumors [24, 25]. lncRNAs are abnormally expressed in a broad spectrum of tumors, and they play a key role in tumor occurrence, metastasis, and chemotherapy resistance, including in EC [26, 27]. lncRNAs the proliferation, migration, and invasion of EC cells by participating in various signal pathways, and they are potential targets for EC therapy and biomarkers for early diagnoses [28].
Autophagy is an important regulatory pathway for tumors that is closely related to lncRNA. Autophagy and lncRNA work together in tumors and other human diseases [29]. Many lncRNAs are involved in the dynamic process of autophagy, and can regulate the progression of most tumors by regulating the transcription and posttranscriptional autophagy-related genes [30, 31]. Example of this include AC023115.3 lncRNA, which increases the chemosensitivity of glioma cells to cisplatin by inhibiting autophagy [32]. Conversely, Li et al. found that MALAT1 lncRNA promotes the progression of pancreatic cancer by enhancing autophagy [33], while AC023115.3 lncRNA improves the chemosensitivity of glioma cells to cisplatin by regulating the miR-26a-GSK3β-Mcl1 pathway. Long-chain noncoding MEG3 interacts with ATG3 so as to increase the level of autophagy, resulting in inhibition of the occurrence and development of epithelial ovarian cancer [34]. LncRNAs, specifically HOTAIR, contribute to the cisplatin resistance of EC cells by enhancing autophagy [35]. Since these autophagy-related lncRNAs play important regulatory roles in the proliferation, metastasis, and chemotherapy resistance of tumor cells, they may be useful for prognosis evaluations of EC patients and as potential therapeutic targets for EC.
This study analyzed the lncRNAs data of EC patients in the TCGA (The Cancer Genome Atlas) database, identified autophagy-related lncRNAs related to the prognosis of EC, and constructed a novel autophagy-related lncRNA prognosis signature for EC. The present findings provide new ideas and directions for future investigations of the pathogenesis and prognosis of EC.
Results
Construction of a signature of five autophagy-related lncRNAs for patients with EC
We used the caret package in R software to randomly divide the EC samples into the training and testing data sets. Applying univariate Cox regression analysis to the training data set revealed 14 autophagy-related lncRNAs that had a significant prognostic value for EC (P<0.01). The detailed information of 14 autophagy-related lncRNA significantly related to OS are presented in Table 1. The following autophagy-related lncRNA prognosis signature was established for EC: PI = (0.255 × AC005229.4 expression) + (0.405 × BX322234.1 expression) + (0.169 × FIRRE expression) + (–0.122 × RAB11B-AS1 expression) + (–0.338 × AC003102.1 expression). The positive coefficients for AC005229.4, BX322234.1, and FIRRE in this signature indicate that patients with high expression levels of these lncRNAs had worse survival, whereas those with high expression levels of RAB11B-AS1 and AC003102.1 had better survival. The correlations between these five lncRNAs and autophagy genes are presented in Table 2 and Figure 1.
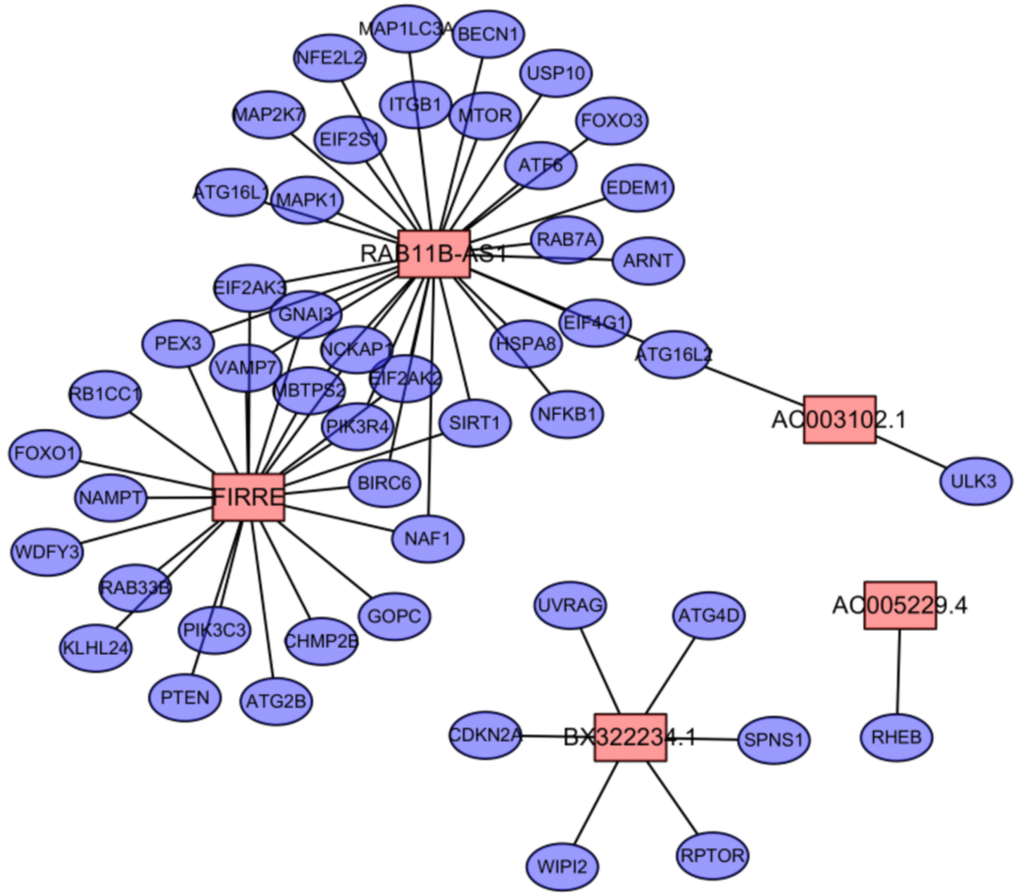
Figure 1. The co-expression network of OS-associated lncRNAs and autophagy genes in endometrial cancer. Among them, the pink node represents the lncRNA, and the blue node represents the co-expressed autophagy gene.
Table 1. Detailed information of 14 autophagy-related lncRNA significantly related to OS in EC.
| lncRNA | KM | B | SE | HR | HR.95L | HR.95H | P-value |
| LINC00662 | 0.002 | 0.266 | 0.074 | 1.305 | 1.129 | 1.508 | 0.000 |
| AC017074.1 | 0.001 | 0.047 | 0.018 | 1.049 | 1.012 | 1.086 | 0.008 |
| AC079807.1 | 0.008 | 0.805 | 0.204 | 2.236 | 1.499 | 3.334 | 0.000 |
| LNCTAM34A | 0.001 | -0.318 | 0.123 | 0.727 | 0.571 | 0.926 | 0.010 |
| AC107057.1 | 0.000 | 0.096 | 0.033 | 1.101 | 1.033 | 1.174 | 0.003 |
| AC003102.1 | 0.006 | -0.418 | 0.148 | 0.658 | 0.493 | 0.879 | 0.005 |
| RAB11B-AS1 | 0.010 | -0.204 | 0.076 | 0.815 | 0.703 | 0.945 | 0.007 |
| AC005229.4 | 0.001 | 0.274 | 0.088 | 1.316 | 1.107 | 1.564 | 0.002 |
| KRT7-AS | 0.004 | 0.170 | 0.052 | 1.185 | 1.071 | 1.312 | 0.001 |
| BX322234.1 | 0.002 | 0.578 | 0.140 | 1.783 | 1.356 | 2.345 | 0.000 |
| AC006329.1 | 0.004 | 0.106 | 0.034 | 1.112 | 1.040 | 1.189 | 0.002 |
| LINC01224 | 0.005 | 0.142 | 0.046 | 1.153 | 1.054 | 1.261 | 0.002 |
| FIRRE | 0.005 | 0.226 | 0.063 | 1.254 | 1.108 | 1.419 | 0.000 |
| AC010894.2 | 0.003 | 0.275 | 0.091 | 1.317 | 1.101 | 1.575 | 0.003 |
Table 2. Expression correlations between autophagy genes and OS-associated lncRNAs in EC.
| LncRNA | ARG gene | Correlation | P-value |
| AC005229.4 | RHEB | 0.365765623 | 6.46E-19 |
| BX322234.1 | WIPI2 | 0.312898199 | 5.29E-14 |
| BX322234.1 | UVRAG | 0.446190163 | 2.32E-28 |
| BX322234.1 | SPNS1 | 0.402240936 | 6.98E-23 |
| BX322234.1 | RPTOR | 0.369415813 | 2.73E-19 |
| BX322234.1 | CDKN2A | 0.327356943 | 2.97E-15 |
| BX322234.1 | ATG4D | 0.313754433 | 4.48E-14 |
| FIRRE | WDFY3 | 0.499216145 | 3.96E-36 |
| FIRRE | VAMP7 | 0.330521098 | 1.55E-15 |
| FIRRE | SIRT1 | 0.328338857 | 2.43E-15 |
| FIRRE | RB1CC1 | 0.536857049 | 1.57E-42 |
| FIRRE | RAB33B | 0.383946076 | 7.87E-21 |
| FIRRE | PTEN | 0.401258287 | 9.07E-23 |
| FIRRE | PIK3R4 | 0.511169817 | 4.47E-38 |
| FIRRE | PIK3C3 | 0.389171215 | 2.10E-21 |
| FIRRE | PEX3 | 0.340283484 | 1.98E-16 |
| FIRRE | NCKAP1 | 0.51556263 | 8.23E-39 |
| FIRRE | NAMPT | 0.329353888 | 1.97E-15 |
| FIRRE | NAF1 | 0.305954124 | 2.00E-13 |
| FIRRE | MBTPS2 | 0.405194041 | 3.17E-23 |
| FIRRE | KLHL24 | 0.635974705 | 6.71E-64 |
| FIRRE | GOPC | 0.35438881 | 8.88E-18 |
| FIRRE | GNAI3 | 0.427794497 | 5.71E-26 |
| FIRRE | FOXO1 | 0.318055813 | 1.93E-14 |
| FIRRE | EIF2AK3 | 0.408316782 | 1.36E-23 |
| FIRRE | EIF2AK2 | 0.408328314 | 1.36E-23 |
| FIRRE | CHMP2B | 0.335022602 | 6.05E-16 |
| FIRRE | BIRC6 | 0.626085477 | 2.04E-61 |
| FIRRE | ATG2B | 0.522143589 | 6.22E-40 |
| RAB11B-AS1 | VAMP7 | -0.350040404 | 2.35E-17 |
| RAB11B-AS1 | USP10 | -0.324970779 | 4.83E-15 |
| RAB11B-AS1 | SIRT1 | -0.358295007 | 3.65E-18 |
| RAB11B-AS1 | RAB7A | -0.321930194 | 8.91E-15 |
| RAB11B-AS1 | PIK3R4 | -0.424176953 | 1.62E-25 |
| RAB11B-AS1 | PEX3 | -0.352755027 | 1.28E-17 |
| RAB11B-AS1 | NFKB1 | -0.371001989 | 1.87E-19 |
| RAB11B-AS1 | NFE2L2 | -0.367478845 | 4.32E-19 |
| RAB11B-AS1 | NCKAP1 | -0.386736941 | 3.90E-21 |
| RAB11B-AS1 | NAF1 | -0.339333786 | 2.42E-16 |
| RAB11B-AS1 | MTOR | -0.319280676 | 1.51E-14 |
| RAB11B-AS1 | MBTPS2 | -0.382826961 | 1.04E-20 |
| RAB11B-AS1 | MAPK1 | -0.38722407 | 3.45E-21 |
| RAB11B-AS1 | MAP2K7 | 0.30129363 | 4.78E-13 |
| RAB11B-AS1 | MAP1LC3A | 0.377692003 | 3.70E-20 |
| RAB11B-AS1 | ITGB1 | -0.419554687 | 6.04E-25 |
| RAB11B-AS1 | HSPA8 | -0.336012079 | 4.91E-16 |
| RAB11B-AS1 | GNAI3 | -0.415554018 | 1.86E-24 |
| RAB11B-AS1 | FOXO3 | -0.302776485 | 3.63E-13 |
| RAB11B-AS1 | EIF4G1 | -0.353547373 | 1.07E-17 |
| RAB11B-AS1 | EIF2S1 | -0.322388095 | 8.13E-15 |
| RAB11B-AS1 | EIF2AK3 | -0.304404232 | 2.67E-13 |
| RAB11B-AS1 | EIF2AK2 | -0.338353032 | 2.99E-16 |
| RAB11B-AS1 | EDEM1 | -0.364453974 | 8.79E-19 |
| RAB11B-AS1 | BIRC6 | -0.305110956 | 2.34E-13 |
| RAB11B-AS1 | BECN1 | -0.31318785 | 5.00E-14 |
| RAB11B-AS1 | ATG16L2 | 0.324723157 | 5.08E-15 |
| RAB11B-AS1 | ATG16L1 | -0.301721876 | 4.41E-13 |
| RAB11B-AS1 | ATF6 | -0.306838338 | 1.69E-13 |
| RAB11B-AS1 | ARNT | -0.322264444 | 8.34E-15 |
| AC003102.1 | ULK3 | 0.355676499 | 6.63E-18 |
| AC003102.1 | ATG16L2 | 0.375825357 | 5.83E-20 |
Prognosis evaluation of the autophagy-related lncRNA signature in patients with EC in the training data set
We used the above formula to calculate the prognosis risk score for each patient in the training data set. The patients were divided into high- and low-risk groups by using the median score as the cutoff. The distributions of the risk scores, survival status, and survival duration of the 372 EC patients and the expression heatmap for the 5 lncRNAs are shown in Figure 2A. The K-M survival curve showed that OS was significantly worse for EC patients in the high-risk group than for those in the low-risk group (P<0.001, Figure 2B). ROC curves of the 1-, 3-, and 5-year OS rates drawn to evaluate the sensitivity and specificity of the prognosis signature revealed AUCs of 0.767, 0.727, and 0.730, respectively (Figure 2C). This indicates that the prognosis signature could be used to predict the prognosis of EC patients in the training data set.
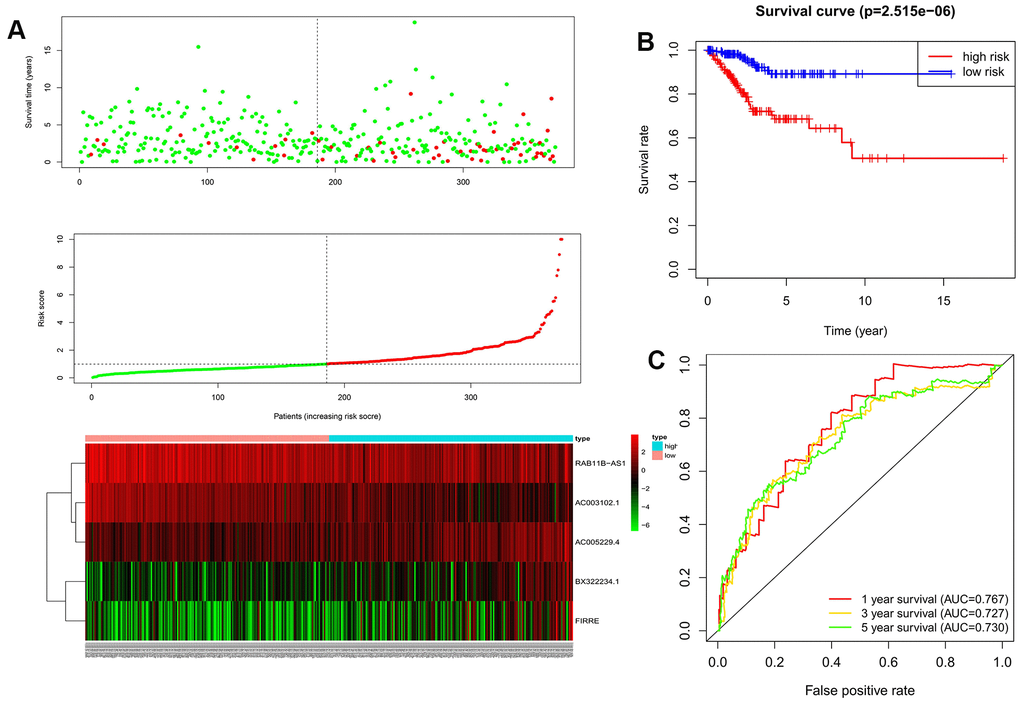
Figure 2. The evaluation of the autophagy-related lncRNA signature in the training dataset. (A) Autophagy-related lncRNA risk score analysis (Risk score distribution of the EC patients; survival status and duration of the EC patients; Heatmap of the 5 lncRNAs expression). (B) Kaplan-Meier survival analysis for EC patients in the training dataset; (C) Time-dependent ROC curve analysis for EC patients in the training dataset.
Validation of the autophagy-related lncRNA signature in the testing and entire data sets
We also tested the predictive power of the prognosis signature in the testing data set (n=156) and the entire data set (n=528). The formula was used to calculate the risk scores for EC patients in the testing data set and in the entire data set, and then the EC patients were divided into high- and low-risk groups using the cutoff for the training data set. K-M survival curves for the testing data set and the entire data set showed that the OS remained lower for EC patients in the high-risk group than for those in the low-risk group (Figure 3A, 3B). The AUCs for 1-, 3-, and 5-year OS rates were 0.849, 0.748, and 0.669, respectively, in the testing data set, and 0.772, 0.733, and 0.714 in the entire data set (Figure 3C, 3D). This reverification process showed that the prognosis signature had good accuracy and robustness.
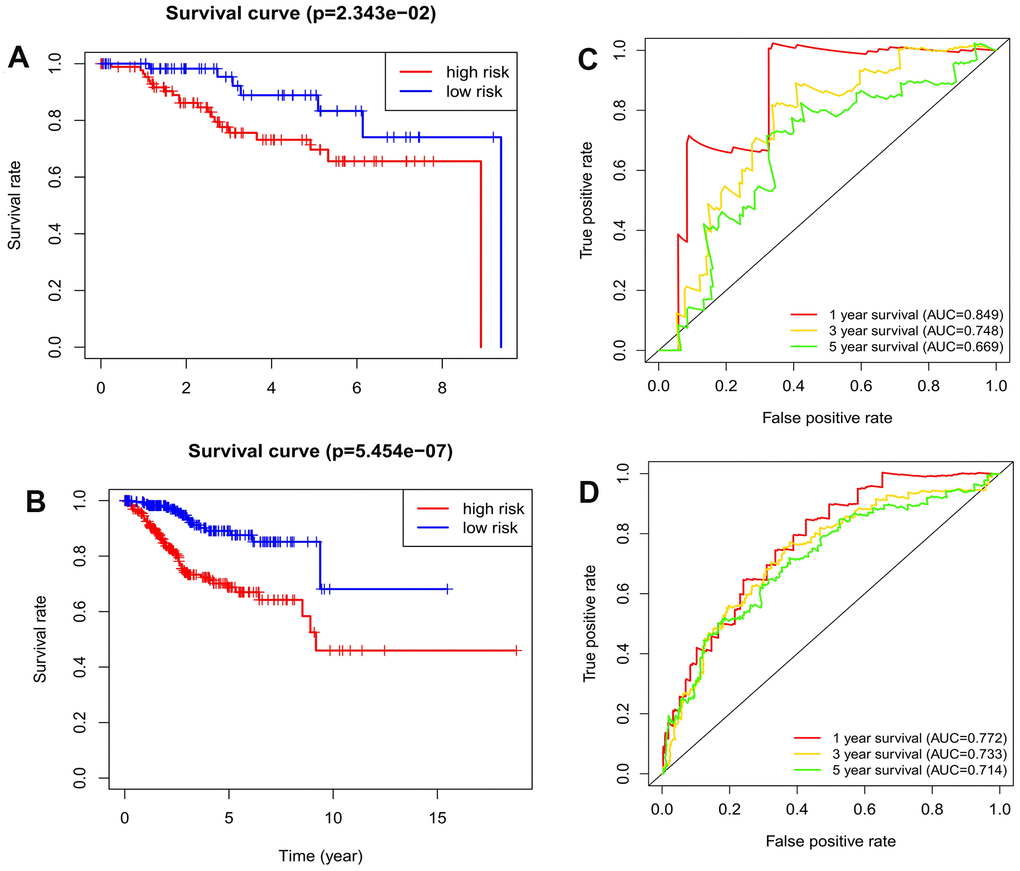
Figure 3. The validation of the autophagy-related lncRNA signature in the testing dataset and entire dataset. (A) Kaplan-Meier survival analysis for EC patients in the testing dataset; (B) Kaplan-Meier survival analysis for EC patients in the entire dataset; (C) Time-dependent ROC curve analysis for EC patients in the testing dataset. (D) Time-dependent ROC curve analysis for EC patients in the entire dataset.
Independence of the autophagy-related lncRNA signature for EC patients
The independent value of the autophagy-related lncRNA prognosis signature was evaluated by performing univariate and multivariate Cox regression analyses of the model and the clinical prognostic factors in the entire data set. The clinical prognostic factors comprised age, pathological type (endometrioid adenocarcinoma versus mixed and serous adenocarcinoma), FIGO stage (stage I + stage II versus stage III + stage IV), and pathological grade (grade 1 + grade 2 versus grade 3). The univariate Cox regression analysis showed that the autophagy-related lncRNA prognosis signature and the pathological type, age, FIGO stage, and tumor pathological grade were associated with the prognosis of EC patients (P<0.05) (Figure 4A). Meanwhile, the multivariate Cox regression analysis showed that the autophagy-related lncRNA prognosis signature and age, FIGO stage, and tumor pathological grade were independent prognostic factors for EC patients, whereas the pathological type was not (Figure 4B).
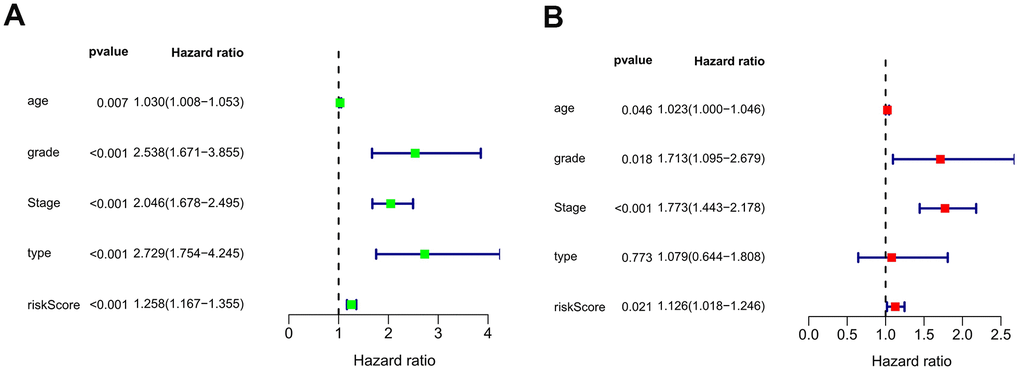
Figure 4. The forest plots of univariate (A) and multivariate (B) Cox regression analysis of the prognostic value in the entire dataset.
The prognostic effects of the autophagy-related gene prognosis signature were compared with those of other clinical factors by drawing ROC curves for the 1-year OS. The AUC was 0.772 for the autophagy-related lncRNA prognosis signature, and 0.555, 0.592, 0.740, and 0.649 for the pathological type, age, FIGO stage, and pathological grade, respectively. These values indicate that our autophagy-related lncRNA prognosis signature has better prognostic potential than the other clinical factors (Figure 5).
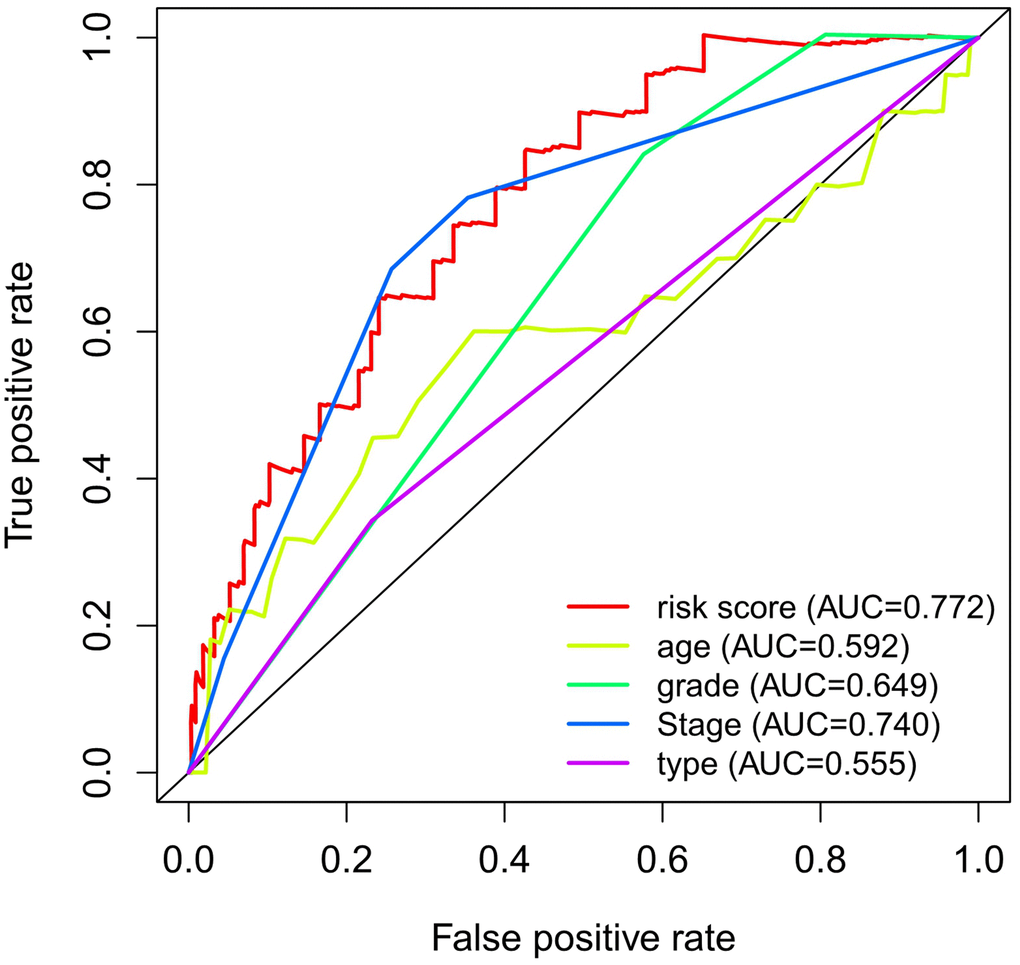
Figure 5. ROC curve analysis for 1-year OS in the entire dataset.
Clinical utility of the autophagy-related lncRNA signature
We further analyzed the relationships between the autophagy-related lncRNA prognosis signature and age, pathological grade, FIGO grade, and pathological type of EC patients. The results show that, the difference of the risk score for our signature was observed between age > 60 and age ≤ 60 (P <0.001). Besides, the risk score for our signature was higher in Stage III-IV than in Stage I-II (P <0.001), and higher in G3 than G1-2 (P <0.001), and higher in mixed and serous adenocarcinoma than endometrioid adenocarcinoma(P < 0.001) (Figure 6). The above results fully prove that the signature is closely related to EC progression.
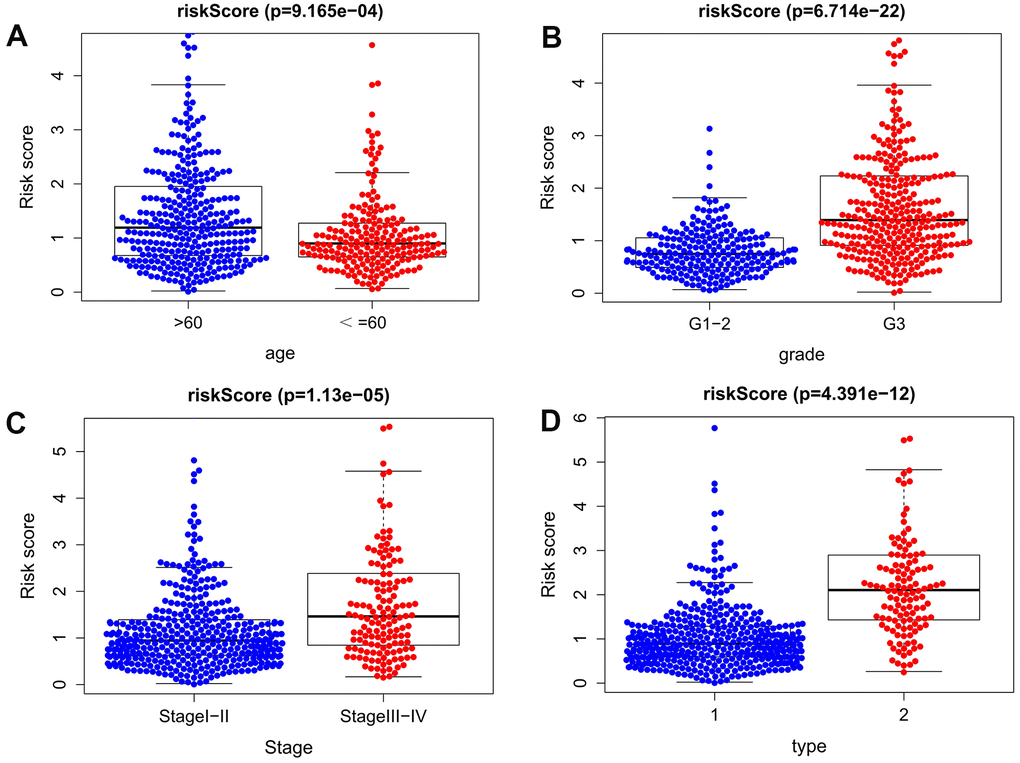
Figure 6. Clinical significance of the prognostic signature of EC. (A) age; (B) pathological grade; (C) FIGO stage; (D) histological type (1 endometrioid adenocarcinoma, 2 mixed and serous adenocarcinoma).
Gene set enrichment analysis
GSEA was applied to the high- and low-risk groups of the autophagy-related lncRNA prognosis signature. The results revealed that 69 pathways were significantly enriched in the high-risk group, including those related to axon guidance, progesterone-mediated oocyte maturation, cancer, ErbB signaling, DNA replication, EC, MAPK, and the cell cycle (false discovery rate: q<0.05) (Table 3). Figure 7 shows that there was partial pathway enrichment in the high-risk group, including in landmark-cancer-related pathways. We similarly found that autophagy-related signaling pathways were also enriched in the high-risk group (Figure 8), further confirming that the identified autophagy-related lncRNAs contribute to important cancer and autophagy pathways, which might represent strong evidence for its usefulness in the development of targeted therapies for EC.
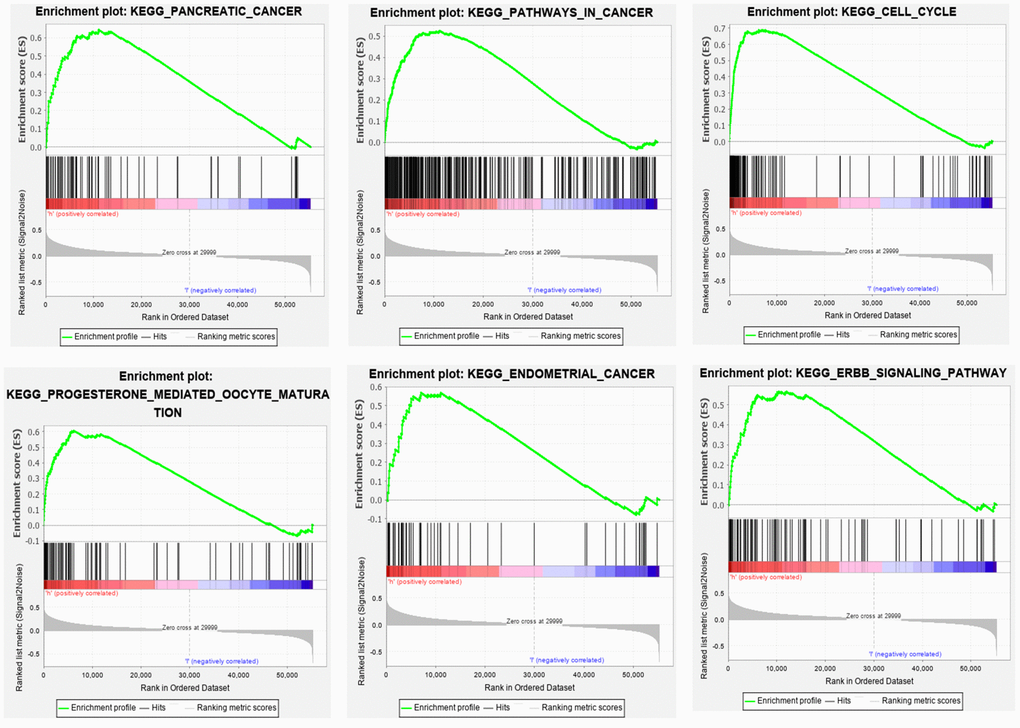
Figure 7. Some pathways were enriched in the high-risk group, among which the landmark cancer-related pathways were enriched.
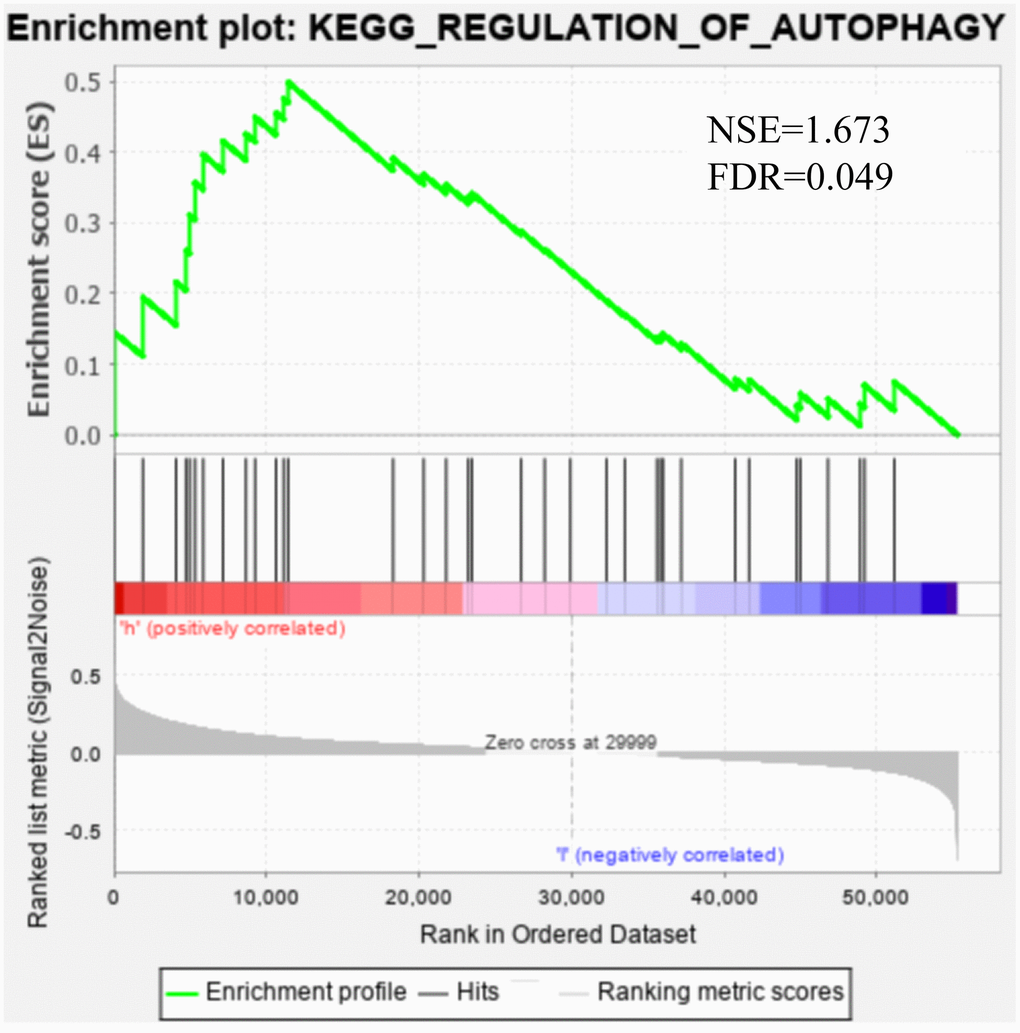
Figure 8. Gene set enrichment analysis showed that the autophagy pathway was enriched in the high-risk group.
Table 3. Results of gene set enrichment analysis based on the autophagy-related lncRNA signature.
| Name | Size | ES | NES | NOM p-val | FDR q-val | FWER p-val | |||||||||||||||||||||||||||||||||||||||||||||||||||||||||||||||||||||||||||||||||||||||||||||
| KEGG_AXON_GUIDANCE | 129 | 0.609 | 2.315 | 0.000 | 0.002 | 0.002 | |||||||||||||||||||||||||||||||||||||||||||||||||||||||||||||||||||||||||||||||||||||||||||||
| KEGG_CELL_CYCLE | 124 | 0.689 | 2.223 | 0.002 | 0.004 | 0.010 | |||||||||||||||||||||||||||||||||||||||||||||||||||||||||||||||||||||||||||||||||||||||||||||
| KEGG_PROGESTERONE_MEDIATED_OOCYTE_MATURATION | 85 | 0.606 | 2.201 | 0.000 | 0.005 | 0.013 | |||||||||||||||||||||||||||||||||||||||||||||||||||||||||||||||||||||||||||||||||||||||||||||
| KEGG_PANCREATIC_CANCER | 70 | 0.644 | 2.229 | 0.000 | 0.006 | 0.009 | |||||||||||||||||||||||||||||||||||||||||||||||||||||||||||||||||||||||||||||||||||||||||||||
| KEGG_CHRONIC_MYELOID_LEUKEMIA | 73 | 0.621 | 2.142 | 0.000 | 0.006 | 0.023 | |||||||||||||||||||||||||||||||||||||||||||||||||||||||||||||||||||||||||||||||||||||||||||||
| KEGG_OOCYTE_MEIOSIS | 112 | 0.594 | 2.108 | 0.004 | 0.007 | 0.032 | |||||||||||||||||||||||||||||||||||||||||||||||||||||||||||||||||||||||||||||||||||||||||||||
| KEGG_ERBB_SIGNALING_PATHWAY | 87 | 0.566 | 2.115 | 0.000 | 0.007 | 0.031 | |||||||||||||||||||||||||||||||||||||||||||||||||||||||||||||||||||||||||||||||||||||||||||||
| KEGG_PATHWAYS_IN_CANCER | 325 | 0.525 | 2.146 | 0.000 | 0.007 | 0.023 | |||||||||||||||||||||||||||||||||||||||||||||||||||||||||||||||||||||||||||||||||||||||||||||
| KEGG_SMALL_CELL_LUNG_CANCER | 84 | 0.592 | 2.124 | 0.000 | 0.008 | 0.029 | |||||||||||||||||||||||||||||||||||||||||||||||||||||||||||||||||||||||||||||||||||||||||||||
| KEGG_UBIQUITIN_MEDIATED_PROTEOLYSIS | 134 | 0.588 | 2.077 | 0.004 | 0.008 | 0.039 | |||||||||||||||||||||||||||||||||||||||||||||||||||||||||||||||||||||||||||||||||||||||||||||
| KEGG_NEUROTROPHIN_SIGNALING_PATHWAY | 126 | 0.548 | 2.072 | 0.002 | 0.008 | 0.044 | |||||||||||||||||||||||||||||||||||||||||||||||||||||||||||||||||||||||||||||||||||||||||||||
| KEGG_ADHERENS_JUNCTION | 73 | 0.614 | 2.082 | 0.000 | 0.008 | 0.038 | |||||||||||||||||||||||||||||||||||||||||||||||||||||||||||||||||||||||||||||||||||||||||||||
| KEGG_ENDOCYTOSIS | 181 | 0.508 | 2.058 | 0.000 | 0.008 | 0.051 | |||||||||||||||||||||||||||||||||||||||||||||||||||||||||||||||||||||||||||||||||||||||||||||
| KEGG_NON_SMALL_CELL_LUNG_CANCER | 54 | 0.617 | 2.153 | 0.000 | 0.009 | 0.023 | |||||||||||||||||||||||||||||||||||||||||||||||||||||||||||||||||||||||||||||||||||||||||||||
| KEGG_GLIOMA | 65 | 0.554 | 2.014 | 0.000 | 0.009 | 0.075 | |||||||||||||||||||||||||||||||||||||||||||||||||||||||||||||||||||||||||||||||||||||||||||||
| KEGG_TIGHT_JUNCTION | 132 | 0.500 | 2.016 | 0.002 | 0.009 | 0.072 | |||||||||||||||||||||||||||||||||||||||||||||||||||||||||||||||||||||||||||||||||||||||||||||
| KEGG_MAPK_SIGNALING_PATHWAY | 267 | 0.481 | 2.025 | 0.000 | 0.009 | 0.067 | |||||||||||||||||||||||||||||||||||||||||||||||||||||||||||||||||||||||||||||||||||||||||||||
| KEGG_REGULATION_OF_ACTIN_CYTOSKELETON | 213 | 0.518 | 2.047 | 0.000 | 0.009 | 0.055 | |||||||||||||||||||||||||||||||||||||||||||||||||||||||||||||||||||||||||||||||||||||||||||||
| KEGG_BASAL_TRANSCRIPTION_FACTORS | 35 | 0.675 | 2.026 | 0.002 | 0.009 | 0.066 | |||||||||||||||||||||||||||||||||||||||||||||||||||||||||||||||||||||||||||||||||||||||||||||
| KEGG_COLORECTAL_CANCER | 62 | 0.585 | 2.016 | 0.002 | 0.009 | 0.072 | |||||||||||||||||||||||||||||||||||||||||||||||||||||||||||||||||||||||||||||||||||||||||||||
| KEGG_MISMATCH_REPAIR | 23 | 0.804 | 2.001 | 0.002 | 0.009 | 0.085 | |||||||||||||||||||||||||||||||||||||||||||||||||||||||||||||||||||||||||||||||||||||||||||||
| KEGG_INSULIN_SIGNALING_PATHWAY | 137 | 0.502 | 2.026 | 0.002 | 0.009 | 0.065 | |||||||||||||||||||||||||||||||||||||||||||||||||||||||||||||||||||||||||||||||||||||||||||||
| KEGG_RNA_DEGRADATION | 59 | 0.654 | 2.031 | 0.002 | 0.009 | 0.063 | |||||||||||||||||||||||||||||||||||||||||||||||||||||||||||||||||||||||||||||||||||||||||||||
| KEGG_RENAL_CELL_CARCINOMA | 70 | 0.576 | 2.037 | 0.000 | 0.009 | 0.06 | |||||||||||||||||||||||||||||||||||||||||||||||||||||||||||||||||||||||||||||||||||||||||||||
| KEGG_INOSITOL_PHOSPHATE_METABOLISM | 54 | 0.583 | 1.978 | 0.002 | 0.012 | 0.102 | |||||||||||||||||||||||||||||||||||||||||||||||||||||||||||||||||||||||||||||||||||||||||||||
| KEGG_GAP_JUNCTION | 90 | 0.523 | 1.963 | 0.002 | 0.013 | 0.116 | |||||||||||||||||||||||||||||||||||||||||||||||||||||||||||||||||||||||||||||||||||||||||||||
| KEGG_SPLICEOSOME | 127 | 0.647 | 1.963 | 0.014 | 0.013 | 0.115 | |||||||||||||||||||||||||||||||||||||||||||||||||||||||||||||||||||||||||||||||||||||||||||||
| KEGG_ONE_CARBON_POOL_BY_FOLATE | 17 | 0.749 | 1.939 | 0.004 | 0.015 | 0.146 | |||||||||||||||||||||||||||||||||||||||||||||||||||||||||||||||||||||||||||||||||||||||||||||
| KEGG_FOCAL_ADHESION | 199 | 0.516 | 1.943 | 0.008 | 0.015 | 0.14 | |||||||||||||||||||||||||||||||||||||||||||||||||||||||||||||||||||||||||||||||||||||||||||||
| KEGG_DNA_REPLICATION | 36 | 0.819 | 1.948 | 0.004 | 0.015 | 0.137 | |||||||||||||||||||||||||||||||||||||||||||||||||||||||||||||||||||||||||||||||||||||||||||||
| KEGG_TGF_BETA_SIGNALING_PATHWAY | 85 | 0.542 | 1.910 | 0.008 | 0.017 | 0.176 | |||||||||||||||||||||||||||||||||||||||||||||||||||||||||||||||||||||||||||||||||||||||||||||
| KEGG_B_CELL_RECEPTOR_SIGNALING_PATHWAY | 75 | 0.560 | 1.914 | 0.012 | 0.017 | 0.172 | |||||||||||||||||||||||||||||||||||||||||||||||||||||||||||||||||||||||||||||||||||||||||||||
| KEGG_PURINE_METABOLISM | 157 | 0.478 | 1.919 | 0.002 | 0.017 | 0.166 | |||||||||||||||||||||||||||||||||||||||||||||||||||||||||||||||||||||||||||||||||||||||||||||
| KEGG_ENDOMETRIAL_CANCER | 52 | 0.569 | 1.914 | 0.002 | 0.018 | 0.171 | |||||||||||||||||||||||||||||||||||||||||||||||||||||||||||||||||||||||||||||||||||||||||||||
| KEGG_TYPE_II_DIABETES_MELLITUS | 47 | 0.556 | 1.897 | 0.002 | 0.018 | 0.186 | |||||||||||||||||||||||||||||||||||||||||||||||||||||||||||||||||||||||||||||||||||||||||||||
| KEGG_PROSTATE_CANCER | 89 | 0.521 | 1.920 | 0.000 | 0.018 | 0.165 | |||||||||||||||||||||||||||||||||||||||||||||||||||||||||||||||||||||||||||||||||||||||||||||
| KEGG_FC_GAMMA_R_MEDIATED_PHAGOCYTOSIS | 96 | 0.531 | 1.900 | 0.008 | 0.018 | 0.183 | |||||||||||||||||||||||||||||||||||||||||||||||||||||||||||||||||||||||||||||||||||||||||||||
| KEGG_WNT_SIGNALING_PATHWAY | 150 | 0.496 | 1.902 | 0.000 | 0.018 | 0.179 | |||||||||||||||||||||||||||||||||||||||||||||||||||||||||||||||||||||||||||||||||||||||||||||
| KEGG_PYRIMIDINE_METABOLISM | 98 | 0.538 | 1.872 | 0.008 | 0.021 | 0.214 | |||||||||||||||||||||||||||||||||||||||||||||||||||||||||||||||||||||||||||||||||||||||||||||
| KEGG_ARRHYTHMOGENIC_RIGHT_VENTRICULAR_CARDIOMYOPATHY_ARVC | 74 | 0.516 | 1.866 | 0.004 | 0.021 | 0.218 | |||||||||||||||||||||||||||||||||||||||||||||||||||||||||||||||||||||||||||||||||||||||||||||
| KEGG_THYROID_CANCER | 29 | 0.587 | 1.862 | 0.010 | 0.021 | 0.221 | |||||||||||||||||||||||||||||||||||||||||||||||||||||||||||||||||||||||||||||||||||||||||||||
| KEGG_RNA_POLYMERASE | 29 | 0.644 | 1.838 | 0.015 | 0.024 | 0.25 | |||||||||||||||||||||||||||||||||||||||||||||||||||||||||||||||||||||||||||||||||||||||||||||
| KEGG_PATHOGENIC_ESCHERICHIA_COLI_INFECTION | 56 | 0.557 | 1.840 | 0.012 | 0.024 | 0.249 | |||||||||||||||||||||||||||||||||||||||||||||||||||||||||||||||||||||||||||||||||||||||||||||
| KEGG_T_CELL_RECEPTOR_SIGNALING_PATHWAY | 108 | 0.529 | 1.834 | 0.004 | 0.024 | 0.256 | |||||||||||||||||||||||||||||||||||||||||||||||||||||||||||||||||||||||||||||||||||||||||||||
| KEGG_HOMOLOGOUS_RECOMBINATION | 28 | 0.696 | 1.841 | 0.022 | 0.024 | 0.247 | |||||||||||||||||||||||||||||||||||||||||||||||||||||||||||||||||||||||||||||||||||||||||||||
| KEGG_DILATED_CARDIOMYOPATHY | 90 | 0.498 | 1.844 | 0.006 | 0.024 | 0.245 | |||||||||||||||||||||||||||||||||||||||||||||||||||||||||||||||||||||||||||||||||||||||||||||
| KEGG_LYSINE_DEGRADATION | 44 | 0.567 | 1.812 | 0.027 | 0.027 | 0.287 | |||||||||||||||||||||||||||||||||||||||||||||||||||||||||||||||||||||||||||||||||||||||||||||
| KEGG_DORSO_VENTRAL_AXIS_FORMATION | 24 | 0.610 | 1.813 | 0.008 | 0.028 | 0.283 | |||||||||||||||||||||||||||||||||||||||||||||||||||||||||||||||||||||||||||||||||||||||||||||
| KEGG_MELANOGENESIS | 101 | 0.471 | 1.805 | 0.008 | 0.028 | 0.297 | |||||||||||||||||||||||||||||||||||||||||||||||||||||||||||||||||||||||||||||||||||||||||||||
| KEGG_ACUTE_MYELOID_LEUKEMIA | 57 | 0.518 | 1.799 | 0.016 | 0.029 | 0.299 | |||||||||||||||||||||||||||||||||||||||||||||||||||||||||||||||||||||||||||||||||||||||||||||
| KEGG_ECM_RECEPTOR_INTERACTION | 84 | 0.541 | 1.777 | 0.016 | 0.031 | 0.324 | |||||||||||||||||||||||||||||||||||||||||||||||||||||||||||||||||||||||||||||||||||||||||||||
| KEGG_ADIPOCYTOKINE_SIGNALING_PATHWAY | 67 | 0.486 | 1.779 | 0.010 | 0.032 | 0.322 | |||||||||||||||||||||||||||||||||||||||||||||||||||||||||||||||||||||||||||||||||||||||||||||
| KEGG_MTOR_SIGNALING_PATHWAY | 52 | 0.482 | 1.781 | 0.020 | 0.032 | 0.32 | |||||||||||||||||||||||||||||||||||||||||||||||||||||||||||||||||||||||||||||||||||||||||||||
| KEGG_PHOSPHATIDYLINOSITOL_SIGNALING_SYSTEM | 76 | 0.496 | 1.766 | 0.006 | 0.033 | 0.337 | |||||||||||||||||||||||||||||||||||||||||||||||||||||||||||||||||||||||||||||||||||||||||||||
| KEGG_NOTCH_SIGNALING_PATHWAY | 47 | 0.519 | 1.755 | 0.012 | 0.034 | 0.352 | |||||||||||||||||||||||||||||||||||||||||||||||||||||||||||||||||||||||||||||||||||||||||||||
| KEGG_BASAL_CELL_CARCINOMA | 55 | 0.537 | 1.755 | 0.012 | 0.034 | 0.352 | |||||||||||||||||||||||||||||||||||||||||||||||||||||||||||||||||||||||||||||||||||||||||||||
| KEGG_TOLL_LIKE_RECEPTOR_SIGNALING_PATHWAY | 102 | 0.491 | 1.757 | 0.028 | 0.035 | 0.351 | |||||||||||||||||||||||||||||||||||||||||||||||||||||||||||||||||||||||||||||||||||||||||||||
| KEGG_LONG_TERM_POTENTIATION | 70 | 0.476 | 1.747 | 0.014 | 0.035 | 0.364 | |||||||||||||||||||||||||||||||||||||||||||||||||||||||||||||||||||||||||||||||||||||||||||||
| KEGG_BLADDER_CANCER | 42 | 0.494 | 1.729 | 0.016 | 0.039 | 0.387 | |||||||||||||||||||||||||||||||||||||||||||||||||||||||||||||||||||||||||||||||||||||||||||||
| KEGG_PROXIMAL_TUBULE_BICARBONATE_RECLAMATION | 23 | 0.575 | 1.725 | 0.012 | 0.040 | 0.393 | |||||||||||||||||||||||||||||||||||||||||||||||||||||||||||||||||||||||||||||||||||||||||||||
| KEGG_CYTOSOLIC_DNA_SENSING_PATHWAY | 54 | 0.503 | 1.722 | 0.028 | 0.040 | 0.401 | |||||||||||||||||||||||||||||||||||||||||||||||||||||||||||||||||||||||||||||||||||||||||||||
| KEGG_NUCLEOTIDE_EXCISION_REPAIR | 44 | 0.607 | 1.710 | 0.035 | 0.043 | 0.424 | |||||||||||||||||||||||||||||||||||||||||||||||||||||||||||||||||||||||||||||||||||||||||||||
| KEGG_ALANINE_ASPARTATE_AND_GLUTAMATE_METABOLISM | 30 | 0.500 | 1.696 | 0.010 | 0.045 | 0.444 | |||||||||||||||||||||||||||||||||||||||||||||||||||||||||||||||||||||||||||||||||||||||||||||
| KEGG_MELANOMA | 71 | 0.449 | 1.697 | 0.015 | 0.046 | 0.439 | |||||||||||||||||||||||||||||||||||||||||||||||||||||||||||||||||||||||||||||||||||||||||||||
| KEGG_PYRUVATE_METABOLISM | 40 | 0.516 | 1.685 | 0.029 | 0.046 | 0.466 | |||||||||||||||||||||||||||||||||||||||||||||||||||||||||||||||||||||||||||||||||||||||||||||
| KEGG_SELENOAMINO_ACID_METABOLISM | 25 | 0.539 | 1.688 | 0.031 | 0.047 | 0.466 | |||||||||||||||||||||||||||||||||||||||||||||||||||||||||||||||||||||||||||||||||||||||||||||
| KEGG_JAK_STAT_SIGNALING_PATHWAY | 155 | 0.428 | 1.685 | 0.026 | 0.047 | 0.466 | |||||||||||||||||||||||||||||||||||||||||||||||||||||||||||||||||||||||||||||||||||||||||||||
| KEGG_REGULATION_OF_AUTOPHAGY | 35 | 0.499 | 1.673 | 0.026 | 0.049 | 0.489 | |||||||||||||||||||||||||||||||||||||||||||||||||||||||||||||||||||||||||||||||||||||||||||||
| KEGG_HYPERTROPHIC_CARDIOMYOPATHY_HCM | 83 | 0.451 | 1.675 | 0.015 | 0.049 | 0.486 | |||||||||||||||||||||||||||||||||||||||||||||||||||||||||||||||||||||||||||||||||||||||||||||
| * SIZE indicates the number of genes in the gene set; ES represents enrichment score; NES represents normalized enrichment score; NOM p-val represents nominal p value; FDRq-val represents false discovery rate; FWERp-val is Family-wise error rate. | |||||||||||||||||||||||||||||||||||||||||||||||||||||||||||||||||||||||||||||||||||||||||||||||||||
Discussion
lncRNA has been shown to play an important role in the development and progression of tumors, including EC [36], and can be used as a biomarker for the diagnosis, prognosis, and potential therapeutic targets in various cancers. Recent studies of lncRNAs have identified that many are involved in the regulation of autophagy in tumors, and that most autophagy-related lncRNAs affect the occurrence and development of tumors [37]. Therefore, autophagy-related lncRNAs are a potential and promising target for tumor treatments and prognosis evaluations. Zhou et al. developed a signature based on 13 autophagy-related lncRNAs that could serve as an independent prognosis indicator for lung adenocarcinoma [38], and Luan et al. identified 10 prognostic autophagy-related lncRNAs and validated an autophagy-related-lncRNA-based index for predicting the OS in glioma [39]. However, the prognostic significance of autophagy-related lncRNAs in EC has not been reported previously.
The present study collected expression data of lncRNAs and autophagy-related genes of EC patients in the TCGA database, and evaluated the correlations between lncRNAs and autophagy-related genes using Pearson correlation analysis in order to identify autophagy-related lncRNAs. The obtained samples were randomly divided into training and testing data sets at the proportion of 7:3. In the training data set, we constructed a novel autophagy-related lncRNA prognosis signature using univariate and multivariate Cox regression analyses. After dividing the EC patients into high- and low-risk groups, those in the high-risk group had a worse OS. In addition, our signature was found to be a more-effective independent prognostic factor for EC compared with traditional clinical prognostic factors, and have a good AUC (i.e., higher prognosis resolution). This study also analyzed the relationships between the autophagy-related lncRNA prognosis signature and clinical features, with the results showing that the risk score for the signature tended to increase at higher levels, suggesting that the signature reflects the progression of EC.
Our signature indicates that EC patients with high expression levels of AC005229.4, BX322234.1, and FIRRE have worse survival, while those with high expression levels of RAB11B-AS1 and AC003102.1 have better survival. RAB11B-AS1 can inhibit the development of osteosarcoma via its natural antisense transcript RAB11B, and its low expression level is associated with a poor prognosis of osteosarcoma patients [40]. Shi et al. found that FIRRE lncRNA was overexpressed in diffuse large-B-cell lymphoma (DLBCL) tissue and cells. FIRRE lncRNA can promote the proliferation of tumor cells, reduce cell apoptosis, and is associated with poor OS in DLBCL patients [41]. However, there have been no previous reports on the other three lncRNAs identified in the present study: AC005229.4, BX322234.1, and AC003102.1.
Our GSEA also showed that cancer-related pathways were significantly enriched in the high-risk group, including those related to pancreatic cancer, small-cell lung cancer, EC, cancer, ErbB signaling, MAPK, and other common cancers [42, 43]. Moreover, the autophagy-related signaling pathways were also enriched in the high-risk group. This suggests that the five autophagy-related lncRNAs that we have identified are related to the occurrence and development of EC.
This study was subject to some limitations. First, all of the analyzed data were collected from the TCGA database, and so our novel signature needs to be further validated in other prospective cohorts in order to ensure its robustness. Second, the potential and molecular correlations between our autophagy-related lncRNAs and autophagy need to be studied further. Third, the role and mechanism of these autophagy-related lncRNAs in EC also need to be further validated.
In summary, we have constructed an autophagy–lncRNA coexpression network to explore the molecular markers related to the progression and prognosis of EC, and have developed a signature based on five autophagy-related lncRNAs that has independent prognostic value for EC patients.
Materials and Methods
Collection of data on EC patients
The transcriptome profiling data of EC and corresponding clinical information were extracted from the TCGA database at https://portal.gdc.cancer.gov/. The EC data set totaled 552 tumor samples, with clinical follow-up data being available for 528 of the samples. We randomly divided EC patients with clinical follow-up data at the proportion of 7:3 into a training data set (n=372) and a testing data set (n=156). The training data set was used to identify autophagy-related lncRNAs related to the prognosis of EC and to establish a prognosis signature, whose validity and stability were verified in the testing data set (Table 4).
Table 4. Clinical characteristics of EC patients from each database.
| Characteristics | Training dataset (n=372) | Testing dataset (n=156) | Entire dataset (n=528) | P-value | |||
| n | % | n | % | n | % | ||
| Age (year) | 0.902 | ||||||
| ≤60 | 140 | 37.63% | 62 | 39.74% | 202 | 38.26% | |
| >60 | 232 | 62.37% | 94 | 60.26% | 326 | 61.74% | |
| FIGO stage | |||||||
| I | 234 | 62.90% | 98 | 62.82% | 332 | 62.88% | 0.967 |
| II | 33 | 8.87% | 18 | 11.54% | 51 | 9.66% | |
| III | 85 | 22.85% | 34 | 21.79% | 119 | 22.54% | |
| IV | 20 | 5.38% | 6 | 3.85% | 26 | 4.92% | |
| Histological type | 0.194 | ||||||
| Endometrioid | 292 | 78.49% | 111 | 71.15% | 403 | 76.33% | |
| Mixed and serous | 80 | 21.51% | 45 | 28.85% | 125 | 23.67% | |
| Tumor grade | 0.198 | ||||||
| G1 | 73 | 19.62% | 25 | 16.02% | 98 | 18.56% | |
| G2 | 93 | 25.00% | 27 | 17.31% | 120 | 22.73% | |
| G3 | 206 | 55.38% | 104 | 66.67% | 310 | 58.71% | |
Gene set enrichment analysis
Gene set enrichment analysis (GSEA) was applied to the high- and low-risk groups of the autophagy-related lncRNA prognosis signature. This study verified whether the genes that were differentially expressed between the two groups are enriched during autophagy. In addition, we analyzed whether the autophagy pathway was enriched in the GSEA high-risk group.
Statistical analysis
Statistical analyses were implemented using R software (version 3.6.2). Pearson correlation analysis was used to evaluate the correlations between autophagy genes and lncRNA. Survival analysis was performed by the K-M method, with the log-rank test used for comparisons. The ROC curve analysis was performed using the survivalROC package, while Cytoscape software (version 3.71) was used to construct an autophagy–lncRNA coexpression network. The Gene Set Enrichment Analysis software (version 4.0.3) was used for the GSEA.
Author Contributions
WXF designed the study, collected and preliminary analyzed data. DCY, YMQ, WJY and LWZ interpreted the data; WXF and DCY drafted the manuscripts. LRM was in charge of the entire study. The final draft was read and approved by all authors.
Acknowledgments
We would like to acknowledge TCGA and the Human Autophagy Database for free use.
Conflicts of Interest
The authors declare that there are no conflicts of interest.
References
- 1. Siegel RL, Miller KD, Jemal A. Cancer statistics, 2020. CA Cancer J Clin. 2020; 70:7–30. https://doi.org/10.3322/caac.21590 [PubMed]
- 2. Lee YC, Lheureux S, Oza AM. Treatment strategies for endometrial cancer: current practice and perspective. Curr Opin Obstet Gynecol. 2017; 29:47–58. https://doi.org/10.1097/GCO.0000000000000338 [PubMed]
- 3. Lavaud P, Fedida B, Canlorbe G, Bendifallah S, Darai E, Thomassin-Naggara I. Preoperative MR imaging for ESMO-ESGO-ESTRO classification of endometrial cancer. Diagn Interv Imaging. 2018; 99:387–96. https://doi.org/10.1016/j.diii.2018.01.010 [PubMed]
- 4. Ørtoft G, Lausten-Thomsen L, Høgdall C, Hansen ES, Dueholm M. Lymph-vascular space invasion (LVSI) as a strong and independent predictor for non-locoregional recurrences in endometrial cancer: a Danish gynecological cancer group study. J Gynecol Oncol. 2019; 30:e84. https://doi.org/10.3802/jgo.2019.30.e84 [PubMed]
- 5. Wan-Nor-Asyikeen WA, Siti-Azrin AH, Jalil NA, Othman NH, Zain AA. Endometrial cancer in hospital Universiti Sains Malaysia. Asian Pac J Cancer Prev. 2016; 17:2867–70. [PubMed]
- 6. Bendifallah S, Canlorbe G, Collinet P, Arsène E, Huguet F, Coutant C, Hudry D, Graesslin O, Raimond E, Touboul C, Daraï E, Ballester M. Just how accurate are the major risk stratification systems for early-stage endometrial cancer? Br J Cancer. 2015; 112:793–801. https://doi.org/10.1038/bjc.2015.35 [PubMed]
- 7. Murali R, Delair DF, Bean SM, Abu-Rustum NR, Soslow RA. Evolving roles of histologic evaluation and molecular/genomic profiling in the management of endometrial cancer. J Natl Compr Canc Netw. 2018; 16:201–09. https://doi.org/10.6004/jnccn.2017.7066 [PubMed]
- 8. Parzych KR, Klionsky DJ. An overview of autophagy: morphology, mechanism, and regulation. Antioxid Redox Signal. 2014; 20:460–73. https://doi.org/10.1089/ars.2013.5371 [PubMed]
- 9. Turcotte S, Giaccia AJ. Targeting cancer cells through autophagy for anticancer therapy. Curr Opin Cell Biol. 2010; 22:246–51. https://doi.org/10.1016/j.ceb.2009.12.007 [PubMed]
- 10. Li X, He S, Ma B. Autophagy and autophagy-related proteins in cancer. Mol Cancer. 2020; 19:12. https://doi.org/10.1186/s12943-020-1138-4 [PubMed]
- 11. White E, Karp C, Strohecker AM, Guo Y, Mathew R. Role of autophagy in suppression of inflammation and cancer. Curr Opin Cell Biol. 2010; 22:212–17. https://doi.org/10.1016/j.ceb.2009.12.008 [PubMed]
- 12. Amaravadi R, Kimmelman AC, White E. Recent insights into the function of autophagy in cancer. Genes Dev. 2016; 30:1913–30. https://doi.org/10.1101/gad.287524.116 [PubMed]
- 13. Levy JM, Towers CG, Thorburn A. Targeting autophagy in cancer. Nat Rev Cancer. 2017; 17:528–42. https://doi.org/10.1038/nrc.2017.53 [PubMed]
- 14. Sui X, Chen R, Wang Z, Huang Z, Kong N, Zhang M, Han W, Lou F, Yang J, Zhang Q, Wang X, He C, Pan H. Autophagy and chemotherapy resistance: a promising therapeutic target for cancer treatment. Cell Death Dis. 2013; 4:e838. https://doi.org/10.1038/cddis.2013.350 [PubMed]
- 15. Orfanelli T, Jeong JM, Doulaveris G, Holcomb K, Witkin SS. Involvement of autophagy in cervical, endometrial and ovarian cancer. Int J Cancer. 2014; 135:519–28. https://doi.org/10.1002/ijc.28524 [PubMed]
- 16. Giatromanolaki A, Koukourakis MI, Koutsopoulos A, Chloropoulou P, Liberis V, Sivridis E. High beclin 1 expression defines a poor prognosis in endometrial adenocarcinomas. Gynecol Oncol. 2011; 123:147–51. https://doi.org/10.1016/j.ygyno.2011.06.023 [PubMed]
- 17. Deng L, Broaddus RR, McCampbell A, Shipley GL, Loose DS, Stancel GM, Pickar JH, Davies PJ. Identification of a novel estrogen-regulated gene, EIG121, induced by hormone replacement therapy and differentially expressed in type I and type II endometrial cancer. Clin Cancer Res. 2005; 11:8258–64. https://doi.org/10.1158/1078-0432.CCR-05-1189 [PubMed]
- 18. Felip I, Moiola CP, Megino-Luque C, Lopez-Gil C, Cabrera S, Solé-Sánchez S, Muñoz-Guardiola P, Megias-Roda E, Pérez-Montoyo H, Alfon J, Yeste-Velasco M, Santacana M, Dolcet X, et al. Therapeutic potential of the new TRIB3-mediated cell autophagy anticancer drug ABTL0812 in endometrial cancer. Gynecol Oncol. 2019; 153:425–35. https://doi.org/10.1016/j.ygyno.2019.03.002 [PubMed]
- 19. Kondo Y, Kanzawa T, Sawaya R, Kondo S. The role of autophagy in cancer development and response to therapy. Nat Rev Cancer. 2005; 5:726–34. https://doi.org/10.1038/nrc1692 [PubMed]
- 20. Fukuda T, Oda K, Wada-Hiraike O, Sone K, Inaba K, Ikeda Y, Miyasaka A, Kashiyama T, Tanikawa M, Arimoto T, Kuramoto H, Yano T, Kawana K, et al. The anti-malarial chloroquine suppresses proliferation and overcomes cisplatin resistance of endometrial cancer cells via autophagy inhibition. Gynecol Oncol. 2015; 137:538–45. https://doi.org/10.1016/j.ygyno.2015.03.053 [PubMed]
- 21. Ponting CP, Oliver PL, Reik W. Evolution and functions of long noncoding RNAs. Cell. 2009; 136:629–41. https://doi.org/10.1016/j.cell.2009.02.006 [PubMed]
- 22. Kornienko AE, Guenzl PM, Barlow DP, Pauler FM. Gene regulation by the act of long non-coding RNA transcription. BMC Biol. 2013; 11:59. https://doi.org/10.1186/1741-7007-11-59 [PubMed]
- 23. Liao K, Xu J, Yang W, You X, Zhong Q, Wang X. The research progress of LncRNA involved in the regulation of inflammatory diseases. Mol Immunol. 2018; 101:182–88. https://doi.org/10.1016/j.molimm.2018.05.030 [PubMed]
- 24. Beermann J, Piccoli MT, Viereck J, Thum T. Non-coding RNAs in development and disease: background, mechanisms, and therapeutic approaches. Physiol Rev. 2016; 96:1297–325. https://doi.org/10.1152/physrev.00041.2015 [PubMed]
- 25. Peng WX, Koirala P, Mo YY. LncRNA-mediated regulation of cell signaling in cancer. Oncogene. 2017; 36:5661–67. https://doi.org/10.1038/onc.2017.184 [PubMed]
- 26. Chi Y, Wang D, Wang J, Yu W, Yang J. Long Non-Coding RNA in the Pathogenesis of Cancers. Cells. 2019; 8:1015. https://doi.org/10.3390/cells8091015 [PubMed]
- 27. Liu H, Wan J, Chu J. Long non-coding RNAs and endometrial cancer. Biomed Pharmacother. 2019; 119:109396. https://doi.org/10.1016/j.biopha.2019.109396 [PubMed]
- 28. Dong P, Xiong Y, Yue J, J B Hanley S, Kobayashi N, Todo Y, Watari H. Exploring lncRNA-mediated regulatory networks in endometrial cancer cells and the tumor microenvironment: advances and challenges. Cancers (Basel). 2019; 11:234. https://doi.org/10.3390/cancers11020234 [PubMed]
- 29. Barangi S, Hayes AW, Reiter R, Karimi G. The therapeutic role of long non-coding RNAs in human diseases: a focus on the recent insights into autophagy. Pharmacol Res. 2019; 142:22–29. https://doi.org/10.1016/j.phrs.2019.02.010 [PubMed]
- 30. Zhang J, Wang P, Wan L, Xu S, Pang D. The emergence of noncoding RNAs as heracles in autophagy. Autophagy. 2017; 13:1004–24. https://doi.org/10.1080/15548627.2017.1312041 [PubMed]
- 31. Yao H, Han B, Zhang Y, Shen L, Huang R. Non-coding RNAs and autophagy. Adv Exp Med Biol. 2019; 1206:199–220. https://doi.org/10.1007/978-981-15-0602-4_10 [PubMed]
- 32. Ma B, Yuan Z, Zhang L, Lv P, Yang T, Gao J, Pan N, Wu Q, Lou J, Han C, Zhang B. Long non-coding RNA AC023115.3 suppresses chemoresistance of glioblastoma by reducing autophagy. Biochim Biophys Acta Mol Cell Res. 2017; 1864:1393–404. https://doi.org/10.1016/j.bbamcr.2017.05.008 [PubMed]
- 33. Li L, Chen H, Gao Y, Wang YW, Zhang GQ, Pan SH, Ji L, Kong R, Wang G, Jia YH, Bai XW, Sun B. Long noncoding RNA MALAT1 promotes aggressive pancreatic cancer proliferation and metastasis via the stimulation of autophagy. Mol Cancer Ther. 2016; 15:2232–43. https://doi.org/10.1158/1535-7163.MCT-16-0008 [PubMed]
- 34. Xiu YL, Sun KX, Chen X, Chen S, Zhao Y, Guo QG, Zong ZH. Upregulation of the lncRNA Meg3 induces autophagy to inhibit tumorigenesis and progression of epithelial ovarian carcinoma by regulating activity of ATG3. Oncotarget. 2017; 8:31714–25. https://doi.org/10.18632/oncotarget.15955 [PubMed]
- 35. Sun MY, Zhu JY, Zhang CY, Zhang M, Song YN, Rahman K, Zhang LJ, Zhang H. Autophagy regulated by lncRNA HOTAIR contributes to the cisplatin-induced resistance in endometrial cancer cells. Biotechnol Lett. 2017; 39:1477–84. https://doi.org/10.1007/s10529-017-2392-4 [PubMed]
- 36. Chen X, Yan GY. Novel human lncRNA-disease association inference based on lncRNA expression profiles. Bioinformatics. 2013; 29:2617–24. https://doi.org/10.1093/bioinformatics/btt426 [PubMed]
- 37. Yang L, Wang H, Shen Q, Feng L, Jin H. Long non-coding RNAs involved in autophagy regulation. Cell Death Dis. 2017; 8:e3073. https://doi.org/10.1038/cddis.2017.464 [PubMed]
- 38. Zhou M, Shao W, Dai H, Zhu X. A robust signature based on autophagy-associated LncRNAs for predicting prognosis in lung adenocarcinoma. Biomed Res Int. 2020; 2020:3858373. https://doi.org/10.1155/2020/3858373 [PubMed]
- 39. Luan F, Chen W, Chen M, Yan J, Chen H, Yu H, Liu T, Mo L. An autophagy-related long non-coding RNA signature for glioma. FEBS Open Bio. 2019; 9:653–67. https://doi.org/10.1002/2211-5463.12601 [PubMed]
- 40. Chen Z, Liu Z, Yang Y, Zhu Z, Liang R, Huang B, Wu D, Yang L, Lu H, Jin D, Li Q. Long non-coding RNA RAB11B-AS1 prevents osteosarcoma development and progression via its natural antisense transcript RAB11B. Oncotarget. 2018; 9:26770–86. https://doi.org/10.18632/oncotarget.24247 [PubMed]
- 41. Shi X, Cui Z, Liu X, Wu S, Wu Y, Fang F, Zhao H. LncRNA FIRRE is activated by MYC and promotes the development of diffuse large B-cell lymphoma via Wnt/β-catenin signaling pathway. Biochem Biophys Res Commun. 2019; 510:594–600. https://doi.org/10.1016/j.bbrc.2019.01.105 [PubMed]
- 42. Arteaga CL, Engelman JA. ERBB receptors: from oncogene discovery to basic science to mechanism-based cancer therapeutics. Cancer Cell. 2014; 25:282–303. https://doi.org/10.1016/j.ccr.2014.02.025 [PubMed]
- 43. Donohoe F, Wilkinson M, Baxter E, Brennan DJ. Mitogen-activated protein kinase (MAPK) and obesity-related cancer. Int J Mol Sci. 2020; 21:1241. https://doi.org/10.3390/ijms21041241 [PubMed]