


Introduction
Head and neck cancer (HNC) is the sixth most common cancer worldwide, with nearly 600,000 new cases diagnosed annually [1, 2]. The most common type of HNC is squamous cell carcinoma (SCC), which arises from the stratified epithelium of oral cavity, nasopharynx, hypopharynx, oropharynx, or larynx [3]. The anatomy of the head and neck is complex and tumors arising from different sites of this region demonstrate unique histology, phenotype, tumorigenicity, and invasive properties [4]. Despite rapid advances in surgery and adjuvant therapy, the 5-year overall survival rate of HNC patients is approximately 50% [5]. Higher rates of local recurrence, secondary tumors, and distant metastasis contribute to increased mortality of HNC patients [6].
In normal healthy cells, glucose is oxidized completely to CO2 through the mitochondrial respiratory chain in the presence of oxygen to generate significant amounts of ATP or converted to lactic acid via glycolysis in oxygen-deficient conditions [7]. In the early 1900s, Otto Warburg discovered that cancer cells resort to the use of glycolysis as a way to generate ATP even when the oxygen is sufficient [8]. Aerobic glycolysis is extensively involved in the development and progression of most cancers, including head and neck squamous cell carcinoma (HNSCC).
Glucose transporter 1 (GLUT1), monocarboxylate transporter 4 (MCT4), hexokinase 2 (HK2), pyruvate kinase M2 (PKM2) and glucose transporter 4 (GLUT4) are key enzymes that regulate the rate of glycolysis [9–11]. GLUTs are mainly responsible for glucose uptake into cells [9]. MCT4 is typically involved in exporting excessive lactate out of the cells [10]. Hexokinases (HKs) catalyze the first step of glycolysis, which involves phosphorylation of glucose into glucose-6-phosphate [11]. Pyruvate kinase catalyzes the last step of glycolysis, during which the high-energy phosphate group is transferred to form Pyruvate and produce ATP [7]. These glycolytic enzymes play vital roles in several human cancers, and regulate proliferation, metastasis, and chemoresistance of cancer cells [9, 11–13]. Several studies have evaluated the prognostic roles of GLUT1, MCT4, HK2, PKM2 and GLUT4 in HNSCC, but the results are conflicting [14–41].
In this study, we performed systematic meta-analysis to evaluate the prognostic significance of glycolysis markers, namely, GLUT1, MCT4, HK2, PKM2, and GLUT4 in HNSCC.
Results
Study characteristics
The literature selection process is shown in Figure 1. The characteristics of included studies are listed in Table 1. We included 28 research articles published between the years 2000 and 2020 for the meta-analysis. These included 37 studies and 3272 patients. The quality of the included studies was assessed using Newcastle-Ottawa Scale (NOS) (Supplementary Table 1). Nineteen studies were conducted in Asia, whereas, the remaining studies were conducted in North and South America (n=7) and Europe (n=11). Majority of the studies assessed GLUT1 (n=19), whereas, the remaining studies assessed GLUT4 (n=4), MCT4 (n=4), HK2 (n=6), and PKM2 (n=4). The sample size of these studies varied from 33 to 274 HNSCC patients. Based on the median sample size, 18 studies were defined as large sample size studies (n>71) and the remaining 19 studies were defined as small size studies (n≤71). The prognostic value of specific glycolysis markers was investigated by evaluating overall survival (OS) in 21 studies, disease-free survival (DFS) in 9 studies, recurrence-free survival (RFS) in 3 studies, disease-specific survival (DSS) in 2 studies, and distant metastasis- free survival (DMFS) in 2 studies.
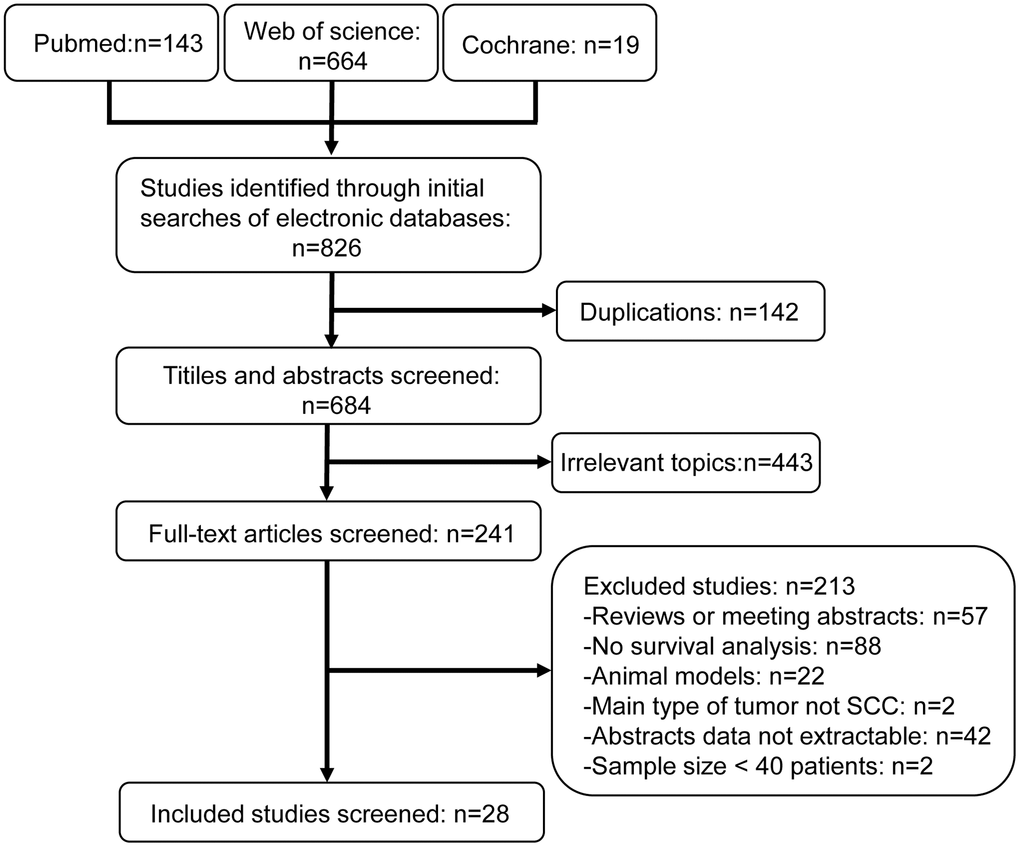
Figure 1. Flow diagram shows selection strategy of studies included in this meta-analysis.
Table 1. Characteristics of included studies.
| Author year | Glycolysis marker | Country | Ethnicity | Tumor location | Follow-up (months) | Sample size | Gender (M/F) | Detection method | TNM stage | Cut-off value | Outcome | HR [95% CI] | Study design | NOS score | |||||||||||||||||||||||||||||||||||||||||||||||||||||||||||||||||||||||||||||||||||||
| Ayala 2010[14] | GLUT1 | Brazil | Caucasian | OSCC | 64.9(0.03-157.6) | 142 | 112/30 | TMA IHC | I-IV | ≥10% | OS | 2.07[1.23-3.46] | P | 7 | |||||||||||||||||||||||||||||||||||||||||||||||||||||||||||||||||||||||||||||||||||||
| Baschnagel 2015[35] | GLUT1 HK2 | America | Caucasian | HNSCC | 35(1-93) | 97 | NA | IHC | I-IV | GLUT1:Score=3(0-3) HK2:Score≥1(0-3) | DFS | 2.13[0.86-5.28] 1.01[0.50-2.05] | P | 7 | |||||||||||||||||||||||||||||||||||||||||||||||||||||||||||||||||||||||||||||||||||||
| Brockton 2011[15] | GLUT1 | Canada | Caucasian | HNSCC | NA | 47 | 37/10 | TMA IHC | II-IV | NA | OS | 1.21[0.22-6.65] | P | 6 | |||||||||||||||||||||||||||||||||||||||||||||||||||||||||||||||||||||||||||||||||||||
| Chang 2017[16] | GLUT4 | China | Asian | HNSCC | 190 | 90 | 81/9 | IHC | I-IV | Score≥2(0-3) | OS RFS | 3.31[1.28-8.55] 3.76[1.76-8.03] | P | 8 | |||||||||||||||||||||||||||||||||||||||||||||||||||||||||||||||||||||||||||||||||||||
| Choi 2007[31] | GLUT1 | Korea | Asian | OSCC | 4.10-117.13 | 60 | 40/20 | IHC | I-IV | ≥60% | OS DFS | 1.70[0.63-4.62] 1.62[0.78-3.34] | P | 7 | |||||||||||||||||||||||||||||||||||||||||||||||||||||||||||||||||||||||||||||||||||||
| Curry 2013[36] | MCT4 | America | Caucasian | OSCC | 45(2.8-94.9) | 42 | 27/15 | IHC | I-IV | ≥25% | DFS | 10.36[2.56-41.94] | P | 7 | |||||||||||||||||||||||||||||||||||||||||||||||||||||||||||||||||||||||||||||||||||||
| Deron 2011[38] | GLUT4 | Belgium | Caucasian | TTSCC | 49(1-123) | 71 | 62/9 | IHC | I-IV | Score≥2(0-15) | OS DFS | 1.08[0.41-2.89] 0.78[0.32-1.92] | P | 7 | |||||||||||||||||||||||||||||||||||||||||||||||||||||||||||||||||||||||||||||||||||||
| Eckert 2008[32] | GLUT1 | Germany | Caucasian | OSCC | 60 | 42 | 33/9 | IHC | I-IV | Score≥6(0-12) | OS | 5.05[2.05-12.45] | P | 7 | |||||||||||||||||||||||||||||||||||||||||||||||||||||||||||||||||||||||||||||||||||||
| Eckert 2011[40] | GLUT1 | Germany | Caucasian | OSCC | 44.3 | 82 | 60/22 | IHC | I-IV | Score≥9(0-12) | DSS | 1.76[0.78-3.93] | P | 7 | |||||||||||||||||||||||||||||||||||||||||||||||||||||||||||||||||||||||||||||||||||||
| Grimm 2014[37] | GLUT1 | Germany | Caucasian | OSCC | 52.26(46.21-58.31) | 161 | 122/39 | IHC | I-IV | Score≥1(0-9) | DFS | 0.29[0.04-2.32] | P | 8 | |||||||||||||||||||||||||||||||||||||||||||||||||||||||||||||||||||||||||||||||||||||
| Han 2012[17] | GLUT1 | Korea | Asian | OSCC | 40(9-113) | 33 | 20/13 | IHC | II | >10% | DFS OS | 1.16[0.14-9.61] 12.46[0.67-231.55] | P | 5 | |||||||||||||||||||||||||||||||||||||||||||||||||||||||||||||||||||||||||||||||||||||
| Jonathan 2006[41] | GLUT1 | Netherlands | Caucasian | HNSCC | 61.2 | 58 | 43/15 | IHC | I-IV | Score≥2(0-3) | DMFS | 4.67[0.33-65.13] | P | 8 | |||||||||||||||||||||||||||||||||||||||||||||||||||||||||||||||||||||||||||||||||||||
| Krupar 2017[19] | GLUT1 | Germany | Caucasian | HNSCC | 60 | 73 | 67/7 | IHC | II-IV | NA | OS | 1.75[1.01-3.04] | P | 6 | |||||||||||||||||||||||||||||||||||||||||||||||||||||||||||||||||||||||||||||||||||||
| Kunkel 2003[33] | GLUT1 | Germany | Caucasian | OSCC | 74(1-172) | 118 | 88/30 | IHC | I-IV | ≥50% | OS | 2.65[1.24-5.65] | P | 7 | |||||||||||||||||||||||||||||||||||||||||||||||||||||||||||||||||||||||||||||||||||||
| Kunkel 2007[34] | GLUT1 | Germany | Caucasian | OSCC | 62(25-106) | 40 | 33/7 | IHC | I-IV | NA | OS | 5.12[1.12-23.40] | P | 6 | |||||||||||||||||||||||||||||||||||||||||||||||||||||||||||||||||||||||||||||||||||||
| Oliver 2004[39] | GLUT1 | UK | Caucasian | OSCC | 60-72 | 54 | 36/18 | IHC | NA | Score≥2(0-3) | RFS | 2.66[0.56-12.78] | P | 6 | |||||||||||||||||||||||||||||||||||||||||||||||||||||||||||||||||||||||||||||||||||||
| Swartz 2016[18] | GLUT1 | Netherlands | Caucasian | Oropharyngeal SCC | 35(15.8-67) | 274 | 190/84 | TMA IHC | I-IV | >6% | OS | 1.50[1.05-2.15] | P | 7 | |||||||||||||||||||||||||||||||||||||||||||||||||||||||||||||||||||||||||||||||||||||
| Sweeny 2012[20] | MCT4 | America | Caucasian | cSCC of the head and neck | NA | 50 | 43/7 | IF | III-IV | >50% | DSS | 2.42[0.48-12.33] | P | 7 | |||||||||||||||||||||||||||||||||||||||||||||||||||||||||||||||||||||||||||||||||||||
| Wang 2015[21] | PKM2 | China | Asian | OSCC | 51.4(3-78) | 111 | 60/61 | IHC | I-IV | Score≥4(0-12) | OS DFS | 3.12[1.66-5.85] 2.53[1.01-6.37] | P | 7 | |||||||||||||||||||||||||||||||||||||||||||||||||||||||||||||||||||||||||||||||||||||
| Wang 2017-1[22] | HK2 | China | Asian | OSCC | 71.3 | 137 | 89/48 | IHC | I-IV | Score>4(0-9) | OS | 2.15[1.07-4.31] | P | 7 | |||||||||||||||||||||||||||||||||||||||||||||||||||||||||||||||||||||||||||||||||||||
| Wang 2017-2[23] | PKM2 | China | Asian | OSCC | 67 | 137 | 89/48 | IHC | I-IV | Score>4(0-9) | OS | 2.15[1.02-4.52] | P | 7 | |||||||||||||||||||||||||||||||||||||||||||||||||||||||||||||||||||||||||||||||||||||
| Wu 2013[24] | GLUT1 | China | Asian | LSCC | 42.6(13-181) | 49 | 43/6 | IHC | I-IV | >10% | OS | 3.46[0.73-16.25] | P | 7 | |||||||||||||||||||||||||||||||||||||||||||||||||||||||||||||||||||||||||||||||||||||
| Xiao 2014[25] | HK2 | America | Caucasian | NPC | 69.72 | 41 | 38/9 | IHC | I-III | NA | OS | 2.05[1.01-4.16] | P | 4 | |||||||||||||||||||||||||||||||||||||||||||||||||||||||||||||||||||||||||||||||||||||
| Yuan 2014[26] | PKM2 | China | Asian | OSCC | 46.8(2-80) | 63 | 37/26 | IHC | I-IV | Score≥4(0-12) | OS | 6.05[1.52-24.07] | P | 7 | |||||||||||||||||||||||||||||||||||||||||||||||||||||||||||||||||||||||||||||||||||||
| Zhang 2016[27] | HK2 | China | Asian | NPC | 52.49(3.75-93.63) | 140 | 107/33 | IHC | I-IV | Score>3(0-12) | OS DMFS | 1.72[0.46-6.38] 1.26[0.36-4.45] | P | 7 | |||||||||||||||||||||||||||||||||||||||||||||||||||||||||||||||||||||||||||||||||||||
| RFS | 3.71[0.04-349.71] | ||||||||||||||||||||||||||||||||||||||||||||||||||||||||||||||||||||||||||||||||||||||||||||||||||
| Zhou 2017[28] | GLUT1 | China | Asian | NPC | 36 | 63 | 41/22 | IHC | I-IV | >2 | OS | 1.72[0.88-3.34] | P | 7 | |||||||||||||||||||||||||||||||||||||||||||||||||||||||||||||||||||||||||||||||||||||
| Zhu 2014[29] | MCT4 | China | Asian | OSCC | NA | 99 | 59/40 | IHC | I-IV | Score≥6(0-7) | OS DFS | 3.64[1.60-8.29] 3.42[1.51-7.78] | P | 7 | |||||||||||||||||||||||||||||||||||||||||||||||||||||||||||||||||||||||||||||||||||||
| Zuo 2016[30] | GLUT1 | China | Asian | LSCC | NA | 57 | 47/10 | IHC | I-IV | NA | OS | 1.97[0.12-33.19] | P | 6 | |||||||||||||||||||||||||||||||||||||||||||||||||||||||||||||||||||||||||||||||||||||
| M/F: male/female; cut-off value: value that distinguishes high and low expression of glycolysis markers; HR: hazard ratio; CI: confidence interval; TMA: tissue microarray; IHC: Immunohistochemistry; P: prospective; NA: not available; OSCC: oral squamous cell carcinoma; LSCC: laryngeal squamous cell carcinoma; SCC: squamous cell carcinoma; cSCC: cutaneous squamous cell carcinoma; IF: Immunofluorescence staining; NPC: nasopharyngeal carcinoma; TTSCC: squamous cell carcinoma of the tonsil and mobile tongue. | |||||||||||||||||||||||||||||||||||||||||||||||||||||||||||||||||||||||||||||||||||||||||||||||||||
Glycolysis markers and OS in HNSCC
We evaluated the relationship between expression levels of the 5 glycolysis markers and OS in HNSCC using data from twenty-one studies that included 1893 patients [14–34]. High expression of glycolysis markers correlated with poor OS of HNSCC patients (HR = 2.12, 95% CI: 1.79-2.50, P < 0.001; Figure 2A). There was no significant heterogeneity between the studies (I2 = 0%, Ph =0.45; Figure 2A).
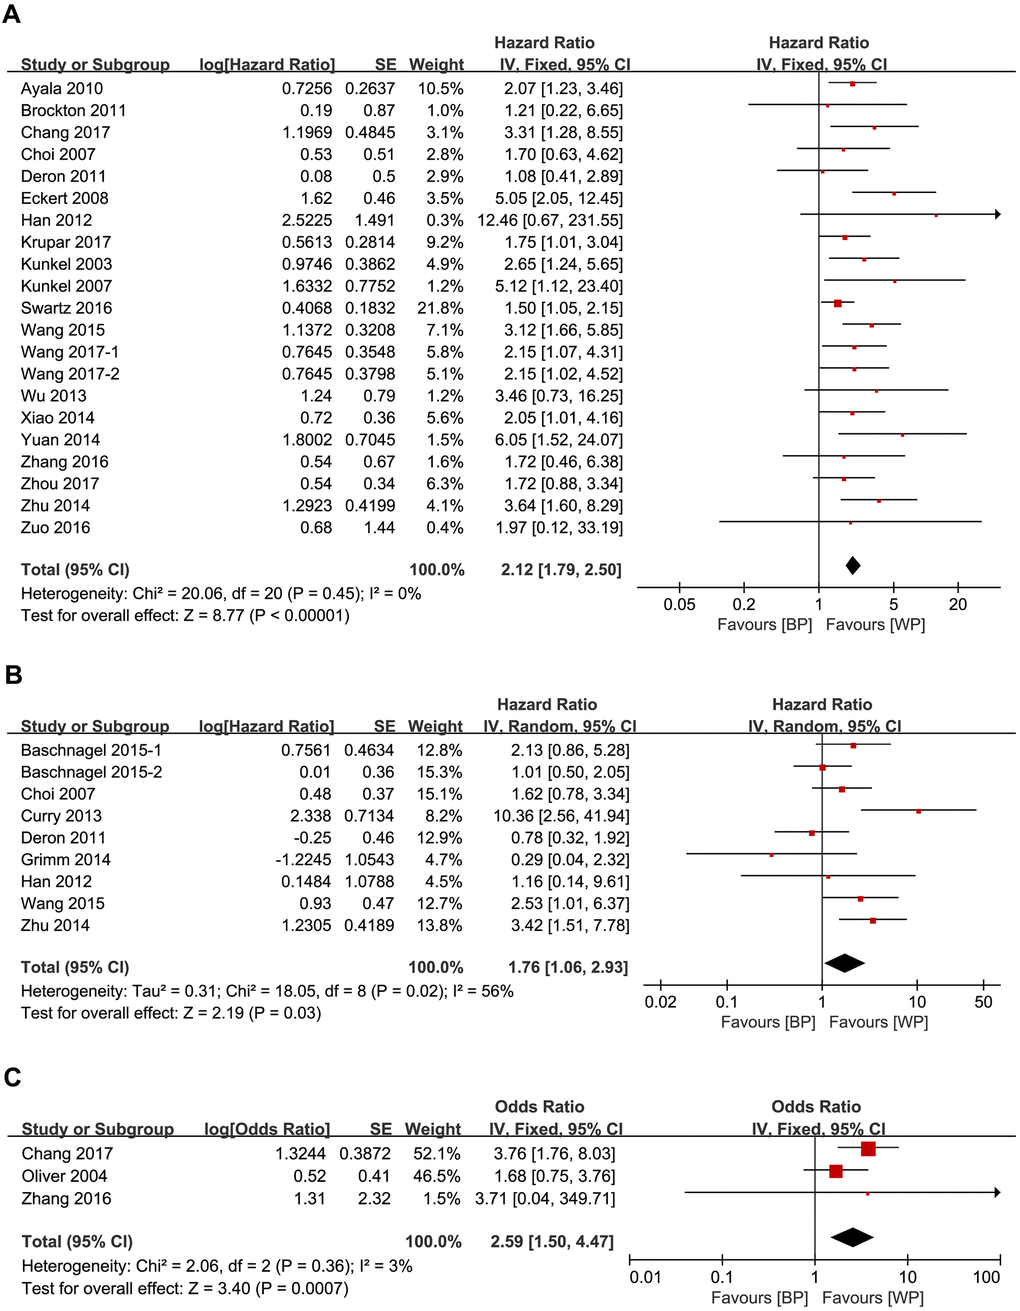
Figure 2. Forest plots show the association between the expression levels of glycolysis markers and (A) OS (B) DFS and (C) RFS of HNSCC patients. Note: BP: better prognosis; WP: worse prognosis.
Glycolysis markers and DFS in HNSCC
We analyzed the relationship between the 5 glycolysis markers and DFS in HNSCC using data from nine studies that included 771 patients [17, 21, 29, 31, 35–38]. High expression of glycolysis markers significantly correlated with poor DFS (HR = 1.76, 95% CI: 1.06-2.93, P = 0.03), but there was significant heterogeneity between the analyzed studies (I2 = 56%, Ph = 0.02; Figure 2B) [18].
Glycolysis markers and RFS in HNSCC
We then analyzed the data from three studies with 284 patients [16, 27, 39] to determine the relationship between RFS and the expression levels of HK2, GLUT1 and GLUT4 in HNSCC tissues. We observed significant correlation between expression levels of the three glycolysis markers and RFS (HR = 3.53, 95% CI: 1.79-6.93, P < 0.001). Moreover, there was no significant heterogeneity between the three studies (I2 = 0%, Ph = 0.93; Figure 2C).
Glycolysis markers and DSS or DMFS in HNSCC
We analyzed the data from two studies with 132 patients [20, 40] to determine the relationship between DSS and the expression levels of GLUT1 and MCT4 in HNSCC patients. We also analyzed data from two studies with 198 patients [27, 41] to determine the relationship between DMFS and the expression levels of GLUT1 and HK2 in HNSCC patients. We did not observe any significant correlation between DFS and the expression levels of GLUT1 and MCT4. Moreover, the relationship between DMFS and the expression levels of GLUT1 and HK2 was inconclusive because the data varied significantly between the two studies (Table 1).
Subgroup analysis
To explore the potential source of heterogeneity, we performed subgroup analyses by stratifying data based on ethnicity, glycolysis markers, tumor location, and sample sizes (Table 2).
Table 2. Prognostic value of glycolysis markers in HNSCC patients.
| Variable | Study NO. | Sample size | HR [95% CI] | P value | Heterogeneity | ||
| I2(%) | P value | ||||||
| OS | Overall | 21 | 1893 | 2.12 [1.79, 2.50] | <0.001 | 0 | 0.45 |
| Ethnicity | |||||||
| Asian | 12 | 1039 | 2.53 [1.93, 3.30] | <0.001 | 0 | 0.80 | |
| Caucasian | 9 | 854 | 1.89 [1.52, 2.34] | <0.001 | 22 | 0.24 | |
| Glycolysis marker | |||||||
| GLUT1 | 12 | 998 | 1.94 [1.57, 2.39] | <0.001 | 2 | 0.42 | |
| MCT4 | 1 | 99 | 3.64 [1.60, 8.29] | 0.002 | - | - | |
| HK2 | 3 | 324 | 2.05 [1.29, 3.26] | 0.002 | 0 | 0.96 | |
| PKM2 | 3 | 311 | 2.92 [1.85, 4.59] | <0.001 | 0 | 0.41 | |
| GLUT4 | 2 | 161 | 1.93 [0.97, 3.81] | 0.06 | 61 | 0.11 | |
| Tumor location | |||||||
| OSCC | 11 | 982 | 2.71 [2.12, 3.46] | <0.001 | 0 | 0.60 | |
| NPC | 3 | 250 | 1.85 [1.17, 2.91] | 0.008 | 0 | 0.93 | |
| LSCC | 2 | 106 | 3.04 [0.78, 11.80] | 0.11 | 0 | 0.73 | |
| Oropharyngeal SCC | 1 | 274 | 1.50 [1.05, 2.15] | 0.026 | - | - | |
| Sample size | |||||||
| Large | 10 | 1321 | 2.06 [1.69, 2.50] | <0.001 | 0 | 0.50 | |
| Small | 11 | 566 | 2.29 [1.66, 3.17] | <0.001 | 13 | 0.32 | |
| DFS | Overall | 9 | 771 | 1.76 [1.06, 2.93] | 0.03 | 56 | 0.02 |
| Ethnicity | |||||||
| Asian | 4 | 303 | 2.24 [1.42, 3.54] | <0.001 | 0 | 0.52 | |
| Caucasian | 5 | 468 | 1.46 [0.61, 3.49] | 0.39 | 70 | 0.01 | |
| Glycolysis marker | |||||||
| GLUT1 | 4 | 351 | 1.55 [0.92, 2.64] | 0.10 | 1 | 0.39 | |
| MCT4 | 2 | 141 | 4.55 [2.24, 9.23] | <0.001 | 44 | 0.18 | |
| HK2 | 1 | 97 | 1.01 [0.50, 2.05] | 0.98 | - | - | |
| PKM2 | 1 | 111 | 2.53 [1.01, 6.37] | 0.008 | - | - | |
| GLUT4 | 1 | 71 | 0.78 [0.32, 1.92] | 0.59 | - | - | |
| Tumor location | |||||||
| OSCC | 6 | 506 | 2.33 [1.18, 4.60] | 0.01 | 52 | 0.06 | |
| Sample size | |||||||
| Large | 5 | 565 | 1.75 [0.94, 3.27] | 0.08 | 53 | 0.07 | |
| Small | 4 | 206 | 1.88 [0.68, 5.18] | 0.22 | 68 | 0.02 | |
Subgroup analysis based on ethnicity showed that high expression levels of the five glycolysis markers correlated with poorer OS in Asians (HR = 2.53, 95% CI: 1.93-3.30, P < 0.001) and Caucasians (HR = 1.89, 95% CI: 1.52-2.34, P < 0.001). However, higher expression levels of glycolysis markers were associated with poorer DFS only in Asians (HR = 2.24, 95% CI: 1.42-3.54, P < 0.001).
We further stratified data based on the expression levels of individual glycolysis markers and found that higher expression levels of GLUT1 (HR = 1.94, 95% CI: 1.57-2.39, P < 0.001), MCT4 (HR = 3.64, 95% CI: 1.60-8.29, P = 0.002), HK2 (HR = 2.05, 95% CI: 1.29-3.26, P = 0.002), and PKM2 (HR = 2.92, 95% CI: 1.85-4.59, P < 0.001) correlated with poorer OS in HNSCC patients. Moreover, higher expression of MCT4 (HR = 4.55, 95% CI: 2.24-9.23, P < 0.001), and PKM2 (HR = 2.53, 95% CI: 1.01-6.37, P = 0.008) correlated with worse DFS in HNSCC patients.
We then performed subgroup analysis based on the location of HNSCC and found that higher expression levels of the five glycolysis markers were associated with poorer OS in patients with oral squamous cell carcinoma (OSCC) (HR = 2.71, 95% CI: 2.12-3.46, P < 0.001), nasopharyngeal carcinoma (NPC) (HR = 1.85, 95% CI: 1.17-2.91, P = 0.008), and oropharyngeal SCC (HR = 1.50, 95% CI: 1.05-2.15, P = 0.026). Moreover, OSCC patients with higher expression of glycolysis markers were associated with worse DFS (HR = 2.33, 95% CI: 1.18-4.60, P = 0.01).
Furthermore, HNSCC patients with higher expression levels of glycolysis markers in both large sample size (HR = 2.06, 95% CI: 1.69-2.50, P < 0.001) and small sample size (HR = 2.29, 95% CI: 1.66-3.17, P < 0.001) groups were associated with worse OS.
We also analyzed the relationship between GLUT1 expression levels and OS or DFS in OSCC patients. OSCC patients with higher GLUT1 levels were associated with poorer OS (HR = 2.61, 95% CI: 1.85-3.70, P < 0.001; Figure 3A), but did not show significant association with DFS (HR = 1.32, 95% CI: 0.69-2.54, P = 0.40; Figure 3B).
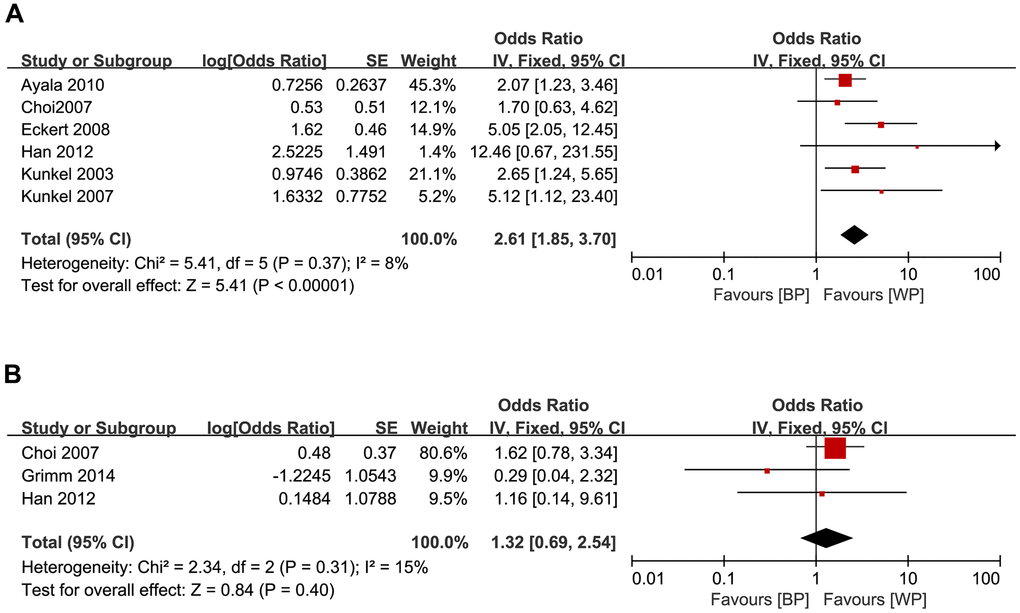
Figure 3. Forest plots show the relationship between the levels of GLUT1 expression and (A) OS and (B) DFS in OSCC patients. Note: BP: better prognosis; WP: worse prognosis.
Galbraith plot analysis
We then constructed Galbraith plots to investigate the source of heterogeneity in studies describing the expression levels of glycolysis markers and DFS. Results showed that there was one study by Curry et al. [36] outside the CI and thus might be the source of heterogeneity (Figure 4). There was no statistically significant heterogeneity detected (I2 = 38%, Ph = 0.12) after removing this study, but the significant relationship between glycolysis markers’ expression and DFS was not changed (HR = 1.56, 95% CI: 1.13-2.16, P = 0.007; Figure 5).
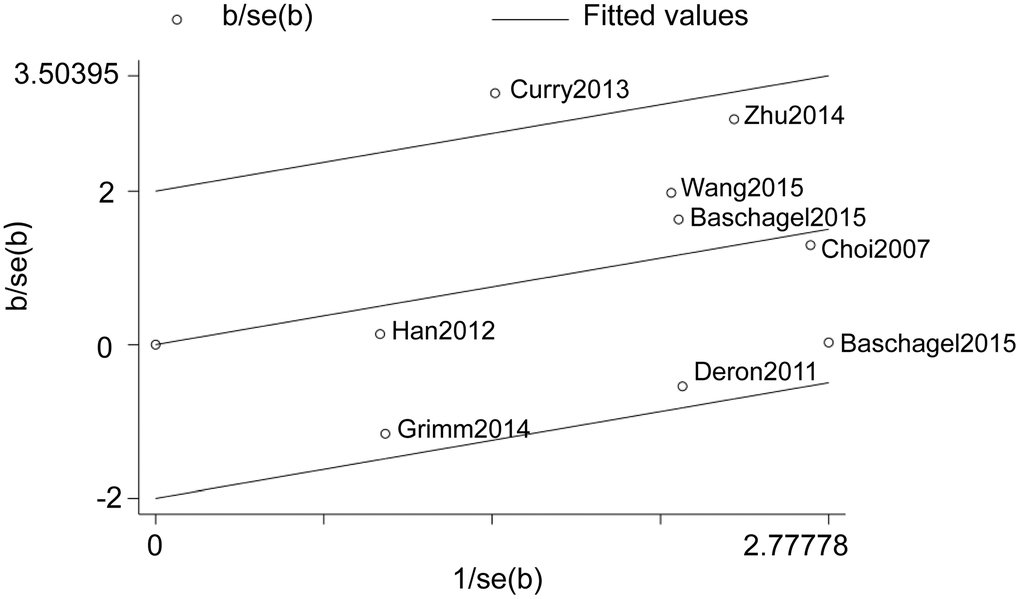
Figure 4. Galbraith plot analysis shows the source of heterogeneity in studies regarding the association between the expression levels of glycolysis markers and DFS in HNSCC patients.
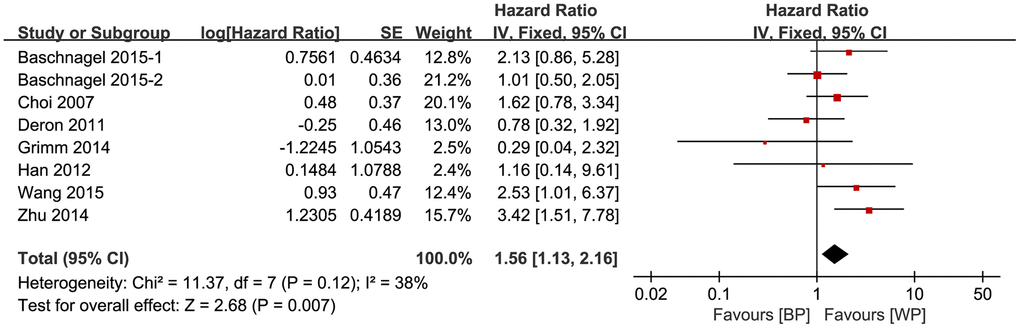
Figure 5. Association between the expression levels of glycolysis markers and DFS after removing the source of heterogeneity.
Sensitivity analysis
We performed sensitivity analyses to further investigate the relationship between the expression levels of glycolysis markers and the OS and DFS of HNSCC patients based on fifteen [14, 16, 18, 21–24, 26–29, 31, 32, 34, 38] and seven [21, 29, 31, 35, 37, 38] high-quality studies (NOS score ≥ 7, Table 3), respectively. In most cases, the data revealed similar trends as reported in the subgroup analyses. However, the sensitivity analysis showed that the expression levels of glycolysis markers did not correlate with OS in NPC patients (HR = 1.72, 95% CI: 0.95-3.11, P = 0.07) or DFS in HNSCC patients (HR = 1.55, 95% CI: 0.97-2.47, P = 0.07).
Table 3. Sensitivity analysis of high-quality studies to determine the prognostic value of glycolysis markers in HNSCC patients.
| Variable | Study NO. | Sample size | HR [95% CI] | P value | Heterogeneity | ||
| I2(%) | P value | ||||||
| OS | Overall | 15 | 1596 | 2.14 [1.78, 2.57] | <0.001 | 15 | 0.29 |
| Ethnicity | |||||||
| Asian | 10 | 949 | 2.50 [1.91, 3.27] | <0.001 | 0 | 0.76 | |
| Caucasian | 5 | 647 | 2.04 [1.35, 3.08] | <0.001 | 52 | 0.08 | |
| Glycolysis marker | |||||||
| GLUT1 | 7 | 748 | 1.92 [1.52, 2.43] | <0.001 | 22 | 0.26 | |
| MCT4 | 1 | 99 | 3.64 [1.60, 8.29] | 0.002 | - | - | |
| HK2 | 2 | 277 | 2.04 [1.11, 3.78] | 0.02 | 0 | 0.77 | |
| PKM2 | 3 | 311 | 2.92 [1.85, 4.59] | <0.001 | 0 | 0.41 | |
| GLUT4 | 2 | 161 | 1.93 [0.97, 3.81] | 0.06 | 61 | 0.11 | |
| Tumor location | |||||||
| OSCC | 9 | 909 | 2.69 [2.07, 3.48] | <0.001 | 0 | 0.52 | |
| NPC | 2 | 203 | 1.72 [0.95, 3.11] | 0.07 | 0 | 1 | |
| LSCC | 1 | 49 | 3.46 [0.73, 16.25] | 0.12 | - | - | |
| Oropharyngeal SCC | 1 | 274 | 1.50 [1.05, 2.15] | 0.026 | - | - | |
| Sample size | |||||||
| Large | 9 | 1248 | 2.10 [1.71, 2.59] | <0.001 | 0 | 0.44 | |
| Small | 6 | 348 | 2.26 [1.53, 3.36] | <0.001 | 41 | 0.13 | |
| DFS | Overall | 7 | 696 | 1.55 [0.97, 2.47] | 0.07 | 47 | 0.08 |
| Ethnicity | |||||||
| Asian | 3 | 270 | 2.32 [1.45, 3.70] | <0.001 | 0 | 0.40 | |
| Caucasian | 4 | 426 | 1.08 [0.68, 1.71] | 0.76 | 29 | 0.24 | |
| Glycolysis marker | |||||||
| GLUT1 | 3 | 318 | 1.59 [0.92, 2.74] | 0.10 | 33 | 0.23 | |
| MCT4 | 1 | 99 | 3.42 [1.51, 7.78] | 0.003 | - | - | |
| HK2 | 1 | 97 | 1.01 [0.50, 2.05] | 0.98 | - | - | |
| PKM2 | 1 | 111 | 2.53 [1.01, 6.37] | 0.008 | - | - | |
| GLUT4 | 1 | 71 | 0.78 [0.32, 1.92] | 0.59 | - | - | |
| Tumor location | |||||||
| OSCC | 4 | 431 | 2.09 [1.33, 3.31] | 0.002 | 45 | 0.14 | |
| Sample size | |||||||
| Large | 5 | 565 | 1.75 [0.94, 3.27] | 0.08 | 53 | 0.07 | |
| Small | 2 | 131 | 1.21 [0.69, 2.13] | 0.50 | 35 | 0.22 | |
Publication bias
We then analyzed publication bias in studies regarding OS using Begg’s funnel plots and Egger’s test. Begg’s test did not show significant publication bias among the included studies (P = 0.156, Figure 6A). However, Egger’s test showed significant publication bias (P = 0.027, Figure 6B). Furthermore, the funnel plots were adjusted by using trim and fill method. The results were not significantly altered after adding 4 suppositional studies (HR = 0.683, 95% CI: 0.521–0.846; Figure 6C), indicating that our result was robust.
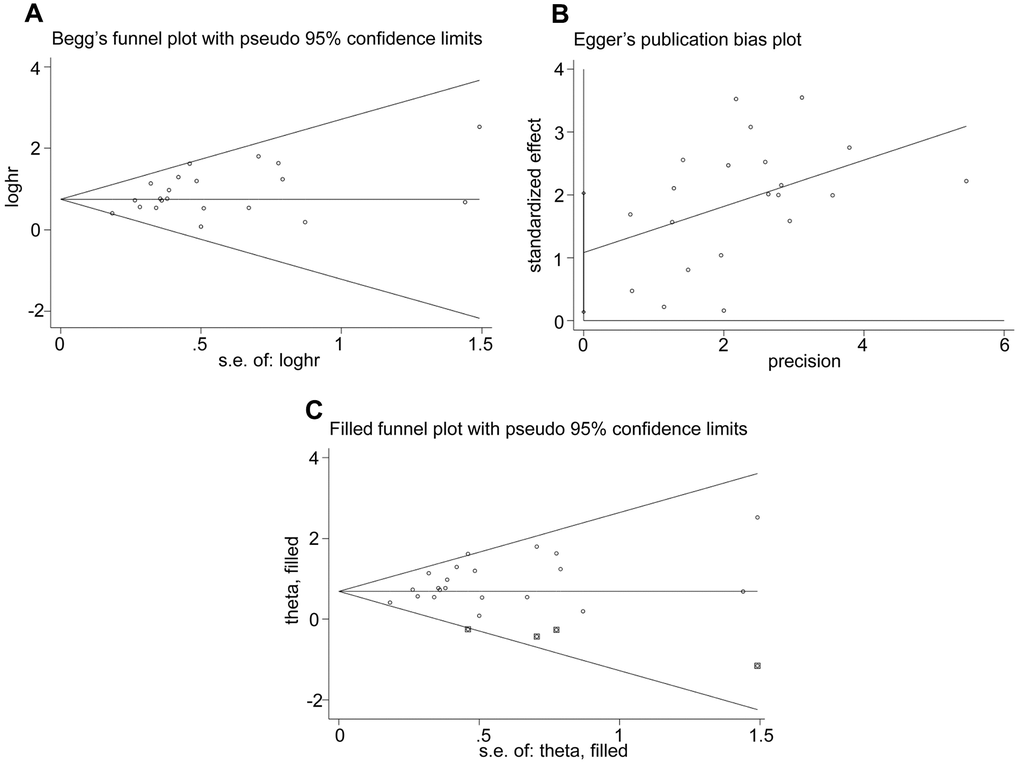
Figure 6. Evaluation of publication bias. (A) Begg’s funnel plots, (B) Egger’s test and (C) Funnel plots adjusted using trim and fill method show the evaluation of publication bias among studies used to assess the relationship between the expression levels of glycolysis markers and OS.
Discussion
Cancer cells generate significant amounts of energy through aerobic glycolysis to sustain rapid proliferation, migration, survival, and chemotherapeutic drug resistance [42, 43]. Several signaling pathways such as AKT/mTOR, AMP-activated protein kinase (AMPK), NF-κB, and HIF-1α regulate glycolysis [11, 42, 44]. Glycolysis is upregulated in many types of cancers, but systematic meta-analysis of the relationship between the expression of glycolysis markers and prognosis of HNSCC patients has not been carried out.
In this meta-analysis, we analyzed data from 37 studies with 3272 patients to determine the prognostic value of five glycolysis markers in HNSCC. Our results showed that high expression levels of glycolysis markers in HNSCC tissues significantly correlated with worse OS, DFS, and RFS of HNSCC patients. These results are consistent with the results of most studies included in this meta-analysis.
Stratified analysis by ethnicity revealed that higher expression of glycolysis markers was associated with shorter OS in both Asians and Caucasians. However, their higher expression correlated with poorer DFS only in Asians. These results suggest that the roles of these glycolysis markers in HNSCC growth and progression may vary among different ethnic populations. The results of our meta-analysis may help clinicians stratify HNSCC patients into appropriate high- and low-risk categories based on the expression of glycolysis markers.
Sensitivity analysis by sample size suggested that higher expression of glycolysis markers predicted unfavorable OS, but was not associated with DFS in both small and large sample size HNSCC patient groups. The heterogeneity between studies in the DFS analysis suggested the need for more clinical studies to overcome bias. Furthermore, higher expression of these glycolysis markers was linked to worse OS and DFS in OSCC and poorer OS in oropharyngeal SCC, but was not associated with OS or DFS in NPC or laryngeal squamous cell carcinoma (LSCC). This suggested that the requirement of glycolysis markers may vary in different types of HNSCC. Moreover, our results suggest that these glycolysis markers may be potential therapeutic targets in OSCC and oropharyngeal SCC patients.
The members of the glucose transporter (GLUT) family are upregulated in several cancer types and mediate glucose uptake that is required to sustain the high energy demand required by cancer cells for various biochemical programs. Our results showed that higher expression of GLUT1 predicted poorer OS in HNSCC patients. This was consistent with previous findings in other solid tumors [45]. A study by Chang et al. reported that upregulation of GLUT4 in HNSCC patients was associated with poorer overall survival and recurrence-free survival [16]. However, our meta-analysis did not demonstrate association between high GLUT4 expression and OS or DFS in HNSCC patients. This may be attributed to the smaller sample size in the studies included in our meta-analysis.
Hexokinase 2 (HK2) catalyzes phosphorylation of glucose into glucose-6-phosphate and represents the first rate-limiting step of glycolysis [11]. Previous studies showed that high expression of HK2 was significantly correlated with poorer OS in various solid tumors [46]. Consistent with these reports, we found that higher HK2 expression was significantly linked to shorter OS in HNSCC patients.
MCT4 plays a vital role in monocarboxylic acid export [10] and PKM2 catalyzes the last step of glycolysis by converting phosphoenolpyruvate into pyruvate with the generation of a molecule of ATP [47]. Our meta-analysis showed that higher MCT4 and PKM2 expression was associated with poorer OS and DFS in HNSCC patients. However, sample sizes in the analyses of MCT4 and PKM2 were relatively small. Therefore, further large sample size studies are required to confirm our findings. Previous studies have shown that higher MCT1 and PKM2 expression levels are associated with poor prognosis in several cancers [10, 42].
Overall, these results suggest that GLUT1, HK2, PKM2 and MCT4 are potential therapeutic targets to improve survival outcomes of HNSCC patients.
The results of our meta-analysis showed that higher GLUT1 expression correlated with worse OS in OSCC patients. These results are consistent with the results from a previous study [48]. Higher GLUT1 expression strongly correlated with a more invasive, proliferative, and malignant OSCC, which is associated with poorer prognosis [49–51].
This meta-analysis has several limitations. Firstly, we identified significant heterogeneity among studies related to DFS, but these effects could not be eliminated or explained completely. Galbraith plot demonstrated that the study by Curry et al. [36] contributed significantly towards heterogeneity in studies regarding DFS. The heterogeneity was eliminated after removing this study from the analysis. However, we observed heterogeneity in sensitivity analysis that may have been caused by differences in the age and tumor stages of patients in different studies that were used for this meta-analysis. Secondly, half of the studies were carried out in Asian patients and the remaining patients were of Caucasian origin. This may have resulted in population selection bias. Thirdly, the included studies were all prospective and may have contributed to bias. Lastly, we observed publication bias in our meta-analysis. We adjusted funnel plots using trim and fill method and the results were not significantly changed after adding 4 suppositional studies, thereby demonstrating the robustness of our analysis. However, additional large-scale, high-quality, long-term studies are necessary to confirm the findings of our meta-analysis.
In conclusion, our meta-analysis demonstrates that glycolytic pathway enzymes are potential prognostic biomarkers and therapeutic targets in HNSCC patients. Overall, high expression of the four glycolysis markers in the tumor tissues correlated with poorer OS, DFS, and RFS in HNSCC patients.
Materials and Methods
Literature selection and inclusion criteria
We performed literature search in the PubMed, Web of Science and Cochrane Library databases between January 2000 and August 2020 without restrictions on the type of publications or the study regions for the following MeSH headings in the title or abstract: (monocarboxylate transporter 4 OR hexokinase 2 OR glucose transporter 1 OR glucose transporter 4 OR pyruvate kinase M2) AND ((head and neck squamous cell carcinoma OR HNSCC OR ((oral OR larynx OR pharynx OR tongue OR oropharynx OR nasopharynx OR hypopharynx OR trachea OR laryngopharynx OR cervical tracheal OR cervical esophagus) AND (cancer OR tumor OR carcinoma OR neoplasm))).
Inclusion and exclusion criteria
Available studies were included according to the following criteria: 1) the relationship between glycolysis marker expression and overall survival (OS), disease-free survival (DFS), recurrence-free survival (RFS), disease-specific survival (DSS) or distant metastasis-free survival (DMFS) in HNSCC was described; 2) HRs and 95% CIs could be obtained or estimated from the data provided in the text; 3) the diagnosis of HNSCC was done according to pathological examination.
The exclusion criteria were: 1) editorials, reviews, case reports, letters to the editor; 2) animal experimental studies; 3) sample size < 30 samples.
Data extraction
Two authors (YW and YL) independently extracted data regarding author, publication time, study country and ethnicity, tumor location, follow-up period, sample size, TNM stage, cut-off values of glycolysis markers, and survival data from the included studies. The HRs and 95% CIs were either reported in the included studies or estimated from raw data using Kaplan-Meier survival curve analysis [52, 53]. Any disagreement between the two authors was resolved by a senior author (JX).
Study quality assessment
The quality of all included studies was assessed by the Newcastle-Ottawa Scale (NOS) [54]. They were allocated a score of 0-9 independently by two authors (YW and YL). Any disagreements between the two authors were resolved by discussion. The studies with a score of seven or above were considered as of high quality.
Statistical analysis
The meta-analysis was performed according to the Cochrane Collaboration and the Quality of Reporting of Meta-analyses guidelines [55, 56]. The hazard ratio (HR) was considered as a summary statistic for censored outcomes (OS, DFS, RFS, DSS, DMFS) [52]. HNSCC patients with HR values greater than 1 were considered to be associated with poor survival.
Heterogeneity between studies was evaluated using chi-square test and a P value less than 0.10 was considered as significant heterogeneity. I2 statistic was used to quantify heterogeneity. A random-effects model was used to evaluate studies with heterogeneity, whereas those without heterogeneity were evaluated using the fixed-effects model [57]. Galbraith plot analysis was performed to identify the studies with heterogeneity.
We used the median value of all samples as the boundary between the large and small sample size. Subgroup analyses were performed based on different glycolysis markers, ethnicity, sample sizes, and tumor locations. Sensitivity analysis was conducted for high quality studies. Publication bias was evaluated using Begg’s test and Egger’s test and the credibility of the results was evaluated using the trim and fill method [58]. The statistical analyses were performed using Review Manager version 5.3 (Cochrane Collaboration, Copenhagen, Denmark) and STATA SE version 12.0 (Stata Corporation, College Station, TX, USA). A two-tailed P < 0.05 was considered statistically significant.
Supplementary Materials
Author Contributions
JX and BC designed the study concept and meta-analysis; YW and YL acquired the data, performed the quality assessments, analyzed the data, and drafted the manuscript; LJ and XR performed the statistical analyses. All authors read and approved the final manuscript.
Conflicts of Interest
The authors declare that there are no conflicts of interest.
Funding
This work was supported by grants from the National Natural Science Foundation of China (81870769) and the Guangdong Financial Fund for High-Caliber Hospital Construction (174-2018-XMZC-0001-03-0125/D-05).
References
- 1. Parkin DM, Bray F, Ferlay J, Pisani P. Global cancer statistics, 2002. CA Cancer J Clin. 2005; 55:74–108. https://doi.org/10.3322/canjclin.55.2.74 [PubMed]
- 2. Ferlay J, Soerjomataram I, Dikshit R, Eser S, Mathers C, Rebelo M, Parkin DM, Forman D, Bray F. Cancer incidence and mortality worldwide: sources, methods and major patterns in GLOBOCAN 2012. Int J Cancer. 2015; 136:E359–86. https://doi.org/10.1002/ijc.29210 [PubMed]
- 3. Jou A, Hess J. Epidemiology and molecular biology of head and neck cancer. Oncol Res Treat. 2017; 40:328–32. https://doi.org/10.1159/000477127 [PubMed]
- 4. Argiris A, Karamouzis MV, Raben D, Ferris RL. Head and neck cancer. Lancet. 2008; 371:1695–709. https://doi.org/10.1016/S0140-6736(08)60728-X [PubMed]
- 5. Peitzsch C, Nathansen J, Schniewind SI, Schwarz F, Dubrovska A. Cancer Stem Cells in Head and Neck Squamous Cell Carcinoma: Identification, Characterization and Clinical Implications. Cancers (Basel). 2019; 11:616. https://doi.org/10.3390/cancers11050616 [PubMed]
- 6. Nagadia R, Pandit P, Coman WB, Cooper-White J, Punyadeera C. miRNAs in head and neck cancer revisited. Cell Oncol (Dordr). 2013; 36:1–7. https://doi.org/10.1007/s13402-012-0122-4 [PubMed]
- 7. Zahra K, Dey T, Ashish A, Mishra SP, Pandey U. Pyruvate kinase M2 and cancer: the role of PKM2 in promoting tumorigenesis. Front Oncol. 2020; 10:159. https://doi.org/10.3389/fonc.2020.00159 [PubMed]
- 8. Adekola K, Rosen ST, Shanmugam M. Glucose transporters in cancer metabolism. Curr Opin Oncol. 2012; 24:650–54. https://doi.org/10.1097/CCO.0b013e328356da72 [PubMed]
- 9. Gonzalez-Menendez P, Hevia D, Mayo JC, Sainz RM. The dark side of glucose transporters in prostate cancer: are they a new feature to characterize carcinomas? Int J Cancer. 2018; 142:2414–24. https://doi.org/10.1002/ijc.31165 [PubMed]
- 10. Park SJ, Smith CP, Wilbur RR, Cain CP, Kallu SR, Valasapalli S, Sahoo A, Guda MR, Tsung AJ, Velpula KK. An overview of MCT1 and MCT4 in GBM: small molecule transporters with large implications. Am J Cancer Res. 2018; 8:1967–76. [PubMed]
- 11. Garcia SN, Guedes RC, Marques MM. Unlocking the potential of HK2 in cancer metabolism and therapeutics. Curr Med Chem. 2019; 26:7285–322. https://doi.org/10.2174/0929867326666181213092652 [PubMed]
- 12. Payen VL, Mina E, Van Hée VF, Porporato PE, Sonveaux P. Monocarboxylate transporters in cancer. Mol Metab. 2020; 33:48–66. https://doi.org/10.1016/j.molmet.2019.07.006 [PubMed]
- 13. Israelsen WJ, Vander Heiden MG. Pyruvate kinase: function, regulation and role in cancer. Semin Cell Dev Biol. 2015; 43:43–51. https://doi.org/10.1016/j.semcdb.2015.08.004 [PubMed]
- 14. Ayala FR, Rocha RM, Carvalho KC, Carvalho AL, da Cunha IW, Lourenço SV, Soares FA. GLUT1 and GLUT3 as potential prognostic markers for oral squamous cell carcinoma. Molecules. 2010; 15:2374–87. https://doi.org/10.3390/molecules15042374 [PubMed]
- 15. Brockton N, Dort J, Lau H, Hao D, Brar S, Klimowicz A, Petrillo S, Diaz R, Doll C, Magliocco A. High stromal carbonic anhydrase IX expression is associated with decreased survival in P16-negative head-and-neck tumors. Int J Radiat Oncol Biol Phys. 2011; 80:249–57. https://doi.org/10.1016/j.ijrobp.2010.11.059 [PubMed]
- 16. Chang YC, Chi LH, Chang WM, Su CY, Lin YF, Chen CL, Chen MH, Chang PM, Wu AT, Hsiao M. Glucose transporter 4 promotes head and neck squamous cell carcinoma metastasis through the TRIM24-DDX58 axis. J Hematol Oncol. 2017; 10:11. https://doi.org/10.1186/s13045-016-0372-0 [PubMed]
- 17. Han MW, Lee HJ, Cho KJ, Kim JS, Roh JL, Choi SH, Nam SY, Kim SY. Role of FDG-PET as a biological marker for predicting the hypoxic status of tongue cancer. Head Neck. 2012; 34:1395–402. https://doi.org/10.1002/hed.21945 [PubMed]
- 18. Swartz JE, Pothen AJ, van Kempen PM, Stegeman I, Formsma FK, Cann EM, Willems SM, Grolman W. Poor prognosis in human papillomavirus-positive oropharyngeal squamous cell carcinomas that overexpress hypoxia inducible factor-1α. Head Neck. 2016; 38:1338–46. https://doi.org/10.1002/hed.24445 [PubMed]
- 19. Krupar R, Hautmann MG, Pathak RR, Varier I, McLaren C, Gaag D, Hellerbrand C, Evert M, Laban S, Idel C, Sandulache V, Perner S, Bosserhoff AK, Sikora AG. Immunometabolic determinants of chemoradiotherapy response and survival in head and neck squamous cell carcinoma. Am J Pathol. 2018; 188:72–83. https://doi.org/10.1016/j.ajpath.2017.09.013 [PubMed]
- 20. Sweeny L, Dean NR, Frederick JW, Magnuson JS, Carroll WR, Desmond RA, Rosenthal EL. CD147 expression in advanced cutaneous squamous cell carcinoma. J Cutan Pathol. 2012; 39:603–09. https://doi.org/10.1111/j.1600-0560.2012.01912.x [PubMed]
- 21. Wang Y, Zhang X, Zhang Y, Zhu Y, Yuan C, Qi B, Zhang W, Wang D, Ding X, Wu H, Cheng J. Overexpression of pyruvate kinase M2 associates with aggressive clinicopathological features and unfavorable prognosis in oral squamous cell carcinoma. Cancer Biol Ther. 2015; 16:839–45. https://doi.org/10.1080/15384047.2015.1030551 [PubMed]
- 22. Wang W, Liu Z, Zhao L, Sun J, He Q, Yan W, Lu Z, Wang A. Hexokinase 2 enhances the metastatic potential of tongue squamous cell carcinoma via the SOD2-H2O2 pathway. Oncotarget. 2017; 8:3344–54. https://doi.org/10.18632/oncotarget.13763 [PubMed]
- 23. Wang W, He Q, Sun J, Liu Z, Zhao L, Lu Z, Zhou X, Wang A. Pyruvate kinase M2 deregulation enhances the metastatic potential of tongue squamous cell carcinoma. Oncotarget. 2017; 8:68252–62. https://doi.org/10.18632/oncotarget.19291 [PubMed]
- 24. Wu XH, Chen SP, Mao JY, Ji XX, Yao HT, Zhou SH. Expression and significance of hypoxia-inducible factor-1α and glucose transporter-1 in laryngeal carcinoma. Oncol Lett. 2013; 5:261–66. https://doi.org/10.3892/ol.2012.941 [PubMed]
- 25. Xiao L, Hu ZY, Dong X, Tan Z, Li W, Tang M, Chen L, Yang L, Tao Y, Jiang Y, Li J, Yi B, Li B, et al. Targeting Epstein-Barr virus oncoprotein LMP1-mediated glycolysis sensitizes nasopharyngeal carcinoma to radiation therapy. Oncogene. 2014; 33:4568–78. https://doi.org/10.1038/onc.2014.32 [PubMed]
- 26. Yuan C, Li Z, Wang Y, Qi B, Zhang W, Ye J, Wu H, Jiang H, Song LN, Yang J, Cheng J. Overexpression of metabolic markers PKM2 and LDH5 correlates with aggressive clinicopathological features and adverse patient prognosis in tongue cancer. Histopathology. 2014; 65:595–605. https://doi.org/10.1111/his.12441 [PubMed]
- 27. Zhang MX, Hua YJ, Wang HY, Zhou L, Mai HQ, Guo X, Zhao C, Huang WL, Hong MH, Chen MY. Long-term prognostic implications and therapeutic target role of hexokinase II in patients with nasopharyngeal carcinoma. Oncotarget. 2016; 7:21287–97. https://doi.org/10.18632/oncotarget.7116 [PubMed]
- 28. Zhou JC, Zhang JJ, Zhang W, Ke ZY, Ma LG, Liu M. Expression of GLUT-1 in nasopharyngeal carcinoma and its clinical significance. Eur Rev Med Pharmacol Sci. 2017; 21:4891–95. [PubMed]
- 29. Zhu J, Wu YN, Zhang W, Zhang XM, Ding X, Li HQ, Geng M, Xie ZQ, Wu HM. Monocarboxylate transporter 4 facilitates cell proliferation and migration and is associated with poor prognosis in oral squamous cell carcinoma patients. PLoS One. 2014; 9:e87904. https://doi.org/10.1371/journal.pone.0087904 [PubMed]
- 30. Zuo J, Wen J, Lei M, Wen M, Li S, Lv X, Luo Z, Wen G. Hypoxia promotes the invasion and metastasis of laryngeal cancer cells via EMT. Med Oncol. 2016; 33:15. https://doi.org/10.1007/s12032-015-0716-6 [PubMed]
- 31. Choi YS, Kim SJ, Kim DS, Park SJ, Park Y, Shin HJ, Jung KY, Baek SK, Shin BK, Choi JW, Kim BS, Shin SW, Kim YH, Kim JS. Glucose transporter-1 expression in squamous cell carcinoma of the tongue. Cancer Res Treat. 2007; 39:109–15. https://doi.org/10.4143/crt.2007.39.3.109 [PubMed]
- 32. Eckert AW, Lautner MH, Taubert H, Schubert J, Bilkenroth U. Expression of Glut-1 is a prognostic marker for oral squamous cell carcinoma patients. Oncol Rep. 2008; 20:1381–85. [PubMed]
- 33. Kunkel M, Reichert TE, Benz P, Lehr HA, Jeong JH, Wieand S, Bartenstein P, Wagner W, Whiteside TL. Overexpression of Glut-1 and increased glucose metabolism in tumors are associated with a poor prognosis in patients with oral squamous cell carcinoma. Cancer. 2003; 97:1015–24. https://doi.org/10.1002/cncr.11159 [PubMed]
- 34. Kunkel M, Moergel M, Stockinger M, Jeong JH, Fritz G, Lehr HA, Whiteside TL. Overexpression of GLUT-1 is associated with resistance to radiotherapy and adverse prognosis in squamous cell carcinoma of the oral cavity. Oral Oncol. 2007; 43:796–803. https://doi.org/10.1016/j.oraloncology.2006.10.009 [PubMed]
- 35. Baschnagel AM, Wobb JL, Dilworth JT, Williams L, Eskandari M, Wu D, Pruetz BL, Wilson GD. The association of (18)F-FDG PET and glucose metabolism biomarkers GLUT1 and HK2 in p16 positive and negative head and neck squamous cell carcinomas. Radiother Oncol. 2015; 117:118–24. https://doi.org/10.1016/j.radonc.2015.08.025 [PubMed]
- 36. Curry JM, Tuluc M, Whitaker-Menezes D, Ames JA, Anantharaman A, Butera A, Leiby B, Cognetti DM, Sotgia F, Lisanti MP, Martinez-Outschoorn UE. Cancer metabolism, stemness and tumor recurrence: MCT1 and MCT4 are functional biomarkers of metabolic symbiosis in head and neck cancer. Cell Cycle. 2013; 12:1371–84. https://doi.org/10.4161/cc.24092 [PubMed]
- 37. Grimm M, Munz A, Teriete P, Nadtotschi T, Reinert S. GLUT-1(+)/TKTL1(+) coexpression predicts poor outcome in oral squamous cell carcinoma. Oral Surg Oral Med Oral Pathol Oral Radiol. 2014; 117:743–53. https://doi.org/10.1016/j.oooo.2014.02.007 [PubMed]
- 38. Deron P, Vermeersch H, Mees G, Vangestel C, Pauwels P, Van de Wiele C. Expression and prognostic value of glucose transporters and hexokinases in tonsil and mobile tongue squamous cell carcinoma. Histol Histopathol. 2011; 26:1165–72. https://doi.org/10.14670/HH-26.1165 [PubMed]
- 39. Oliver RJ, Woodwards RT, Sloan P, Thakker NS, Stratford IJ, Airley RE. Prognostic value of facilitative glucose transporter Glut-1 in oral squamous cell carcinomas treated by surgical resection: results of EORTC Translational Research Fund studies. Eur J Cancer. 2004; 40:503–07. https://doi.org/10.1016/j.ejca.2003.10.024 [PubMed]
- 40. Eckert AW, Lautner MH, Schütze A, Taubert H, Schubert J, Bilkenroth U. Coexpression of hypoxia-inducible factor-1α and glucose transporter-1 is associated with poor prognosis in oral squamous cell carcinoma patients. Histopathology. 2011; 58:1136–47. https://doi.org/10.1111/j.1365-2559.2011.03806.x [PubMed]
- 41. Jonathan RA, Wijffels KI, Peeters W, de Wilde PC, Marres HA, Merkx MA, Oosterwijk E, van der Kogel AJ, Kaanders JH. The prognostic value of endogenous hypoxia-related markers for head and neck squamous cell carcinomas treated with ARCON. Radiother Oncol. 2006; 79:288–97. https://doi.org/10.1016/j.radonc.2006.04.008 [PubMed]
- 42. Hsu MC, Hung WC. Pyruvate kinase M2 fuels multiple aspects of cancer cells: from cellular metabolism, transcriptional regulation to extracellular signaling. Mol Cancer. 2018; 17:35. https://doi.org/10.1186/s12943-018-0791-3 [PubMed]
- 43. Lis P, Dyląg M, Niedźwiecka K, Ko YH, Pedersen PL, Goffeau A, Ułaszewski S. The HK2 dependent ”Warburg effect“ and mitochondrial oxidative phosphorylation in cancer: targets for effective therapy with 3-bromopyruvate. Molecules. 2016; 21:1730. https://doi.org/10.3390/molecules21121730 [PubMed]
- 44. Barron CC, Bilan PJ, Tsakiridis T, Tsiani E. Facilitative glucose transporters: implications for cancer detection, prognosis and treatment. Metabolism. 2016; 65:124–39. https://doi.org/10.1016/j.metabol.2015.10.007 [PubMed]
- 45. Wang J, Ye C, Chen C, Xiong H, Xie B, Zhou J, Chen Y, Zheng S, Wang L. Glucose transporter GLUT1 expression and clinical outcome in solid tumors: a systematic review and meta-analysis. Oncotarget. 2017; 8:16875–86. https://doi.org/10.18632/oncotarget.15171 [PubMed]
- 46. Yu M, Chen S, Hong W, Gu Y, Huang B, Lin Y, Zhou Y, Jin H, Deng Y, Tu L, Hou B, Jian Z. Prognostic role of glycolysis for cancer outcome: evidence from 86 studies. J Cancer Res Clin Oncol. 2019; 145:967–99. https://doi.org/10.1007/s00432-019-02847-w [PubMed]
- 47. Alquraishi M, Puckett DL, Alani DS, Humidat AS, Frankel VD, Donohoe DR, Whelan J, Bettaieb A. Pyruvate kinase M2: a simple molecule with complex functions. Free Radic Biol Med. 2019; 143:176–92. https://doi.org/10.1016/j.freeradbiomed.2019.08.007 [PubMed]
- 48. Li CX, Sun JL, Gong ZC, Lin ZQ, Liu H. Prognostic value of GLUT-1 expression in oral squamous cell carcinoma: a prisma-compliant meta-analysis. Medicine (Baltimore). 2016; 95:e5324. https://doi.org/10.1097/MD.0000000000005324 [PubMed]
- 49. Harshani JM, Yeluri S, Guttikonda VR. Glut-1 as a prognostic biomarker in oral squamous cell carcinoma. J Oral Maxillofac Pathol. 2014; 18:372–78. https://doi.org/10.4103/0973-029X.151318 [PubMed]
- 50. Chen YH, Song Y, Yu YL, Cheng W, Tong X. miRNA-10a promotes cancer cell proliferation in oral squamous cell carcinoma by upregulating GLUT1 and promoting glucose metabolism. Oncol Lett. 2019; 17:5441–46. https://doi.org/10.3892/ol.2019.10257 [PubMed]
- 51. Wang Y, Zhang X, Wang Z, Hu Q, Wu J, Li Y, Ren X, Wu T, Tao X, Chen X, Li X, Xia J, Cheng B. LncRNA-p23154 promotes the invasion-metastasis potential of oral squamous cell carcinoma by regulating Glut1-mediated glycolysis. Cancer Lett. 2018; 434:172–83. https://doi.org/10.1016/j.canlet.2018.07.016 [PubMed]
- 52. Parmar MK, Torri V, Stewart L. Extracting summary statistics to perform meta-analyses of the published literature for survival endpoints. Stat Med. 1998; 17:2815–34. https://doi.org/10.1002/(sici)1097-0258(19981230)17:24<2815::aid-sim110>3.0.co;2-8 [PubMed]
- 53. Tierney JF, Stewart LA, Ghersi D, Burdett S, Sydes MR. Practical methods for incorporating summary time-to-event data into meta-analysis. Trials. 2007; 8:16. https://doi.org/10.1186/1745-6215-8-16 [PubMed]
- 54. Taggart DP, D'Amico R, Altman DG. Effect of arterial revascularisation on survival: a systematic review of studies comparing bilateral and single internal mammary arteries. Lancet. 2001; 358:870–5. https://doi.org/10.1016/S0140-6736(01)06069-X [PubMed]
- 55. Clarke M, Horton R. Bringing it all together: Lancet-Cochrane collaborate on systematic reviews. Lancet. 2001; 357:1728. https://doi.org/10.1016/S0140-6736(00)04934-5 [PubMed]
- 56. Stroup DF, Berlin JA, Morton SC, Olkin I, Williamson GD, Rennie D, Moher D, Becker BJ, Sipe TA, Thacker SB. Meta-analysis of observational studies in epidemiology: a proposal for reporting. Meta-analysis Of Observational Studies in Epidemiology (MOOSE) group. JAMA. 2000; 283:2008–12. https://doi.org/10.1001/jama.283.15.2008 [PubMed]
- 57. Cumpston M, Li T, Page MJ, Chandler J, Welch VA, Higgins JP, Thomas J. Updated guidance for trusted systematic reviews: a new edition of the Cochrane Handbook for Systematic Reviews of Interventions. Cochrane Database Syst Rev. 2019; 10:ED000142. https://doi.org/10.1002/14651858.ED000142 [PubMed]
- 58. Belachew A, Tewabe T. Neonatal sepsis and its association with birth weight and gestational age among admitted neonates in Ethiopia: systematic review and meta-analysis. BMC Pediatr. 2020; 20:55. https://doi.org/10.1186/s12887-020-1949-x [PubMed]