


Introduction
Acute myeloid leukemia (AML) is an aggressive malignant tumor characterized by high heterogeneity, variable prognosis, and high mortality. The principal factors in risk stratification and treatment options are currently composed of cytogenetic and molecular abnormalities [1, 2]. However, the inherent concrete molecular mechanisms have not yet been exactly elucidated. The development of various targeted agents has facilitated individualized treatment for AML patients, thereby ameliorating complete remission (CR) rates and prolonging survival. Regrettably, the existing targeted drug monotherapy or combination therapy with traditional chemotherapy has not yet achieved the desired efficacy [3]. Thus, discerning novel biomarkers may contribute to better comprehending the molecular basis of AML, which may play an essential role in AML diagnosis, prognostic stratification, leukemia residual monitoring, treatment response prediction, as well as the possibility of targeted drug development.
COMM domain-containing protein 7 (COMMD7), a member of the COMMD family defined by the presence of a conserved and unique motif termed the copper metabolism gene MURR1 (COMM) domain, which is located on chromosome 20q11.21, has been reported associated with tumor progression in human solid cancers [4]. COMMD7 is overexpressed in pancreatic ductal adenocarcinoma (PDAC) cells, associated with poor prognosis in PDAC patients. Inhibition of COMMD7 gene in human PDAC cell lines induces antitumor effects under stress conditions, mediated in part by the ERK1/2-mediated CyclinD 1, Bcl-2, Bax, and MMP-2 signaling pathways [5]. Another study revealed that COMMD7-overexpressed hepatocellular carcinoma (HCC) cells promoted the proliferation of naïve HCC cells [6]. On the other hand, COMMD7 was identified as a novel NEMO interacting protein involved in NF-κB signaling termination [7], the incorrect regulation of which is known to be associated with a variety of tumors [5, 8]. One study demonstrated that COMMD7 played a dual regulatory role in the NF-κB signaling pathway in HCC [9]. However, to date, the expression of COMMD7 in AML and its prognostic value remain unclear.
Therefore, in this study, we aimed to ascertain the relationship between the expression level of COMMD7 and the prognosis of AML by the following three steps: First of all, RNA sequencing (RNA-seq) data of AML samples from the cancer genome atlas (TCGA) and Genotype-Tissue Expression (GTEx) were acquired to analyze the expression of the core gene COMMD7. Subsequently, functional enrichment analysis of COMMD7 was via GO, KEGG, GSEA, immune cell infiltration analysis, and protein-protein interaction (PPI) network. Besides, the clinical significance of COMMD7 in AML was analyzed by Kaplan-Meier and Cox regression and nomogram prognostic model.
In this way, significantly altered genes and pathways would be screened out through gene enrichment analysis and subpathway enrichment analysis, the connection of which with COMMD7 may play pivotal roles in the occurrence of AML.
Materials and Methods
RNA-sequencing data and bioinformatics analysis
The pan-cancer RNA-seq data of TCGA and GTEx with toil processed uniformly were downloaded from UCSC XENA (https://xenabrowser.net/datapages/) [10–13]. Level 3 HTSeq-FPKM and HTSeq-Count data of the AML samples were obtained from the TCGA website (https://portal.gdc.cancer.gov/repository) for further analysis. This study was in full compliance with the published guidelines of TCGA and GTEx.
Differentially expressed gene (DEG) analysis
The DESeq2 R package was adopted to compare expression data of low- and high-expression of COMMD7 (cut-off value of 50%) in AML samples (HTseq-Count) to identify DEGs [14]. The top 10 DEGs were performed by heat map.
Functional enrichment analysis
DEGs with the threshold for |logFC| >1.5 and padj <0.05 were applied for functional enrichment analysis. Gene Ontology (GO) functional analysis comprising cellular component (CC), molecular function (MF), and biological process (BP), as well as Kyoto Encyclopedia of Genes and Genomes (KEGG) pathway analysis, were implemented using the ClusteProfiler package in R [15].
Gene set enrichment analysis (GSEA)
R package ClusteProfiler (3.14.3) was used for GSEA to elucidate the functional and pathway differences between the high- and low-expression groups of COMMD7 [15]. The gene set was permutated 1,000 times for each analysis. Adjusted P-value < 0.05 and FDR q-value < 0.25 were considered to be statistically significant.
Immune infiltration analysis by single-sample Gene Set Enrichment Analysis (ssGSEA)
Immune infiltration analysis of COMMD7 was conducted by ssGSEA using GSVA package in R (3.6.3). A total of 24 types of infiltrating immune cells were obtained as previously described [16]. Spearman correction was used to analyze the correlation between COMMD7 and the enrichment scores of 24 types of immune cells. Wilcoxon rank-sum test was used to analyze the enrichment scores of high- and low-COMMD7 expression groups.
PPI network
The PPI network of DEGs was predicted using the Search Tool for the Retrieval of Interacting Genes (STRING) database [17]. The interaction score threshold of 0.4 was set as the cut-off criterion. The PPI network was mapped using Cytoscape (version 3.7.1) [18], and the most significant modules in the PPI network were identified using MCODE (version 1.6.1) [19]. Selection criteria were as follows: MCODE scores >5, degree cut-off = 2, node score cut-off = 0.2, Max depth = 100, and k-score = 2. Metascape (https://metascape.org/gp/index.htm) was used to conduct the pathway and process enrichment analysis.
Prognostic model generation and prediction
In order to individualize the prediction of overall survival (OS) and event-free survival (EFS) in AML patients, a nomogram was generated using the RMS R package (version 5.1-3), which included prominent clinical characteristics and calibration plots. The calibration curves were evaluated graphically by mapping the nomogram-predicted probabilities against the observed rates, and the 45°line represented the best predictive values. Concordance index (C-index) was used to determine the discrimination of the nomogram, and the bootstrap approach was used to calculate 1000 resamples. In addition, C-index and receiver operating characteristic (ROC) were used to analyze and compare the predictive accuracy of the nomogram and separate prognostic factors. All statistical tests were double-tailed with 0.05 as the statistical significance level.
Statistical analysis
All statistical analyses and graphs were analyzed and displayed by R (3.6.2) [20]. The expression of COMMD7 in unpaired samples was analyzed by Wilcoxon rank-sum test, with Wilcoxon signed-rank test used in paired samples. Kruskal-Wallis test, Wilcoxon signed-rank test, and logistic regression analysis were used to evaluate the relationship between clinical/cytogenetic characteristics and COMMD7 expression. Cox regression analysis and Kaplan-Meier method were used to evaluate the prognostic factors. Multivariate Cox analysis was adopted to compare the impact of COMMD7 expression on survival along with other clinical features. The median COMMD7 expression was regarded as the cut-off value. In all tests, P value < 0.05 was considered statistically significant. Moreover, ROC analysis was performed on the pROC package to assess the effectiveness of the transcriptional expression of COMMD7 in distinguishing AML from healthy samples. The computed area under the curve (AUC) value ranging from 0.5 to 1.0 indicated 50-100% discrimination ability.
Results
COMMD7 expression in pan-cancers and AML
RNA-seq data from UCSC XENA (https://xenabrowser.net/datapages/) was downloaded in TCGA and GTEx formats processed uniformly through the toil process. By comparing the expression of COMMD7 normal samples in TCGA and GTEX database and corresponding tumor samples in TCGA database, COMMD7 was found significantly high expressed in 28 types of cancer (Figure 1A), including acute myelogenous leukemia (LAML) (Figure 1B).
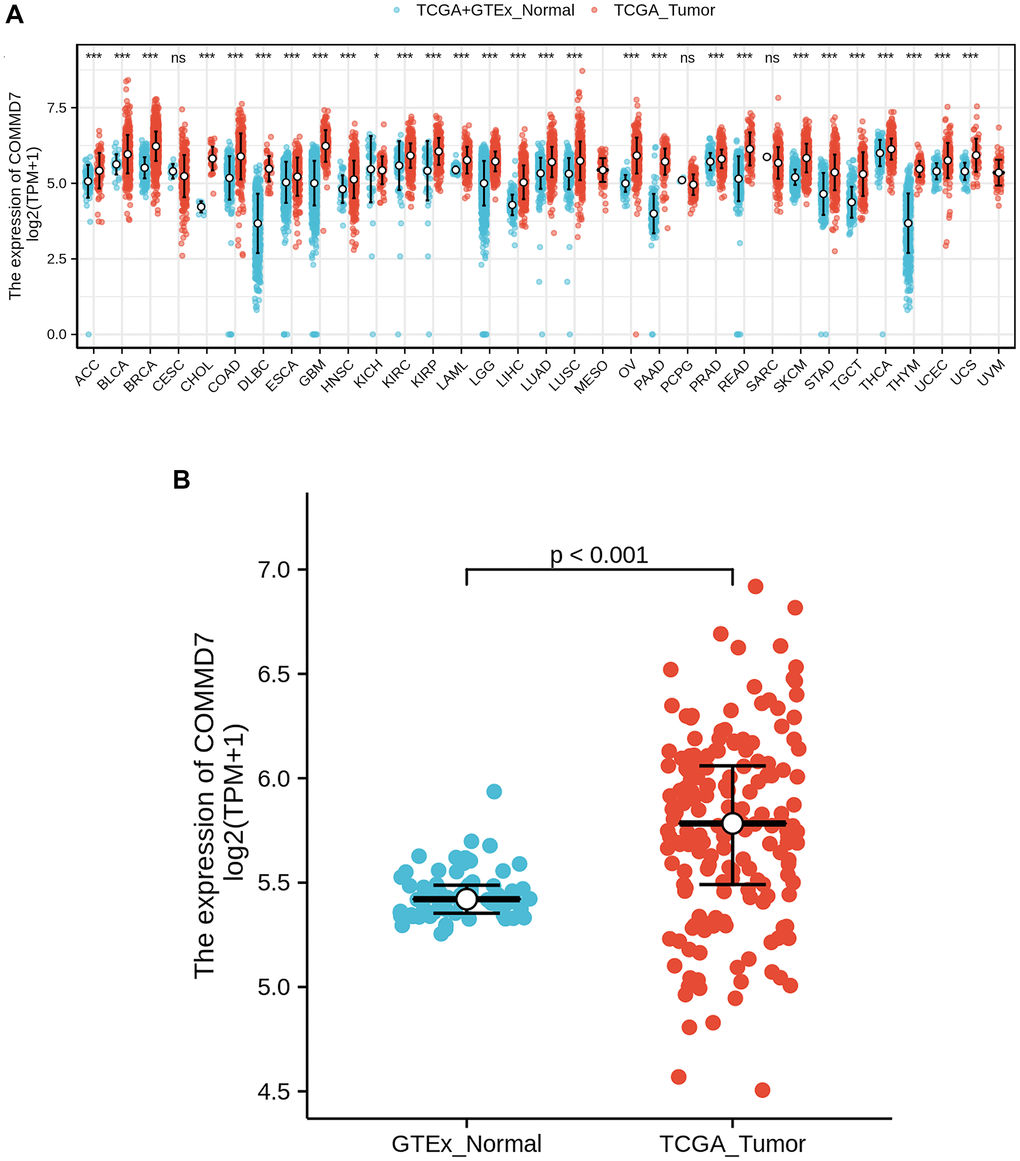
Figure 1. The higher expression of COMMD7 was showed in AML compared with normal samples. (A) Expression level of COMMD7 in paired normal and pan-cancer samples. (B) Expression level of COMMD7 in paired normal and AML samples. Analysis between two groups: Wilcoxon Rank sum test; NS: P 0.05 or higher; *P < 0.05; **P < 0.01; ***P < 0.001.
Identification of DEGs in AML samples with low- and high-expressed COMMD7
The high- and low-expression groups' gene expression profiles were analyzed for differences in the median mRNA expression. A total of 529 DEGs from gene expression RNA-seq-HTSeq-Counts, including 92 up-regulated and 437 down-regulated, were identified statistically significant between COMMD7 high- and low-expressed groups (|log fold change (logFC)| > 1.5, P < 0.05) (Figure 2A). The top five up-regulated DEGs and top five down-regulated DEGs between COMMD7 high- and low-expressed groups were illustrated by the heat map (Figure 2B).
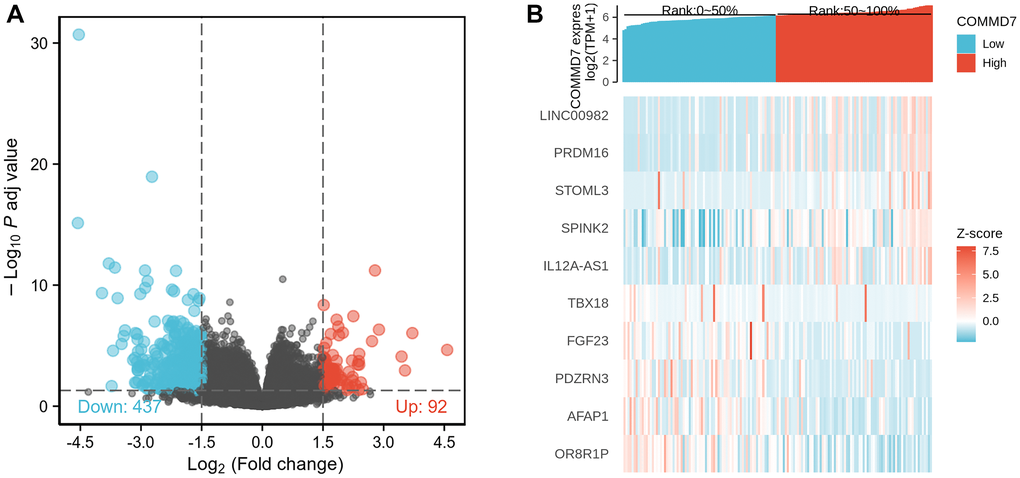
Figure 2. A total of 529 DEGs were identified as being statistically significant between COMMD7 high-expressed and low-expressed groups. (A) Volcano plot of differentially expressed genes, including 92 up-regulated and 437 down-regulated genes. Normalized expression levels were shown in descending order from green to red. (B) Heat map of the 10 differentially expressed RNAs, including 5 up-regulated genes and 5 down-regulated genes. The X-axis represents the samples, while the Y-axis denotes the differentially expressed RNAs. Green and red tones represented down-regulated and up-regulated genes, respectively.
Functional enrichment analysis of DEGs
To better understand the functional implication of 529 DEGs between high- and low- expression of COMMD7 in AML, GO and KEGG functional enrichment analysis was performed by clusterProfiler package (Supplementary Table 1, Figure 3). The association with the biological process (BP) included pattern specification process, regionalization, and mesenchyme development; cellular components (CC) included collagen-containing extracellular matrix, ion channel complex, and basement membrane; molecular function (MF) included receptor ligand activity, DNA-binding transcription activator activity/RNA polymerase II-specific, extracellular matrix structural constituent. KEGG included PI3K-Akt signaling pathway, focal adhesion, and ECM-receptor interaction.
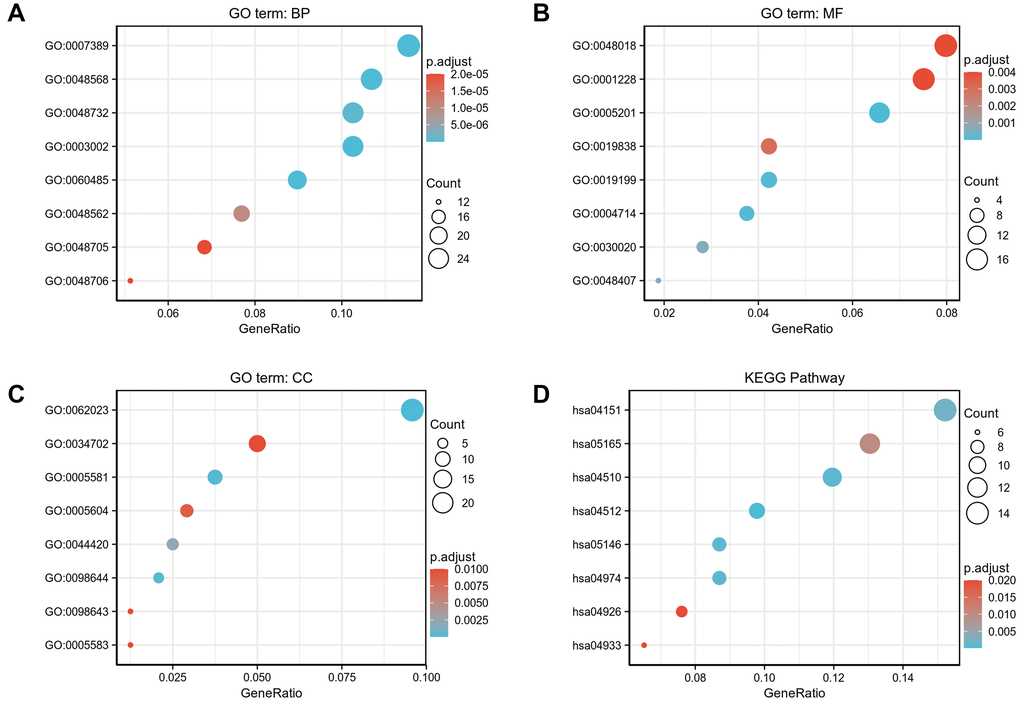
Figure 3. GO/KEGG enrichment analysis of DEGs between high- and low- COMMD7 expression in TCGA-LAML patients. (A) Enriched GO terms in the “biological process” category; (B) Enriched GO terms in the “molecular function” category. (C) Enriched GO terms in the “cellular component” category; (D) KEGG pathway annotations. The X-axis represented the proportion of DEGs, and the Y-axis represented different categories. The different colors indicate different properties, and the different sizes represent the number of DEGs.
GSEA analysis was conducted to gain further insight into the biologic pathways involved in AML with different COMMD7 expression levels. GSEA was performed between low- and high-COMMD7 expression datasets to identify critical signaling pathways involved in AML. Significant differences (FDR < 0.05, ADJ P < 0.05) were observed in the enrichment of MSigDB Collection (C2.all.v7.0.symbols.gmt) of these pathways (Supplementary Table 2 and Figure 4). Gene mutations or fusions with a good prognosis of AML, such as PML-RARa fusion, NPM1 mutation, AML-ETO fusion, and CBFB-MYH11 fusion, were enriched in COMMD7 low- expression phenotype based on NES, with adjusted P value <0.05 and FDR value <0.05 (Figure 4A–4D). On the contrary, in the high expression of COMMD7 phenotypes, factors with poor prognosis in AML, such as FLT3-ITD fusion and MLL fusion, presented significantly enriched (Figure 4I–4J). So did the pathways involved in AML and other tumor development, such as MAPK, RAS, Hedgehog, and Wnt pathways (Figure 4E–4H). Other genetic variants, such as phosphorylated TP53 targets and MYC targets, were also significantly enriched in such phenotype (Figure 4K–4L).
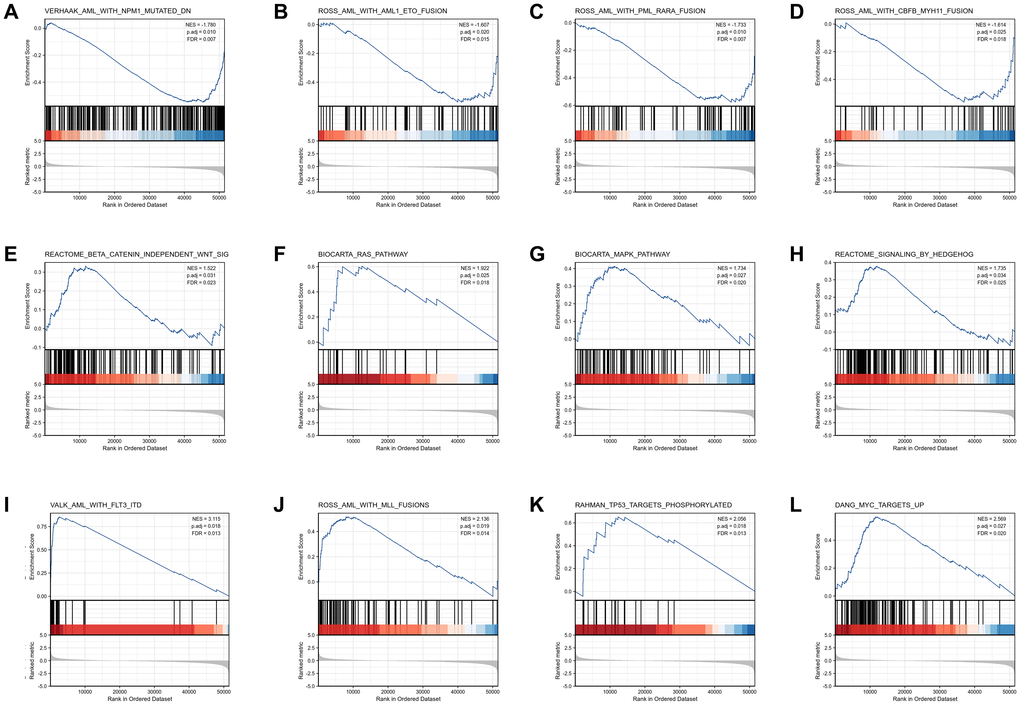
Figure 4. Enrichment plots from the gene set enrichment analysis (GSEA). (A–L) ES, enrichment score; NES, normalized ES; ADJ P-val, adjusted P-value.
Immune infiltration analysis in AML
Spearman correlation analysis showed that the expression level of COMMD7 in the AML microenvironment was correlated with the immune cell infiltration level quantified by SSGSEA. Specifically, COMMD7 was positively associated with NK CD56bright cells and active dendritic cells (aDCs) (Figure 5).
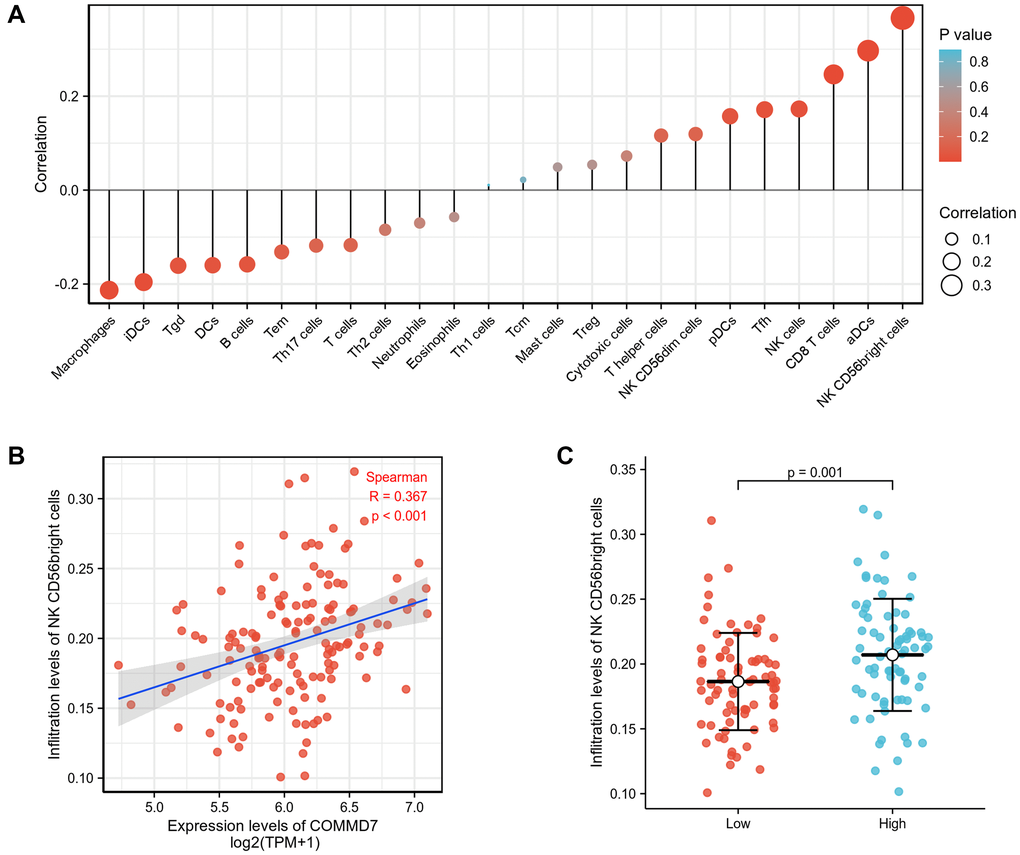
Figure 5. The expression of COMMD7 was associated with immune infiltration in the AML microenvironment. (A), The forest plots showed a positive correlation between COMMD7 and 13 immune cells, and a negative correlation between COMMD7 and 11 immune cell subsets. The size of dots showed the absolute value of Spearman r. (B) Correlation between the relative enrichment score of NK CD56(bright) cells and the expression level (TPM) of COMMD7. (C) Infiltration of NK CD56(bright) cells between low- and high-COMMD7 expressed.
PPI enrichment analysis in AML
The network of COMMD7 and its potential co-expressed genes in COMMD7-related DEGs was constructed by STRING, with a threshold of 0.4 (Supplementary Table 3). A total of 529 DEGs were screened out ( |log fold change (logFC)| >1.5, P < 0.05). The PPI network with 238 nodes and 367 edges was displayed by Cytoscape-MCODE (Figure 6A). The most significant module with a MCODE score of 7.317 contained 42 nodes and 150 edges (Figure 6B). Meantime, Metascape-MCODE was used to identify densely connected PPI network components of COMMD7, shown in Supplementary Figure 1. The three best-scoring GO terms by p-value as the functional description of the corresponding components were shown in Supplementary Table 4.
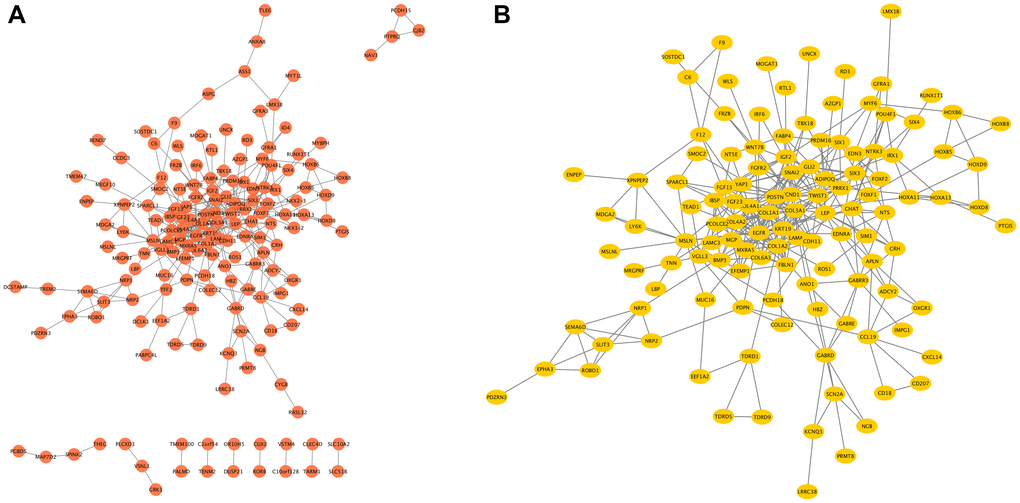
Figure 6. The PPI network of COMMD7-related DEGs and the most significant module. (A) The PPI network of DEGs was constructed using Cytoscape. (B) The most significant module was obtained from PPI network with 42 nodes and 150 edges.
Association between COMMD7 expression and clinical features and cytogenetic risks
The main clinical characteristics of AML in TCGA was shown in Table 1. A total of 151 cases (68 females and 83 males) were analyzed in this study, with an average age of 56.7 years. Among them, COMMD7 expression was low in 76 (50.3%) AML patients and high in the remaining 75 (49.3%) cases. The median COMMD7 expression (log2(TPM+1)), which is 5.783, was regarded as the cut-off value. Correlation analysis suggested that COMMD7 expression was significantly correlated with cytogenetic risk and white blood cell (WBC) count (×109/L) (P < 0.001). In addition, COMMD7 expression was significantly associated with other factors including bone marrow (BM) (P = 0.007), peripheral blood (PB) blasts (%) (P = 0.005), FAB classification (P = 0.036), FLT3 mutation (P = 0.004), IDH1 R132 mutation (P = 0.046), and NPM1 mutation (P = 0.014).
Table 1. Association between COMMD7 expression and clinicopathologic features in AML samples from the TCGA database.
| Characters | level | Low expression of COMMD7 | High expression of COMMD7 | p | test |
| n | 76 | 75 | |||
| Cytogenetic risk (%) | Favorable | 28 (36.8%) | 3 (4.1%) | <0.001 | |
| Intermediate | 29 (38.2%) | 53 (72.6%) | |||
| Poor | 19 (25.0%) | 17 (23.3%) | |||
| FAB classifications (%) | M0 | 7 (9.2%) | 8 (10.8%) | 0.036 | exact |
| M1 | 13 (17.1%) | 22 (29.7%) | |||
| M2 | 18 (23.7%) | 20 (27.0%) | |||
| M3 | 12 (15.8%) | 3 (4.1%) | |||
| M4 | 19 (25.0%) | 10 (13.5%) | |||
| M5 | 6 (7.9%) | 9 (12.2%) | |||
| M6 | 0 (0.0%) | 2 (2.7%) | |||
| M7 | 1 (1.3%) | 0 (0.0%) | |||
| Cytogenetics (%) | +8 | 6 (8.3%) | 2 (3.2%) | <0.001 | exact |
| Complex | 12 (16.7%) | 12 (19.0%) | |||
| del (5) | 0 (0.0%) | 1 (1.6%) | |||
| del (7) | 4 (5.6%) | 2 (3.2%) | |||
| inv (16) | 8 (11.1%) | 0 (0.0%) | |||
| Normal | 27 (37.5%) | 42 (66.7%) | |||
| t (15;17) | 8 (11.1%) | 3 (4.8%) | |||
| t (8;21) | 7 (9.7%) | 0 (0.0%) | |||
| t (9;11) | 0 (0.0%) | 1 (1.6%) | |||
| Gender (%) | Female | 37 (48.7%) | 31 (41.3%) | 0.457 | |
| Male | 39 (51.3%) | 44 (58.7%) | |||
| Race (%) | Asian | 0 (0.0%) | 1 (1.4%) | 0.67 | exact |
| Black or African American | 6 (8.0%) | 7 (9.5%) | |||
| White | 69 (92.0%) | 66 (89.2%) | |||
| FLT3 mutation (%) | Negative | 14 (18.9%) | 31 (42.5%) | 0.004 | |
| Positive | 60 (81.1%) | 42 (57.5%) | |||
| IDH1R132 mutation (%) | Negative | 3 (4.0%) | 10 (13.5%) | 0.046 | exact |
| Positive | 72 (96.0%) | 64 (86.5%) | |||
| IDH1R140 mutation (%) | Negative | 8 (10.5%) | 4 (5.5%) | 0.369 | exact |
| Positive | 68 (89.5%) | 69 (94.5%) | |||
| IDH1R172 mutation (%) | Negative | 2 (2.6%) | 0 (0.0%) | 0.497 | exact |
| Positive | 74 (97.4%) | 73 (100.0%) | |||
| RAS mutation (%) | Negative | 5 (6.6%) | 3 (4.1%) | 0.719 | exact |
| Positive | 71 (93.4%) | 71 (95.9%) | |||
| NPM1 mutation (%) | Negative | 10 (13.2%) | 23 (31.1%) | 0.014 | |
| Positive | 66 (86.8%) | 51 (68.9%) | |||
| DNMT3A mutation (%) | Negative | 49 (89.1%) | 43 (79.6%) | 0.273 | |
| Positive | 6 (10.9%) | 11 (20.4%) | |||
| RUNX1 mutation (%) | Negative | 46 (83.6%) | 51 (94.4%) | 0.124 | exact |
| Positive | 9 (16.4%) | 3 (5.6%) | |||
| Age (median [IQR]) | 55.50 [44.50,67.00] | 58.00 [40.50,66.00] | 0.816 | nonnorm | |
| WBC count (x10^9/L) (median [IQR]) | 11.00 [3.00,32.50] | 35.00 [8.00,78.00] | <0.001 | nonnorm | |
| BM blasts (%) (median [IQR]) | 29.00 [5.00,55.75] | 49.00 [14.00,71.50] | 0.007 | nonnorm | |
| PB blasts (%) (median [IQR]) | 61.50 [41.75,79.50] | 77.00 [57.50,86.00] | 0.005 | nonnorm |
Logistic analysis was applied to further verify the relationship between AML clinicopathological factors and the COMMD7 high-low dichotomy. As a result, high expression of COMMD7 showed a significant positive correlation with high WBC count (>20 × 109/L) (odds ratio [OR], 3.16; P < 0.001) and high PB blasts (>70%) (OR, 2.89; P = 0.002), whereas negatively correlated with FLT3 mutation (OR, 0.32; P = 0.002) and NPM1 mutation (OR, 0.34; P = 0.01) (Table 2). What is more, the potential value of COMMD7 in differentiating AML patients from healthy individuals was examined by ROC curve analysis, with the AUC of 0.760, revealing that COMMD7 had potential as a biomarker (Figure 7A). Besides, the Wilcoxon Rank SUM test was used to compare the expression of COMMD7 in patients with different clinicopathological features. The result showed that COMMD7 was significantly high-expressed in the patients with BM blasts (>20%; P = 0.014), WBC counts (>20 × 109/L; P = 0.002), FAB classification (non-M3 type; P = 0.019), cytogenetics risk (intermediate/poor; P < 0.001), NPM1 mutation (negative; P = 0.005), FLT3 mutation (negative; P = 0.004), and IDH1 R132 mutation (negative; P = 0.019) (Figure 7B–7H).
Table 2. The relationship between the clinicopathological factors of AML and COMMD7 expression by using logistic analysis.
| Characteristics | Odds Ratio in COMMD7 expression | Odds Ratio (OR) | P value |
| WBC count(x10^9/L) (>20 vs. <=20) | 150 | 3.16(1.64–6.24) | <0.001 |
| PB blasts (%) (>70 vs. <=70) | 151 | 2.89(1.50–5.66) | 0.002 |
| BM blasts (%) (>20 vs. <=20) | 151 | 1.91(0.99–3.74) | 0.055 |
| Cytogenetic risk (Poor vs. Favorable&Intermediate) | 149 | 0.91(0.43–1.93) | 0.807 |
| FLT3 mutation (Positive vs. Negative) | 147 | 0.32(0.15–0.65) | 0.002 |
| IDH1 R132 mutation (Positive vs. Negative) | 149 | 0.27(0.06–0.92) | 0.052 |
| IDH1 R140 mutation (Positive vs. Negative) | 149 | 2.03(0.61–7.89) | 0.266 |
| RAS mutation (Positive vs. Negative) | 150 | 1.67(0.39–8.37) | 0.495 |
| NPM1 mutation (Positive vs. Negative) | 150 | 0.34(0.14–0.75) | 0.01 |
| DNMT3A mutation (Positive vs. Negative) | 109 | 2.09(0.73–6.51) | 0.179 |
| RUNX1 mutation (Positive vs. Negative) | 109 | 0.30(0.06–1.08) | 0.085 |
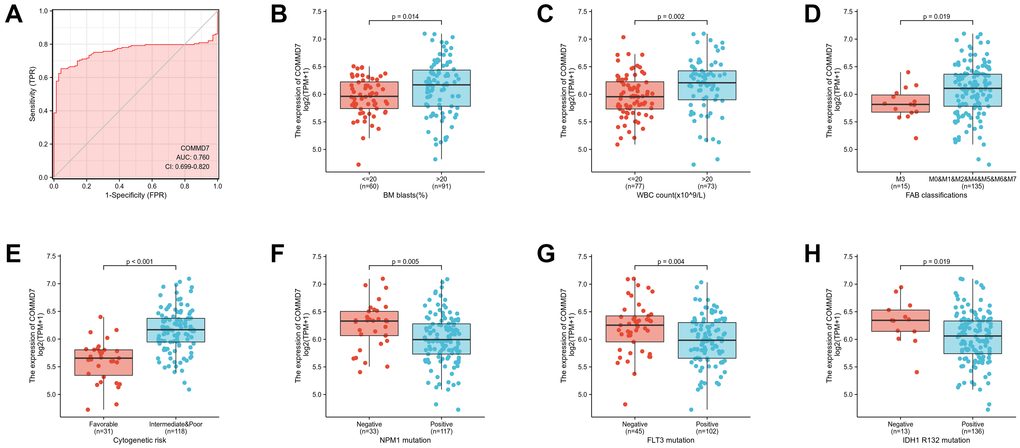
Figure 7. Association between COMMD7 expression and clinical features and cytogenetic risks. (A) The diagnostic efficacy of COMMD7 in acute myelogenous leukemia analyzed by ROC. (B–H) Association between COMMD7 expression and BM blasts (20%), WBC counts (20 × 109), FAB classification, cytogenetics risk, NPM1 mutation, FLT3 mutation, and IDH1 R132 mutation analyzed by using Wilcoxon Rank SUM test.
High COMMD7 impacted the prognosis of AML in patients with different clinicopathological status
The relationship between COMMD7 expression and prognosis was analyzed in AML patients by using Kaplan-Meier. As seen in Figure 8A, patients with high expression of COMMD7 had a strongly worse prognosis than those with low COMMD7 expression (hazard ratio [HR], 1.91(1.25-2.93); P = 0.003). Kaplan-Meier analysis presented that high expressed COMMD7 correlated with poor prognosis in the subgroups of BM blasts≥ 20% (P = 0.024), PB blasts ≤ 70% (P = 0.007), age >60 (P = 0.009), FLT3 mutation negative (P = 0.009), IDH1 R132 mutation positive (P = 0.001), R140 mutation positive (P = 0.002), R172 mutation positive (P = 0.001), NPM1 mutation positive (P < 0.001), RAS mutation positive (P = 0.002), RUX1 mutation negative (P = 0.004), and DNMT3A mutation negative (P = 0.019) (Figure 8B–8L).
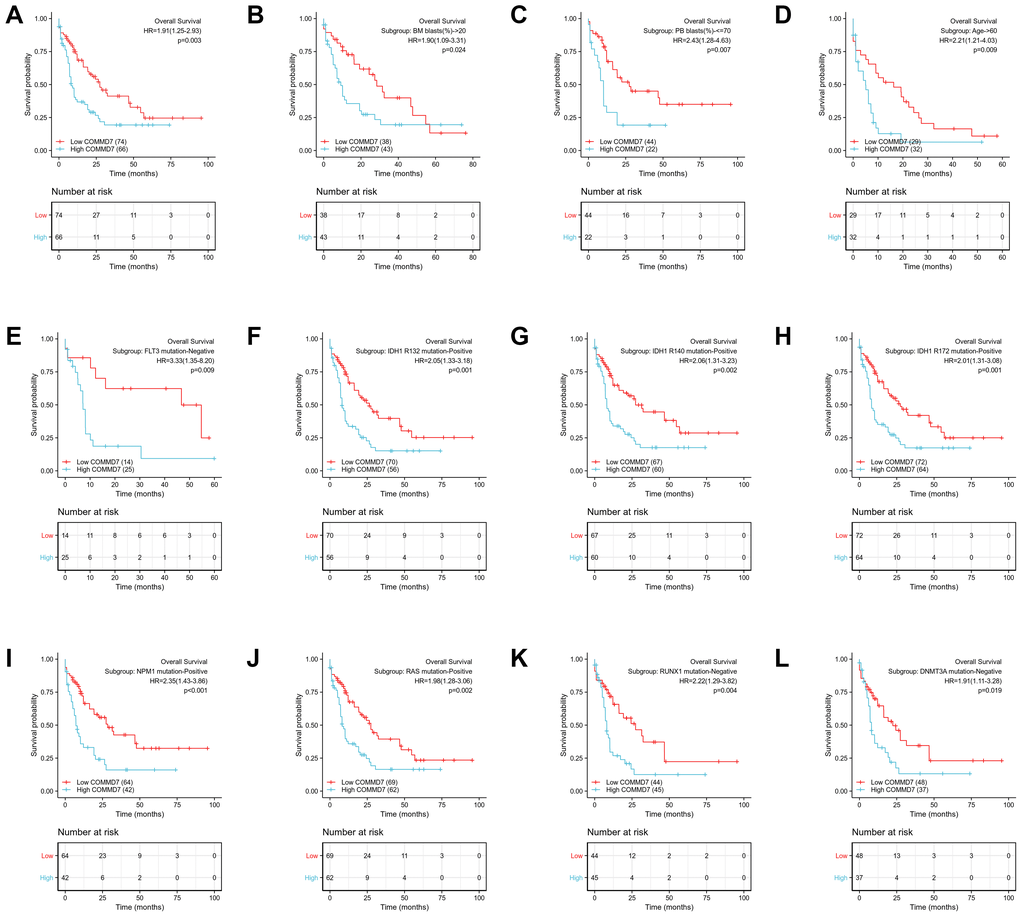
Figure 8. High expression of COMMD7 was associated with poor OS in AML patients. (A) Kaplan-Meier curves in all AML patients. (B) Kaplan-Meier curves in AML patients with BM blasts > 20%. (C) Kaplan-Meier curves in AML patients with PB blasts ≤ 70%. (D) Kaplan-Meier curves in AML patients with age ≥ 60. (E–L) Kaplan-Meier curves in subgroups with FLT3 mutation-negative, IDH1 R132 mutation-positive, IDH1 R140 mutation-positive, R172 mutation-positive, NPM1 mutation-positive, RAS mutation-positive, RUX1 mutation-negative, and DNMT3A mutation-negative in AML patients.
Likewise, the forest plot illustrated the prognostic value of COMMD7 in various AML subtypes using univariate Cox regression, with a conclusion consistent with the above results (Figure 9).
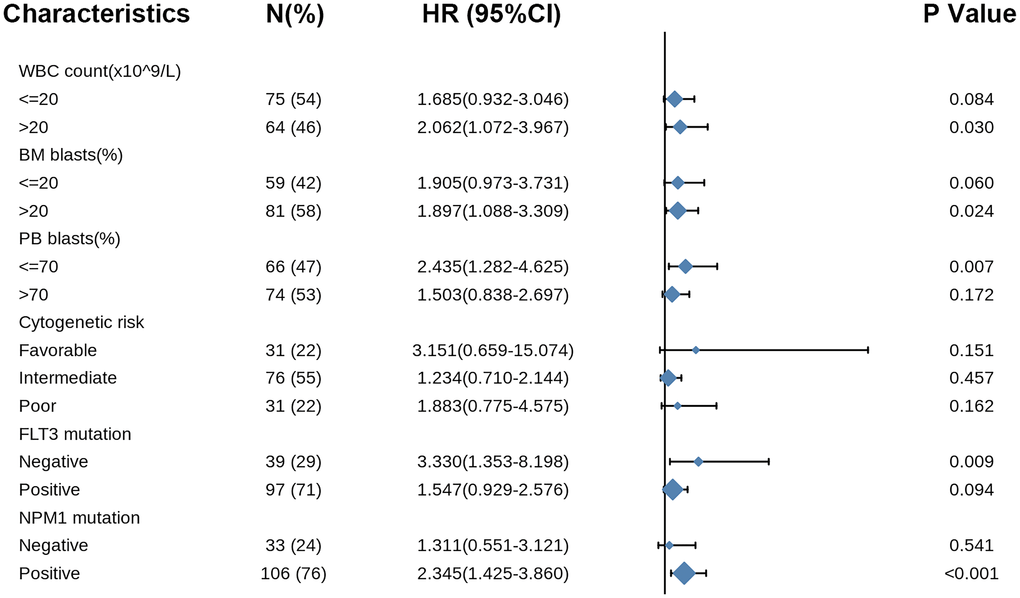
Figure 9. Forest plot showed that COMMD7 predicted poor prognosis in the subgroup of WBC count (>20 × 109/L) (HR = 2.062, P = 0.030), BM blasts (>20%) (HR = 1.897, P = 0.024), PB blasts (>70%) (HR = 2.435, P = 0.007), FLT3 mutation negative (HR = 3.330, p = 0.009), and NPM1 mutation positive (HR = 2.345, P < 0.001).
Hereafter, univariate Cox proportional hazards regression was used to assess the factors influencing OS, disclosing that COMMD7 (high- vs. low-, P = 0.003) was a predictive factor for worse OS, so did cytogenetic risk (poor & intermediate vs. favorable, P < 0.001) and age (>60 vs. ≤60, P < 0.001) (Table 3). Cytogenetic risk, age and COMMD7 were then included in multivariate Cox regression, suggesting that age > 60 (P < 0.001) and high expression of COMMD7 (P = 0.01) were independent prognostic factors for worse OS (P < 0.05).
Table 3. Univariate and multivariate Cox’s regression analysis of factors associated with OS in AML.
| Characteristics | HR (95% CI) Univariate analysis | P value Univariate analysis | HR (95% CI) Multivariate analysis | P value Multivariate analysis |
| WBC count (x109/L) (>20 vs. <=20) | 1.161 (0.760–1.772) | 0.49 | ||
| PB blasts (%) (>70 vs. <=70) | 1.230 (0.806–1.878) | 0.338 | ||
| BM blasts(%) (>20 vs. <=20) | 1.165 (0.758–1.790) | 0.486 | ||
| Cytogenetic risk (Favorable vs. Poor&Intermediate) | 0.312 (0.160–0.606) | <0.001 | 0.535 (0.261–1.097) | 0.088 |
| Gender (Male vs. Female) | 1.030 (0.674–1.572) | 0.892 | ||
| Age (>60 vs. <=60) | 3.333 (2.164–5.134) | <0.001 | 3.374 (2.130–5.344) | <0.001 |
| Race (White vs. Asian&Black or African American) | 1.200 (0.485–2.966) | 0.693 | ||
| FLT3 mutation (Positive vs. Negative) | 0.787 (0.496–1.248) | 0.309 | ||
| IDH1 R132 mutation (Positive vs. Negative) | 1.702 (0.689–4.205) | 0.249 | ||
| IDH1 R140 mutation (Positive vs. Negative) | 0.884 (0.442–1.769) | 0.727 | ||
| IDH1 R172 mutation (Positive vs. Negative) | 1.641 (0.228–11.804) | 0.623 | ||
| RAS mutation (Positive vs. Negative) | 1.555 (0.568–4.254) | 0.39 | ||
| NPM1 mutation (Positive vs. Negative) | 0.879 (0.546–1.416) | 0.596 | ||
| DNMT3A mutation (Positive vs. Negative) | 1.404 (0.731–2.696) | 0.308 | ||
| RUNX1 mutation (Positive vs. Negative) | 1.119 (0.553–2.267) | 0.754 | ||
| COMMD7 (High vs. Low) | 1.914 (1.251–2.927) | 0.003 | 1.850 (1.158–2.954) | 0.01 |
Prognostic model of COMMD7 in AML
To better predict AML patients' prognosis, a nomogram was constructed based on the Cox regression analysis results using the RMS R package (Figure 10A). Three independent prognostic factor variables, age, cytogenetic risk, and COMMD7 expression, were included in the model, selected into the prediction model at a statistical significance level of 0.2. Based on multivariate Cox analysis, a point scale was used to assign points to these variables. The straight line was drawn upward to determine the points of the variables, and the sum of the points assigned to each variable was rescaled to a range of 0–100. The points of each variable were accumulated and recorded as the total points. The probability of AML patient survival at 1-, 3-, and 5-year was determined by drawing a line from the total point axis straight down to the outcome axis. The 1-year survival probability was determined by drawing a vertical line downward on the total point axis along the 162-direction ending axis, suggesting the probability of 1-year survival < 20%, both of the probability of 3- and 5-year < 10%. The prediction results of the nomogram calibration curve of OS were consistent with all patients' observation results (Figure 10B).
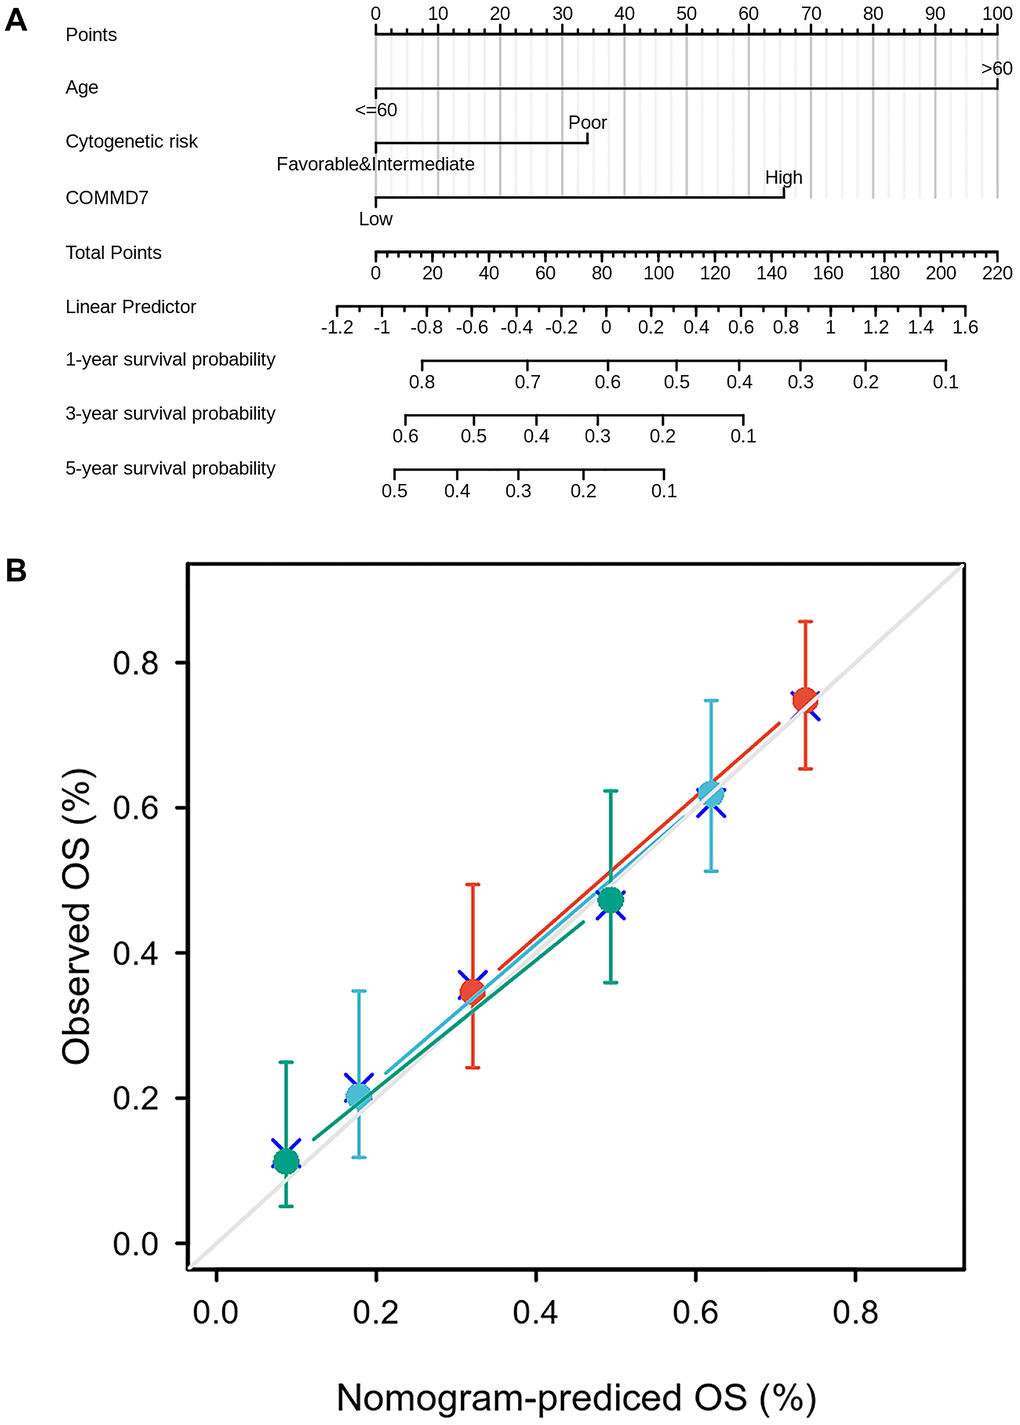
Figure 10. A prognostic predictive model of COMMD7 in AML. (A) Nomogram for predicting the probability of 1-, 3-, 5-year OS for AML. (B) Calibration plot of the nomogram for predicting the probability of OS at 1, 3, and 5 years.
Discussion
COMMD7 is a member of the COMMD family defined by the presence of a conserved and unique motif termed the COMM (copper metabolism gene MURR1) domain, which functions as an interface for protein-protein interactions [4]. Several studies had revealed that COMMD7 was involved in the regulation of NF-kappa B signaling [5, 8]. It was known that un-correct regulation of the NF-kB pathway had been linked to various tumors. Studies in several tumors such as hepatocellular carcinoma and pancreatic ductal adenocarcinoma have evaluated the expression and function of COMMD7 in tumor development [5, 6]. However, little is known about the expression of COMMD7 and prognostic value in AML.
The present study's central result was that high-expressed COMMD7 in AML was associated with high BM/PB blasts, intermediate-high cytogenetic risk, and poor prognosis. Via GSEA gene enrichment analysis, low-expressed COMMD7 was associated with NPM1 mutation, PML-RARa fusion, AML-ETO fusion, and CBFB-MYH11 fusion, which are excellent prognostic factors. In contrast, high-expressed COMMD7 was associated with Wnt, RAS, MAPK, and Hedgehog pathways, suggesting that COMMD7 was not only a potential prognostic biomarker but also a promising therapeutic target by affecting oncogenesis-related pathways in AML.
It is worth noting that the most clinically relevant finding was that high expression of COMMD7 was associated with poor survival. Multivariate Cox regression analysis showed that high expression of COMMD7 was another independent prognostic factor besides age (>60 years). The establishment of the nomogram prediction model further confirmed the predictive effect of COMMD7 expression on prognosis. Therefore, COMMD7 may serve as a new adverse prognostic factor in AML patients.
More importantly, it was found that high expression of COMMD7 predicted poor prognosis in a subgroup of AML patients with NPM1 mutation. NPM1 mutation occurs in about 30% of newly diagnosed AML, which is to date one of the most frequent genetic alterations identified in AML. Isolated NPM1 mutations are generally considered to have a positive prognostic effect on AML [21, 22]. Unfortunately, approximately 30-70% of AML patients with NPM1 mutations relapse within five years, with age and FLT3-ITD mutations reported to be influencing factors [23, 24]. The relevance of cooperation between NPM1 and other mutations with different outcomes in driving AML has been reported in several other studies [21, 22, 25, 26]. In view that the pivotal elements and mechanisms are still not completely clear, herein, we discovered that AML patients with high expression of COMMD7 leading to NPM1 mutations had a poor prognosis. Further research is required to verify the effect of high COMMD7 expression on AML with NPM1-mutation and explore its underlying mechanism.
In addition, Wnt, RAS, MAPK, and Hedgehog pathways were found to be closely relevant with high expression of COMMD7 in AML. Wnt signaling was convinced to be up-regulated through a variety of mechanisms in AML that are necessary for the maintenance of leukemia stem cells [27, 28]. A high incidence of gene mutations in RAS/MAPK pathway was identified in AML. Hedgehog pathway was related to AML cell resistance to drugs and radiotherapy, resulting in poor prognosis in AML patients. Here, COMMD7 was found to be associated with these pathways and may be involved in the genesis and maintenance of leukemia cells, calling for further studies to confirm our results and explore the specific regulatory mechanism of COMMD7 as well as these pathways.
In immune cell infiltration analysis, high expression of COMMD7 was associated with higher CD56(bright) NK cells. Human NK cells account for 10–15% of circulating lymphocytes, of which CD56(bright) and CD56(dim) NK cells are the primary two subsets. CD56(bright) NK cells have been considered as immature NK cells, precursors of CD56(dim) NK cells. Compared with CD56(dim) NK cells, CD56(bright) NK cells are characterized by high cytokine production and low cytotoxic capacity [29–31]. Notably, NK cells play a “double-edged sword” role in the generation of tumors. Traditionally, NK cells have been considered to play an important role in immunosurveillance and thus have antitumor effects [32]. Recently, a series of studies have shown that CD56(bright) NK cells promote tumor development [31, 33–35]. CD56(bright) NK cell infiltration increased in lung cancer, colorectal cancer, breast cancer, et al. [33, 34, 36, 37]. Promoting tumor angiogenesis, tumor immune escape, and loss of activity to kill tumor stem cells have been demonstrated to be involved in promoting the malignant progression of CD56(bright) NK cells [33, 38, 39]. Cytokines in the tumor microenvironment play a regulatory role in promoting CD56(bright) NK cell tumors [39, 40]. In this study, NK CD56(bright) cells' infiltration was positively correlated with COMMD7 expression. Through Kaplan-Meier survival analysis, high COMMD7 expression was found to be associated with poor prognosis in AML patients. AML blast cells have been reported to evade NK cell immunosurveillance by diminishing the expression of several activated receptors [29]. However, the relationship between CD56(bright) NK cells and AML has not been fully elaborated. Hence, according to our findings and the above research reports, the relationship between COMMD7 and CD56(bright) and CD56(dim) NK cells, and whether COMMD7 and CD56(bright) NK cells are involved in the immune escape in AML still deserve further exploration.
Moreover, Cox analysis in the present study indicated that COMMD7 might have the ability to become an independent predictor of poor prognosis in AML after adjusting for routine clinical features. Multivariate Cox regression analysis showed that age>60 years and high COMMD7 expression were the independent prognostic factors for OS deterioration. A nomogram prognosis map was constructed by combining COMMD7 with cytogenetic risk and age to obtain a more accurate prognosis prediction model. The C-index COMMD7-related Cox model predicted the OS to be 0.754 (0.728–0.780). The calibration chart showed optimal agreement between the predictions of the nomogram associated with COMMD7 and the actual observations of 1-year, 3-year, and 5-year OS probabilities. As previously reported, older age (>60), high cytogenetic risk, high WBC count (>20 × 109/L), FLT3 mutation-positive, and NPM1 mutation-negative were independent factors predicting poor prognosis of AML [1]. According to the Cox analysis and nomogram model, it seems that COMMD7 may potentially have better predictive power than cytogenetic risk, WBC count, FLT3 mutation status, and NPM1 mutation status. From this point of view, our model may provide a personalized score for individual AML patients.
However, the limitation of this study lies in the small sample size. Also, to ensure greater reliability and representativeness of the findings and assumptions, the sample should be expanded for further research in the future. Clinical samples should be used to verify the prognostic predictive role of COMMD7 mRNA and protein in AML. Experimental validation should also be performed to investigate the regulatory mechanisms between COMMD7 and the genetic alterations (such as NPM1 and FLT3) and essential pathways selected by GSEA analysis. A mass of plans has been formulated for some recent laboratory work.
Conclusions
In summary, this study disclosed for the first time that COMMD7 expression increased in AML, which is also related to poor prognosis. Moreover, Wnt, RAS, MAPK, and Hedgehog pathways may be the essential pathways participating in the regulation of COMMD7 in AML. More intriguingly, COMMD7 may reverse the NPM1 mutation from a good role in AML. Further verification should be carried out to reveal the biological impacts of COMMD7 in AML.
Supplementary Materials
Author Contributions
HYT, KFL, and YL were responsible for the design of the study, data acquisition, and analysis, as well as drafting the manuscript. LGC, HZ, and LW participated in data acquisition, analysis, and interpretation. DYL and ZZZ participated in drafting the manuscript and troubleshooting. YL, RZP, PSZ, XHD, and KYS participated in its design and coordination. All authors read and approved the final manuscript.
Conflicts of Interest
The authors declare no conflicts of interest.
Funding
This study was supported by the fund from The National Natural Science Foundation of China (81500127).
Editorial Note
This corresponding author has a verified history of publications using a personal email address for correspondence
References
- 1. Papaemmanuil E, Gerstung M, Bullinger L, Gaidzik VI, Paschka P, Roberts ND, Potter NE, Heuser M, Thol F, Bolli N, Gundem G, Van Loo P, Martincorena I, et al. Genomic Classification and Prognosis in Acute Myeloid Leukemia. N Engl J Med. 2016; 374:2209–21. https://doi.org/10.1056/NEJMoa1516192 [PubMed]
- 2. Lindsley RC, Mar BG, Mazzola E, Grauman PV, Shareef S, Allen SL, Pigneux A, Wetzler M, Stuart RK, Erba HP, Damon LE, Powell BL, Lindeman N, et al. Acute myeloid leukemia ontogeny is defined by distinct somatic mutations. Blood. 2015; 125:1367–76. https://doi.org/10.1182/blood-2014-11-610543 [PubMed]
- 3. Döhner H, Estey E, Grimwade D, Amadori S, Appelbaum FR, Büchner T, Dombret H, Ebert BL, Fenaux P, Larson RA, Levine RL, Lo-Coco F, Naoe T, et al. Diagnosis and management of AML in adults: 2017 ELN recommendations from an international expert panel. Blood. 2017; 129:424–47. https://doi.org/10.1182/blood-2016-08-733196 [PubMed]
- 4. Burstein E, Hoberg JE, Wilkinson AS, Rumble JM, Csomos RA, Komarck CM, Maine GN, Wilkinson JC, Mayo MW, Duckett CS. COMMD proteins, a novel family of structural and functional homologs of MURR1. J Biol Chem. 2005; 280:22222–32. https://doi.org/10.1074/jbc.M501928200 [PubMed]
- 5. You N, Li J, Gong Z, Huang X, Wang W, Wang L, Wu K, Zheng L. COMMD7 functions as molecular target in pancreatic ductal adenocarcinoma. Mol Carcinog. 2017; 56:607–24. https://doi.org/10.1002/mc.22520 [PubMed]
- 6. You N, Li J, Huang X, Wu K, Tang Y, Wang L, Li H, Mi N, Zheng L. COMMD7 promotes hepatocellular carcinoma through regulating CXCL10. Biomed Pharmacother. 2017; 88:653–57. https://doi.org/10.1016/j.biopha.2017.01.046 [PubMed]
- 7. Esposito E, Napolitano G, Pescatore A, Calculli G, Incoronato MR, Leonardi A, Ursini MV. COMMD7 as a novel NEMO interacting protein involved in the termination of NF-κB signaling. J Cell Physiol. 2016; 231:152–61. https://doi.org/10.1002/jcp.25066 [PubMed]
- 8. Zheng L, You N, Huang X, Gu H, Wu K, Mi N, Li J. COMMD7 Regulates NF-κB Signaling Pathway in Hepatocellular Carcinoma Stem-like Cells. Mol Ther Oncolytics. 2018; 12:112–23. https://doi.org/10.1016/j.omto.2018.12.006 [PubMed]
- 9. Zheng L, Deng CL, Wang L, Huang XB, You N, Tang YC, Wu K, Liang P, Mi N, Li J. COMMD7 is correlated with a novel NF-κB positive feedback loop in hepatocellular carcinoma. Oncotarget. 2016; 7:32774–84. https://doi.org/10.18632/oncotarget.9047 [PubMed]
- 10. Vivian J, Rao AA, Nothaft FA, Ketchum C, Armstrong J, Novak A, Pfeil J, Narkizian J, Deran AD, Musselman-Brown A, Schmidt H, Amstutz P, Craft B, et al. Toil enables reproducible, open source, big biomedical data analyses. Nat Biotechnol. 2017; 35:314–16. https://doi.org/10.1038/nbt.3772 [PubMed]
- 11. Goldman MJ, Craft B, Hastie M, Repečka K, McDade F, Kamath A, Banerjee A, Luo Y, Rogers D, Brooks AN, Zhu J, Haussler D. Visualizing and interpreting cancer genomics data via the Xena platform. Nat Biotechnol. 2020; 38:675–78. https://doi.org/10.1038/s41587-020-0546-8 [PubMed]
- 12. Li K, Luo H, Luo H, Zhu X. Clinical and prognostic pan-cancer analysis of m6A RNA methylation regulators in four types of endocrine system tumors. Aging (Albany NY). 2020; 12:23931–44. https://doi.org/10.18632/aging.104064 [PubMed]
- 13. Wang JD, Zhou HS, Tu XX, He Y, Liu QF, Liu Q, Long ZJ. Prediction of competing endogenous RNA coexpression network as prognostic markers in AML. Aging (Albany NY). 2019; 11:3333–47. https://doi.org/10.18632/aging.101985 [PubMed]
- 14. Love MI, Huber W, Anders S. Moderated estimation of fold change and dispersion for RNA-seq data with DESeq2. Genome Biol. 2014; 15:550. https://doi.org/10.1186/s13059-014-0550-8 [PubMed]
- 15. Yu G, Wang LG, Han Y, He QY. clusterProfiler: an R package for comparing biological themes among gene clusters. OMICS. 2012; 16:284–87. https://doi.org/10.1089/omi.2011.0118 [PubMed]
- 16. Bindea G, Mlecnik B, Tosolini M, Kirilovsky A, Waldner M, Obenauf AC, Angell H, Fredriksen T, Lafontaine L, Berger A, Bruneval P, Fridman WH, Becker C, et al. Spatiotemporal dynamics of intratumoral immune cells reveal the immune landscape in human cancer. Immunity. 2013; 39:782–95. https://doi.org/10.1016/j.immuni.2013.10.003 [PubMed]
- 17. Szklarczyk D, Gable AL, Lyon D, Junge A, Wyder S, Huerta-Cepas J, Simonovic M, Doncheva NT, Morris JH, Bork P, Jensen LJ, Mering CV. STRING v11: protein-protein association networks with increased coverage, supporting functional discovery in genome-wide experimental datasets. Nucleic Acids Res. 2019; 47:D607–D613. https://doi.org/10.1093/nar/gky1131 [PubMed]
- 18. Demchak B, Hull T, Reich M, Liefeld T, Smoot M, Ideker T, Mesirov JP. Cytoscape: the network visualization tool for GenomeSpace workflows. F1000Res. 2014; 3:151. https://doi.org/10.12688/f1000research.4492.2 [PubMed]
- 19. Bandettini WP, Kellman P, Mancini C, Booker OJ, Vasu S, Leung SW, Wilson JR, Shanbhag SM, Chen MY, Arai AE. MultiContrast Delayed Enhancement (MCODE) improves detection of subendocardial myocardial infarction by late gadolinium enhancement cardiovascular magnetic resonance: a clinical validation study. J Cardiovasc Magn Reson. 2012; 14:83. https://doi.org/10.1186/1532-429X-14-83 [PubMed]
- 20. Isidro-Sánchez J, Akdemir D, Montilla-Bascón G. Genome-Wide Association Analysis Using R. Methods Mol Biol. 2017; 1536:189–207. https://doi.org/10.1007/978-1-4939-6682-0_14 [PubMed]
- 21. Falini B, Brunetti L, Sportoletti P, Martelli MP. NPM1-mutated acute myeloid leukemia: from bench to bedside. Blood. 2020; 136:1707–21. https://doi.org/10.1182/blood.2019004226 [PubMed]
- 22. Kunchala P, Kuravi S, Jensen R, McGuirk J, Balusu R. When the good go bad: Mutant NPM1 in acute myeloid leukemia. Blood Rev. 2018; 32:167–83. https://doi.org/10.1016/j.blre.2017.11.001 [PubMed]
- 23. Patel SS, Kuo FC, Gibson CJ, Steensma DP, Soiffer RJ, Alyea EP
3rd , Chen YA, Fathi AT, Graubert TA, Brunner AM, Wadleigh M, Stone RM, DeAngelo DJ, et al. High NPM1-mutant allele burden at diagnosis predicts unfavorable outcomes in de novo AML. Blood. 2018; 131:2816–25. https://doi.org/10.1182/blood-2018-01-828467 [PubMed] - 24. Webersinke G, Kranewitter W, Deutschbauer S, Zach O, Hasenschwandtner S, Wiesinger K, Erdel M, Marschon R, Böhm A, Tschurtschenthaler G. Switch of the mutation type of the NPM1 gene in acute myeloid leukemia (AML): relapse or secondary AML? Blood Cancer J. 2014; 4:e221. https://doi.org/10.1038/bcj.2014.42 [PubMed]
- 25. Pepper M, Tan B. Acute myeloid leukemia with NPM1 and FLT3 ITD mimicking acute promyelocytic leukemia. Blood. 2020; 136:1467. https://doi.org/10.1182/blood.2020007198 [PubMed]
- 26. Cocciardi S, Dolnik A, Kapp-Schwoerer S, Rücker FG, Lux S, Blätte TJ, Skambraks S, Krönke J, Heidel FH, Schnöder TM, Corbacioglu A, Gaidzik VI, Paschka P, et al. Clonal evolution patterns in acute myeloid leukemia with NPM1 mutation. Nat Commun. 2019; 10:2031. https://doi.org/10.1038/s41467-019-09745-2 [PubMed]
- 27. Gruszka AM, Valli D, Alcalay M. Wnt Signalling in Acute Myeloid Leukaemia. Cells. 2019; 8:1403. https://doi.org/10.3390/cells8111403 [PubMed]
- 28. Simon M, Grandage VL, Linch DC, Khwaja A. Constitutive activation of the Wnt/beta-catenin signalling pathway in acute myeloid leukaemia. Oncogene. 2005; 24:2410–20. https://doi.org/10.1038/sj.onc.1208431 [PubMed]
- 29. Sanchez-Correa B, Campos C, Pera A, Bergua JM, Arcos MJ, Bañas H, Casado JG, Morgado S, Duran E, Solana R, Tarazona R. Natural killer cell immunosenescence in acute myeloid leukaemia patients: new targets for immunotherapeutic strategies? Cancer Immunol Immunother. 2016; 65:453–63. https://doi.org/10.1007/s00262-015-1720-6 [PubMed]
- 30. Montaldo E, Vacca P, Moretta L, Mingari MC. Development of human natural killer cells and other innate lymphoid cells. Semin Immunol. 2014; 26:107–13. https://doi.org/10.1016/j.smim.2014.01.006 [PubMed]
- 31. Michel T, Poli A, Cuapio A, Briquemont B, Iserentant G, Ollert M, Zimmer J. Human CD56bright NK Cells: An Update. J Immunol. 2016; 196:2923–31. https://doi.org/10.4049/jimmunol.1502570 [PubMed]
- 32. Klein E, Vánky F, Vose BM. Natural killer and tumor recognizing lymphocyte activity in tumor patients. Haematologia (Budap). 1978-1979; 12:107–12. [PubMed]
- 33. Bruno A, Focaccetti C, Pagani A, Imperatori AS, Spagnoletti M, Rotolo N, Cantelmo AR, Franzi F, Capella C, Ferlazzo G, Mortara L, Albini A, Noonan DM. The proangiogenic phenotype of natural killer cells in patients with non-small cell lung cancer. Neoplasia. 2013; 15:133–42. https://doi.org/10.1593/neo.121758 [PubMed]
- 34. Bruno A, Bassani B, D'Urso DG, Pitaku I, Cassinotti E, Pelosi G, Boni L, Dominioni L, Noonan DM, Mortara L, Albini A. Angiogenin and the MMP9-TIMP2 axis are up-regulated in proangiogenic, decidual NK-like cells from patients with colorectal cancer. FASEB J. 2018; 32:5365–77. https://doi.org/10.1096/fj.201701103R [PubMed]
- 35. Poli A, Michel T, Thérésine M, Andrès E, Hentges F, Zimmer J. CD56bright natural killer (NK) cells: an important NK cell subset. Immunology. 2009; 126:458–65. https://doi.org/10.1111/j.1365-2567.2008.03027.x [PubMed]
- 36. Rocca YS, Roberti MP, Arriaga JM, Amat M, Bruno L, Pampena MB, Huertas E, Loria FS, Pairola A, Bianchini M, Mordoh J, Levy EM. Altered phenotype in peripheral blood and tumor-associated NK cells from colorectal cancer patients. Innate Immun. 2013; 19:76–85. https://doi.org/10.1177/1753425912453187 [PubMed]
- 37. Mamessier E, Sylvain A, Thibult ML, Houvenaeghel G, Jacquemier J, Castellano R, Gonçalves A, André P, Romagné F, Thibault G, Viens P, Birnbaum D, Bertucci F, et al. Human breast cancer cells enhance self tolerance by promoting evasion from NK cell antitumor immunity. J Clin Invest. 2011; 121:3609–22. https://doi.org/10.1172/JCI45816 [PubMed]
- 38. Bhatia A, Kumar Y. Cellular and molecular mechanisms in cancer immune escape: a comprehensive review. Expert Rev Clin Immunol. 2014; 10:41–62. https://doi.org/10.1586/1744666X.2014.865519 [PubMed]
- 39. Konjević GM, Vuletić AM, Mirjačić Martinović KM, Larsen AK, Jurišić VB. The role of cytokines in the regulation of NK cells in the tumor environment. Cytokine. 2019; 117:30–40. https://doi.org/10.1016/j.cyto.2019.02.001 [PubMed]
- 40. Maghazachi AA. Role of chemokines in the biology of natural killer cells. Curr Top Microbiol Immunol. 2010; 341:37–58. https://doi.org/10.1007/82_2010_20 [PubMed]