Participant characteristics
For the SEER cohort (n = 1,162,819), 148 duplicated participants were initially excluded. Then, participants without follow-up time (n = 12,299), without grade (n = 96,580), without clinical TNM stage (n = 323,315), and without prostatectomy or radiotherapy (n = 31,083) information were excluded. Participants who received both prostatectomy and radiotherapy and those who received other therapies were excluded (n = 292,232). Next, patients with no information on TNM stage were excluded (n = 599,132). Eventually, 131,345 participants were included for further analysis. A flowchart of participant selection is shown in Figure 1A.
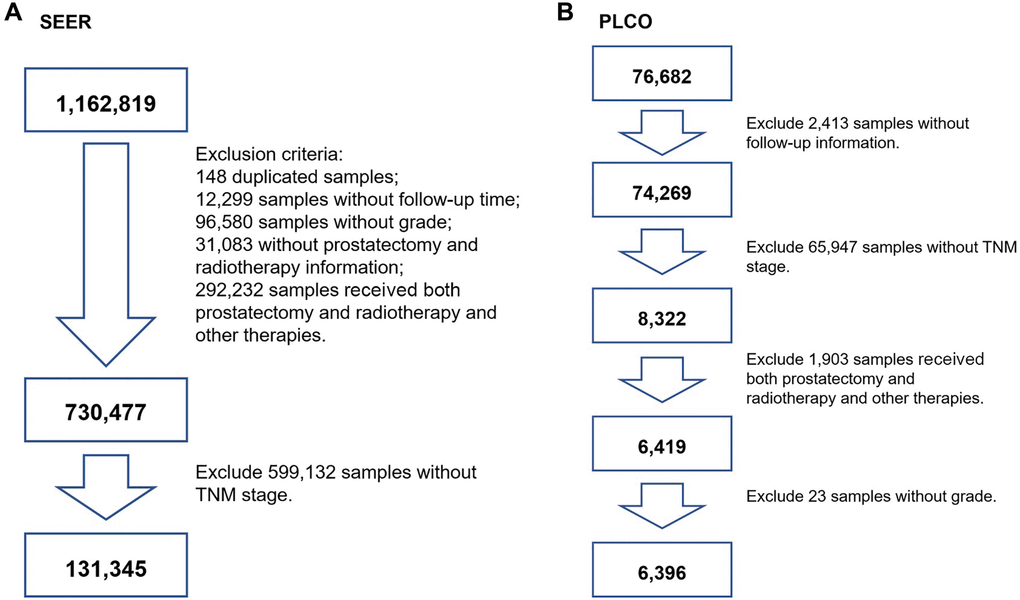
Figure 1. The flowchart of screening participants using the SEER and PLCO cohort. (A) for SEER screening, (B) for PLCO screening. TNM stage: tumor node metastasis stage.
For the PLCO cohort (n = 76,682), we initially excluded participants who had a nonresponse form (n = 2,413). Participants without clinical TNM stage were also excluded (n = 65,947). Participants who received both prostatectomy and radiotherapy and those who received other therapies were excluded (n = 1,903). Then, patients with aberrant grade were excluded (n = 23). Finally, participants who underwent prostatectomy or received radiotherapy were used (n = 6,396). A flowchart is presented in Figure 1B.
There were 131,345 participants from the SEER cohort, including 74,663 (56.85%) men undergoing RP and 56,682 (43.16%) men who received RT. A total of 6,396 PCa patients were involved in the PLCO cohort, including 2,961 (46.27%) men treated with RP and 3,435 (53.73%) with RT. Information on the mean age at diagnosis, follow-up time and event-points that occurred in the RP and RT groups is presented in Table 1 for the SEER cohort and Table 2 for the PLCO cohort.
Table 1. Clinical and pathoanatomic characteristics of Surveillance, Epidemiology, and End results (SEER) (n = 131, 345).
| Variables | Prostatectomy (n = 74, 663) | Radiation (n = 56, 682) |
| Age (years) | 62.94 ± 8.54 | 67.53 ± 7.97 |
| Survival time (months) | 24.12 ± 13.84 | 24.83 ± 13.65 |
| End-point events | 2, 531 (3.39%) | 2, 356 (4.16%) |
| TNM | | |
| I | 10, 092 (13.5%) | 16, 279 (28.7%) |
| II | 49, 470 (66.3%) | 37, 042 (65.4%) |
| III | 12, 507 (16.8%) | 1, 410 (2.5%) |
| IV | 2, 594 (3.5%) | 1, 951 (3.4%) |
| Grade | | |
| Well differentiated; Grade I | 1, 179 (1.6%) | 591 (1.0%) |
| Moderately differentiated; Grade II | 25, 508 (34.2%) | 20, 815 (36.7%) |
| Poorly differentiated; Grade III | 47, 872 (64.1%) | 35, 137 (62.0%) |
| Undifferentiated; anaplastic; Grade IV | 104 (0.1%) | 139 (0.2%) |
| T | | |
| T1a | 2, 682 (3.6%) | 0 (0.0%) |
| T1b | 1, 416 (1.9%) | 0 (0.0%) |
| T1c | 2, 228 (3.0%) | 38, 171 (67.3%) |
| T1NOS | 653 (0.9%) | 0 (0.0%) |
| T2a | 7, 797 (10.4%) | 3, 917 (6.9%) |
| T2b | 1, 420 (1.9%) | 1, 934 (3.4%) |
| T2c | 38, 918 (52.1%) | 2, 085 (3.7%) |
| T2NOS | 5, 275 (7.1%) | 8, 418 (14.9%) |
| T3a | 9, 890 (13.2%) | 665 (1.2%) |
| T3b | 3, 752 (5.0%) | 605 (1.1%) |
| T3NOS | 104 (0.1%) | 446 (0.8%) |
| T4 | 476 (0.6%) | 309 (0.5%) |
| TX | 52 (0.1%) | 132 (0.2%) |
| N | | |
| N0 | 72, 789 (97.5%) | 55, 652 (98.2%) |
| N1 | 1, 740 (2.3%) | 840 (1.5%) |
| NX | 134 (0.2%) | 190 (0.3%) |
| M | | |
| M0 | 73, 849 (98.9%) | 55, 316 (97.6%) |
| M1a | 54 (0.1%) | 62 (0.1%) |
| M1b | 563 (0.8%) | 1, 039 (1.8%) |
| M1c | 151 (0.2%) | 232 (0.4%) |
| M1NOS | 46 (0.1%) | 33 (0.1%) |
Table 2. Clinical and pathoanatomic characteristics the Prostate, Lung, Colorectal, and Ovarian (PLCO) (n = 6, 396).
| Variables | Prostatectomy (n = 2, 961) | Radiation (n = 3, 435) |
| Age (years) | 66.04 ± 4.59 | 70.50 ± 5.31 |
| Survival time | 144.13 ± 21.56 | 143.75± 22.31 |
| End-point events | 284 | 493 |
| TNM | | |
| I | 4 (0.1%) | 6 (0.2%) |
| II | 2939 (99.3%) | 3303 (96.2%) |
| III | 17 (0.6%) | 86 (2.5%) |
| IV | 1 (0.0%) | 40 (1.2%) |
| Grade | | |
| Slight Anaplasia (G1) | 77 (2.6%) | 142 (4.1%) |
| Moderate Anaplasia (G2) | 2447 (82.6%) | 2774 (80.8%) |
| Marked Anaplasia (G3-4) | 437 (14.8%) | 519 (15.1%) |
| Gleason | | |
| 2–4 | 67 (2.3%) | 110 (3.2%) |
| 5–6 | 1416 (47.8%) | 1834 (53.4%) |
| 7–10 | 1456 (49.2%) | 1471 (42.8%) |
| Not Available (99) | 22 (0.7%) | 20 (0.6%) |
| T | | |
| T1 (3) | 1 (0.0%) | 0 (0.0%) |
| T1a (4) | 21 (0.7%) | 17 (0.5%) |
| T1b (5) | 18 (0.6%) | 22 (0.6%) |
| T1c (6) | 1816 (61.3%) | 2112 (61.5%) |
| T2 (7) | 89 (3.0%) | 46 (1.3%) |
| T2a (8) | 619 (20.9%) | 654 (19.0%) |
| T2b (9) | 319 (10.8%) | 443 (12.9%) |
| T2c (10) | 61 (2.1%) | 40 (1.2%) |
| T3 (11) | 4 (0.1%) | 23 (0.7%) |
| T3a (12) | 8 (0.3%) | 38 (1.1%) |
| T3b (13) | 3 (0.1%) | 19 (0.6%) |
| T3c (14) | 2 (0.1%) | 12 (0.3%) |
| T4 (15) | 0 (0.0%) | 7 (0.2%) |
| TX (1) | 0 (0.0%) | 2 (0.1%) |
| N | | |
| N0 (2) | 2261 (76.4%) | 2899 (84.4%) |
| N1 (3) | 0 (0.0%) | 17 (0.5%) |
| N2 (4) | 0 (0.0%) | 0 (0.0%) |
| NX (1) | 687 (23.2%) | 512 (14.9%) |
| Not Available (99) | 13 (0.4%) | 7 (0.2%) |
| M | | |
| M0 (2) | 2532 (85.5%) | 3066 (89.3%) |
| M1a (3) | 0 (0.0%) | 3 (0.1%) |
| M1b (4) | 1 (0.0%) | 18 (0.5%) |
| M1c (5) | 0 (0.0%) | 1 (0.0%) |
| MX (1) | 421 (14.2%) | 341 (9.9%) |
| Not Available (99) | 7 (0.2%) | 6 (0.2%) |
| PSA (ng/mL) | | |
| 0–4 | 496 (16.8%) | 421 (12.3%) |
| 4.1–10 | 1891 (63.9%) | 2167 (63.1%) |
| 10.1–20 | 353 (11.9%) | 474 (13.8%) |
| 20.1–50 | 65 (2.2%) | 150 (4.4%) |
| 50.1–100 | 9 (0.3%) | 30 (0.9%) |
| 100+ | 2 (0.1%) | 16 (0.5%) |
| Not available | 145 (4.9%) | 177 (5.2%) |
| Smoke | | |
| Never smoked | 1031 (34.8%) | 1124 (32.7%) |
| Current or former smoker | 1861 (62.9%) | 2218 (64.6%) |
| Not available | 69 (2.3%) | 93 (2.7%) |
| Education | | |
| Less Than 8 Years | 23 (0.8%) | 37 (1.1%) |
| 8-11 Years | 150 (5.1%) | 226 (6.6%) |
| 12 Years or Completed High School | 530 (17.9%) | 583 (17.0%) |
| Post High School Training Other Than College | 343 (11.6%) | 375 (10.9%) |
| Some College | 556 (18.8%) | 704 (20.5%) |
| College Graduate | 593 (20.0%) | 631 (18.4%) |
| Postgraduate | 689 (23.3%) | 783 (22.8%) |
| Not available | 77 (2.6%) | 96 (2.8%) |
| Race | | |
| White, Non-Hispanic | 2648 (89.4%) | 2893 (84.2%) |
| Black, Non-Hispanic | 138 (4.7%) | 234 (6.8%) |
| Hispanic | 45 (1.5%) | 64 (1.9%) |
| Asian | 42 (1.4%) | 123 (3.6%) |
| Pacific Islander | 10 (0.3%) | 23 (0.7%) |
| American Indian | 7 (0.2%) | 5 (0.1%) |
| Missing | 71 (2.4%) | 93 (2.7%) |
| BMI | 27.22 ± 3.68 | 27.41 ± 4.02 |
| Aspirin | | |
| None | 1392 (47.0%) | 1496 (43.6%) |
| 1/Day | 623 (21.0%) | 879 (25.6%) |
| 2+/Day" | 136 (4.6%) | 147 (4.3%) |
| 1/Week | 38 (1.3%) | 38 (1.1%) |
| 2/Week | 99 (3.3%) | 122 (3.6%) |
| 3-4/Week | 297 (10.0%) | 306 (8.9%) |
| <2/Month | 195 (6.6%) | 220 (6.4%) |
| 2-3/Month | 107 (3.6%) | 123 (3.6%) |
| Not available | 74 (2.5%) | 104 (3.0%) |
| Diabetes | | |
| No | 2737 (92.4%) | 3073 (89.5%) |
| YES | 137 (4.6%) | 249 (7.2%) |
| Not available | 87 (2.9%) | 113 (3.3%) |
| Family history of Prostate Cancer | | |
| No | 2481 (83.8%) | 2927 (85.2%) |
| Yes, Immediate Family Member | 349 (11.8%) | 346 (10.1%) |
| Possibly - Relative Or Cancer Type Not Clear | 44 (1.5%) | 51 (1.5%) |
| Not available | 87 (2.9%) | 111 (3.2%) |
| Comorbidity | | |
| 0 | 1209 (40.8%) | 1103 (32.1%) |
| 1 | 989 (33.4%) | 1163 (33.9%) |
| 2 | 516 (17.4%) | 698 (20.3%) |
| ≥3 | 247 (8.3%) | 471 (13.7%) |
Survival analysis
In the SEER cohort, patients treated with RT showed a worse outcome than those who underwent RP (HR: 1.09, 95% CI: 1.02–1.16, p = 0.0069) (Table 3). This significant association was validated in the PLCO cohort (HR: 1.46, 95% CI: 1.24–1.72, p = < 0.0001) (Table 3). Patients who received both prostatectomy and radiotherapy versus only prostatectomy or radiotherapy in the PLCO cohort showed no significant associations (Supplementary Table 1).
Table 3. Hazard ratios (HRs) with 95% confidence intervals (95% CIs) of prostate cancer (PCa) deaths for men who received radiotherapy (RT) versus those who underwent radical prostatectomy (RP) in SEER and PLCO.
| Dataset | No. of patients (deaths/total) | HR | 95%CI | p | HR | 95%CI | p |
| SEER | 4887/131,345 | 1.19 | 1.13–1.26 | < 0.0001a | 1.09 | 1.02–1.16 | 0.0069b |
| PLCO | 777/6,396 | 1.50 | 1.30–1.73 | < 0.0001a | 1.46 | 1.24–1.72 | < 0.0001c |
| aunadjusted. |
| badjusted age at diagnosis (5-year groups), tumor node metastasis (TNM) stage (continuous) and grade (continuous). |
| cadjusted age at diagnosis (5-year groups), TNM stage (continuous), grade (continuous), smoke (categorical), education levels (continuous), race (categorical), body mass index (continuous), aspirin does (continuous), diabetes (categorical) and family history (categorical). |
| Abbreviations: SEER, Surveillance, Epidemiology, and End Results; PLCO, the Prostate, Lung, Colorectal, and Ovarian. |
In the next step, stratified analysis was performed according to clinical TNM stage to compare the treatment outcomes of RP and RT for PCa patients in the SEER cohort (Table 4). Of note, PCa patients at TNM stages I, IIA and IIB showed better survival with RT treatment than RP patients (p = < 0.0001 for stage I, p = < 0.0001 for stage IIA and p = 0.0048 for stage IIB). In contrast, those at TNM stages III and IV showed worse prognosis with RT treatment compared with RP (p = 0.026 for stage III and p = < 0.0001 for stage IV).
Table 4. Hazard ratios (HRs) with 95% confidence intervals (95% CIs) of prostate cancer (PCa) deaths for men who received radiotherapy (RT) versus those who underwent radical prostatectomy (RP) in SEER stratified by TNM stage.
| TNM stage | No. of patients (deaths/total) | HRa | 95%CIa | pa | HRb | 95%CIb | pb |
| I | 984/26,371 | 0.31 | 0.27–0.35 | < 0.0001 | 0.35 | 0.30–0.40 | < 0.0001 |
| IIA | 1056/32,631 | 0.82 | 0.72–0.93 | 0.0025 | 0.67 | 0.58–0.76 | < 0.0001 |
| IIB | 1547/53,881 | 2.15 | 1.94–2.38 | < 0.0001 | 0.85 | 0.76–0.95 | 0.0048 |
| III | 299/13,917 | 2.86 | 2.20–3.71 | < 0.0001 | 1.38 | 1.04–1.84 | 0.026 |
| IV | 1001/4,545 | 1.83 | 1.61–2.07 | < 0.0001 | 1.78 | 1.59–2.05 | < 0.0001 |
| aunadjusted. |
| badjusted age at diagnosis (5-year groups) and grade (continuous). |
| Abbreviation: SEER, Surveillance, Epidemiology, and End Results. |
Then, stratified analysis was performed according to age at diagnosis in the SEER cohort (Table 5). PCa patients treated with RT showed a better prognosis than those who underwent RP in the 75–79, 80–84 and 85+ year age groups (p < 0.05) but a worse prognosis in the 45–49, 50–54, 55–59, 60–64, and 65–69 year age groups (p < 0.05). There were no significant differences for patients in the age range of 70–74 years in the comparison between RP and RT.
Table 5. Hazard ratios (HRs) with 95% confidence intervals (95% CIs) of prostate cancer (PCa) deaths for men who received radiotherapy (RT) versus those who underwent radical prostatectomy (RP) in SEER stratified by age groups.
| Age (years) | No. of patients (deaths/total) | HRa | 95%CIa | pa | HRb | 95%CIb | pb |
| 45–49 | 46/3,461 | 3.80 | 2.13–6.79 | < 0.0001 | 6.40 | 3.50–11.68 | < 0.0001 |
| 50–54 | 179/10,892 | 3.09 | 2.30–4.14 | < 0.0001 | 5.32 | 3.95–7.16 | < 0.0001 |
| 55–59 | 347/19,949 | 2.43 | 1.97–3.00 | < 0.0001 | 4.04 | 3.22–5.06 | < 0.0001 |
| 60–64 | 611/27,645 | 1.92 | 1.64–2.25 | < 0.0001 | 3.36 | 2.84–3.98 | < 0.0001 |
| 65–69 | 861/30,593 | 1.36 | 1.19–1.56 | < 0.0001 | 2.15 | 1.86–2.49 | < 0.0001 |
| 70–74 | 864/20,527 | 0.77 | 0.68–0.88 | 0.0002 | 1.09 | 0.94–1.27 | 0.21 |
| 75–79 | 808/11,239 | 0.42 | 0.37–0.49 | < 0.0001 | 0.52 | 0.45–0.61 | < 0.0001 |
| 80–84 | 658/4,414 | 0.32 | 0.28–0.38 | < 0.0001 | 0.34 | 0.29–0.40 | < 0.0001 |
| 85+ | 504/1,767 | 0.44 | 0.36–0.55 | < 0.0001 | 0.39 | 0.32–0.49 | < 0.0001 |
| aunadjusted. |
| badjusted tumor node metastasis (TNM) stage (continuous) and grade (continuous). |
| Abbreviation: SEER, Surveillance, Epidemiology, and End Results. |
Subsequently, TNM stage and age were simultaneously considered for stratified analysis. The HR of RT versus RP in overall survival decreased with age (Figure 2A, Table 6). This negative correlation was also found in stages I, IIA, and IIB in the SEER cohort (Figure 2C, 2D, 2E, 2F, Table 6).
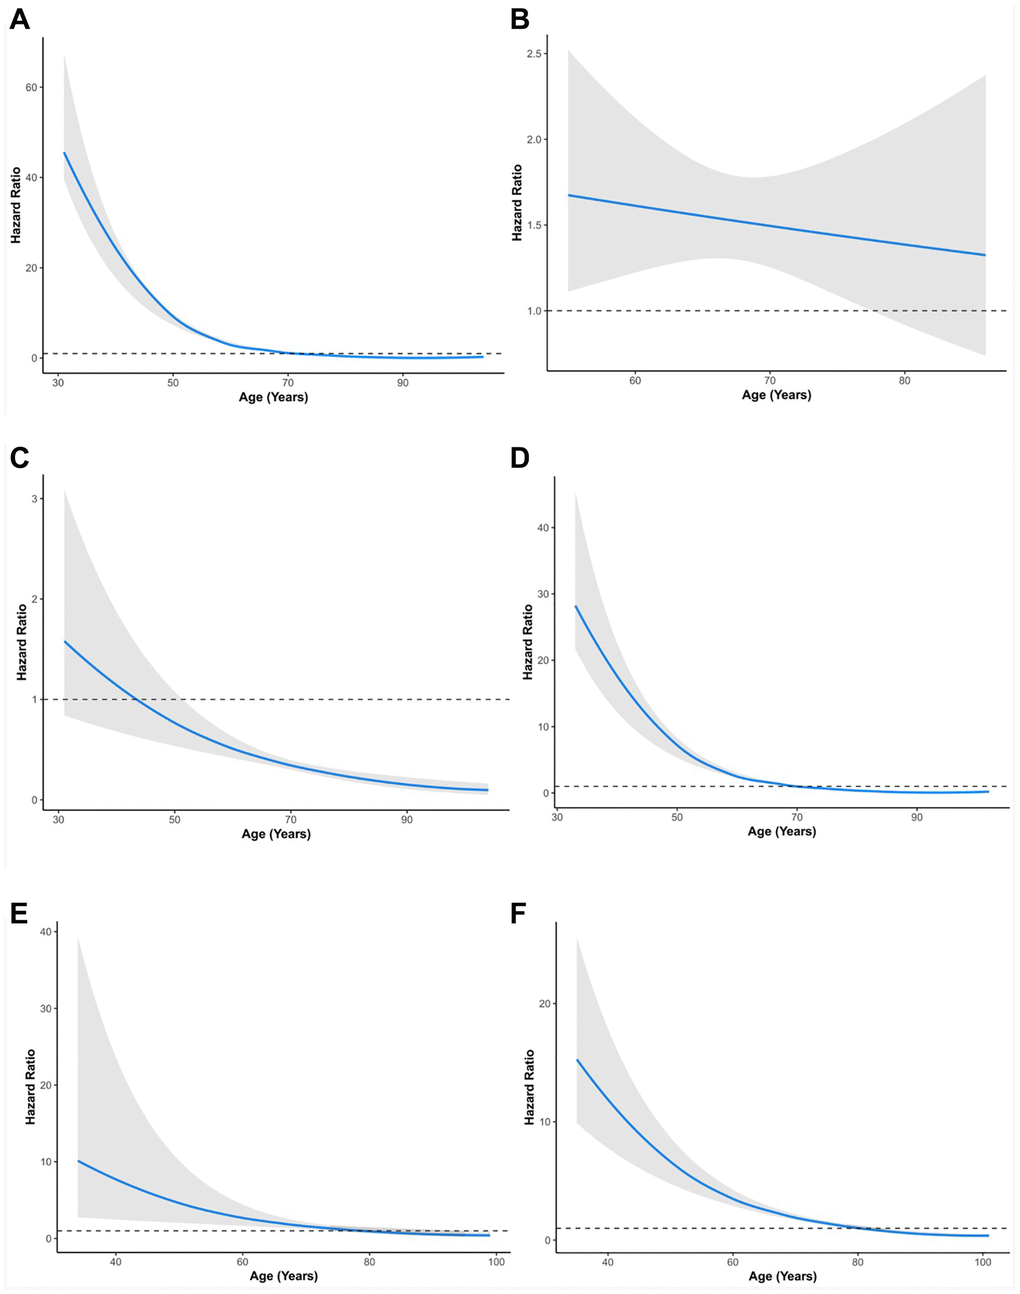
Figure 2. Relationship between age and hazard ratio of RT versus RP for patients with prostate cancer. (A) All groups in SEER. (B) All groups in PLCO. (C) Stage I group in SEER. (D) Stage II group in SEER. (E) Stage III group in SEER. (F) Stage IV group in SEER. SEER, Surveillance, Epidemiology, and End Results; PLCO, the Prostate, Lung, Colorectal, and Ovarian. The solid lines are multivariable adjusted hazard ratios. The shaded areas are the 95% confidence intervals. The dotted lines are coordinate 1 on the vertical axis.
Table 6. Hazard ratios (HRs) with 95% confidence intervals (95% CIs) of prostate cancer (PCa) death for men who received radiotherapy (RT) versus those who underwent radical prostatectomy (RP) in SEER stratified by age according to TNM stage.
| TNM stage | Age (years) | No. of patients (deaths/total) | HRa | 95% CIa | pa | HRb | 95% CIb | pb |
| Stage I | 45–49 | 11/669 | 0.97 | 0.3–3.19 | 0.96 | 0.99 | 0.29–3.30 | 0.99 |
| 50–54 | 32/1, 994 | 0.85 | 0.42–1.7 | 0.64 | 0.87 | 0.43–1.74 | 0.69 |
| 55–59 | 76/3, 879 | 0.60 | 0.38–0.94 | 0.026 | 0.59 | 0.38–0.93 | 0.022 |
| 60–64 | 117/5, 520 | 0.48 | 0.33–0.69 | < 0.0001 | 0.47 | 0.33–0.68 | < 0.0001 |
| 65–69 | 163/6, 239 | 0.40 | 0.29–0.54 | < 0.0001 | 0.40 | 0.29–0.54 | < 0.0001 |
| 70–74 | 172/4, 302 | 0.25 | 0.18–0.34 | < 0.0001 | 0.25 | 0.18–0.34 | < 0.0001 |
| 75–79 | 173/2, 321 | 0.29 | 0.21–0.39 | < 0.0001 | 0.29 | 0.21–0.39 | < 0.0001 |
| 80–84 | 145/879 | 0.37 | 0.24–0.57 | < 0.0001 | 0.37 | 0.24–0.57 | < 0.0001 |
| 85+ | 93/393 | 0.22 | 0.05–0.89 | 0.034 | 0.20 | 0.05–0.83 | 0.026 |
| Stage IIA | 45–49 | 6/456 | 2.56 | 0.47–14.01 | 0.28 | 2.54 | 0.46–14.01 | 0.28 |
| 50–54 | 23/1, 697 | 1.23 | 0.54–2.81 | 0.62 | 1.25 | 0.55–2.86 | 0.59 |
| 55–59 | 62/3, 587 | 2.96 | 1.54–5.69 | 0.0011 | 2.93 | 1.53–5.63 | 0.0012 |
| 60–64 | 130/6, 089 | 2.03 | 1.30–3.16 | 0.0017 | 2.04 | 1.31–3.18 | 0.0016 |
| 65–69 | 207/7, 902 | 0.98 | 0.71–1.34 | 0.89 | 0.98 | 0.71–1.34 | 0.89 |
| 70–74 | 205/6, 733 | 0.58 | 0.43–0.80 | 0.0009 | 0.58 | 0.43–0.80 | 0.0009 |
| 75–79 | 203/4, 245 | 0.58 | 0.41–0.81 | 0.0016 | 0.58 | 0.41–0.82 | 0.0021 |
| 80–84 | 135/1, 430 | 0.29 | 0.21–0.41 | < 0.0001 | 0.29 | 0.21–0.41 | < 0.0001 |
| 85+ | 83/388 | 0.41 | 0.25–0.67 | 0.0007 | 0.41 | 0.25–0.67 | 0.0004 |
| stage IIB | 45–49 | 13/1, 910 | 2.28 | 0.30–17.54 | 0.43 | 2.28 | 0.28–18.39 | 0.44 |
| 50–54 | 50/5, 645 | 2.54 | 1.14–5.64 | 0.022 | 2.45 | 1.09–5.55 | 0.031 |
| 55–59 | 107/9, 536 | 2.54 | 1.59–4.06 | < 0.0001 | 2.34 | 1.45–3.80 | 0.0005 |
| 60–64 | 173/11, 768 | 3.35 | 2.46–4.56 | < 0.0001 | 3.52 | 2.55–4.85 | < 0.0001 |
| 65–69 | 260/11, 799 | 2.20 | 1.72–2.82 | < 0.0001 | 2.17 | 1.69–2.81 | < 0.0001 |
| 70–74 | 283/6, 910 | 1.37 | 1.09–1.73 | 0.0078 | 1.39 | 1.09–1.76 | 0.0074 |
| 75–79 | 266/3, 582 | 0.49 | 0.38–0.62 | < 0.0001 | 0.52 | 0.40–0.67 | < 0.0001 |
| 80–84 | 210/1, 594 | 0.23 | 0.18–0.30 | < 0.0001 | 0.24 | 0.18–0.31 | < 0.0001 |
| 85+ | 182/645 | 0.25 | 0.17–0.36 | < 0.0001 | 0.25 | 0.17–0.36 | < 0.0001 |
| Stage III | 45–49 | 2/333 | – | – | – | – | – | 1.0 |
| 50–54 | 8/1, 220 | 3.04 | 0.37–24.8 | 0.30 | 2.99 | 0.36–24.58 | 0.31 |
| 55–59 | 24/2, 351 | 5.02 | 1.99–12.66 | 0.0006 | 4.79 | 1.89–12.12 | 0.0009 |
| 60–64 | 51/3, 416 | 1.57 | 0.62–3.96 | 0.34 | 1.54 | 0.61–3.87 | 0.36 |
| 65–69 | 67/3, 691 | 2.17 | 1.14–4.14 | 0.019 | 2.21 | 1.16–4.23 | 0.016 |
| 70–74 | 60/1, 933 | 2.37 | 1.38–4.05 | 0.0017 | 2.36 | 1.38–4.04 | 0.0017 |
| 75–79 | 35/631 | 0.70 | 0.34–1.47 | 0.35 | 0.70 | 0.33–1.45 | 0.34 |
| 80–84 | 31/203 | 0.47 | 0.23–0.96 | 0.038 | 0.48 | 0.23–0.97 | 0.041 |
| 85+ | 21/78 | 0.50 | 0.2–1.27 | 0.15 | 0.50 | 0.20–1.27 | 0.15 |
| Stage IV | 45–49 | 14/93 | 5.91 | 1.65–21.22 | 0.0064 | 5.85 | 1.63–21.04 | 0.0068 |
| 50–54 | 66/336 | 3.84 | 2.23–6.6 | < 0.0001 | 3.84 | 2.24–6.61 | < 0.0001 |
| 55–59 | 78/596 | 5.18 | 3.12–8.62 | < 0.0001 | 5.19 | 3.11–8.66 | < 0.0001 |
| 60–64 | 140/852 | 2.83 | 1.99–4.02 | < 0.0001 | 2.84 | 2.00–4.03 | < 0.0001 |
| 65–69 | 164/962 | 2.83 | 2.05–3.91 | < 0.0001 | 2.83 | 2.05–3.92 | < 0.0001 |
| 70–74 | 144/649 | 1.66 | 1.18–2.32 | 0.0032 | 1.66 | 1.19–2.33 | 0.003 |
| 75–79 | 131/460 | 0.88 | 0.63–1.25 | 0.48 | 0.88 | 0.62–1.24 | 0.47 |
| 80–84 | 137/308 | 1.15 | 0.82–1.61 | 0.42 | 1.21 | 0.86–1.71 | 0.28 |
| 85+ | 125/263 | 0.80 | 0.55–1.17 | 0.25 | 0.80 | 0.55–1.16 | 0.24 |
| aunadjusted. |
| badjusted grade (continuous). |
| Abbreviation: SEER, Surveillance, Epidemiology, and End Results. |
Additionally, this finding was validated in the PLCO cohort (Figure 2B). Specifically, in TNM stage I, patients aged 55–85+ years (HR: 0.20–0.59, p < 0.05) showed better survival with RT than RP patients (Table 6). In TNM stage IIA, patients aged 70–85+ years (HR: 0.41–0.58, p < 0.05) showed better survival with RT than RP. In contrast, patients aged 55–64 years (HR: 2.04–2.93, p < 0.05) showed worse survival with RT than with RP (Table 6). In TNM stage IIB patients, those aged 75–85+ years (HR: 0.25–0.52, p < 0.05) showed better survival with RT than RP patients. In contrast, patients aged 50–74 years (HR: 1.39–2.45, p < 0.05) showed worse survival with RT than with RP (Table 6). In TNM stage III, patients aged 80–84 years (HR: 0.48, 95% CI: 0.23–0.97, p = 0.041) showed better survival with RT than RP patients. In contrast, patients aged 55–74 years (HR: 2.36–4.79, p < 0.05) showed worse survival with RT than with RP (Table 6). In TNM stage IV, patients aged 45–74 years (HR: 1.66–5.85, p < 0.05) showed worse survival with RT than with RP. PCa patients in other age groups within stages showed no significant differences between RP and RT (Table 6).