


Introduction
As we age, our brains undergo natural structural, chemical and functional deterioration, along with strong cognitive decline, characterized by brain atrophy, blood flow reductions, synaptic degeneration and neurochemical alternations [1]. Such human studies, however, rarely exclude common health conditions of aging, such as hypertension, that could influence the accuracy of the results [2]. Therefore, it is necessary to further understand age-related brain changes in nonhuman animal models to distinguish normal aging from pathological brain abnormalities. Using animal models to study the underlying mechanisms of aging will therefore provide a critical foundation from which to develop new interventions for aging-related brain disorders.
Normal aging has been associated with considerable alterations to the brain network and its associated functions [3–5]. Aging-related reorganization of the brain network has been described for the human brain based on functional, metabolic and structural connectivity. Age-related declines in functional connectivity have been observed both within and between several resting-state networks, such as the default mode, salience, dorsal attention and sensorimotor networks [4]. Moreover, brain networks in the elderly show decreased modularity and efficiency and exhibit a degeneration process in which the aging brain system shifts from a small-worldness network to a regular network along with normal aging [6, 7]. In addition, age-related alterations in structural network metrics are similar to the findings of functional connectivity studies [1].
[18F]Fluorodeoxyglucose with positron emission tomography (18F-FDG PET) is a valuable tool for measuring energy consumption in neurons, which reflects neuronal communication signals [8]. Thus, 18F-FDG PET is considered a functional neuroimaging technique for detecting age-related brain activity changes. Over the past few decades, many studies have used 18F-FDG PET to investigate the changes in brain mechanisms associated with normal aging. Overall, a consistent finding in most studies is a significant age-related decline in glucose metabolism observed in the frontal lobe [9, 10]. Decreased glucose uptake may reflect tissue loss or shrinkage [3]. In addition, age-related changes also appear in metabolic brain networks, e.g., increased clustering, decreased efficiency, reduced robustness and changed nodal centralities in association and paralimbic cortex regions [7].
However, it has not been definitively reported whether the age-related changes in glucose metabolism are consistent between the rat brain and the human brain, especially in terms of metabolic brain networks. It remains unclear whether the brain metabolic network of aged rats has similar age-related changes to the human brain.
In the present study, we submitted young and aged rats to 18F-FDG PET and constructed brain metabolic networks. The topological properties were detected, and the network robustness against random failures and targeted attacks was analyzed for age-group comparisons.
Results
Differences in metabolic connectivity of the brain metabolic networks of aged and young rats
All of the rat brain regions included in the study are listed in Table 1. The group-level metabolic correlation matrix is shown in Figure 1 (A, the aged group; B, the young group). Compared to young rats, significantly decreased metabolic connectivity between regions related to visual (left visual cortex, right visual cortex), auditory (right auditory cortex), and olfactory (right entorhinal cortex) senses, as well as significantly increased metabolic connectivity between limbic brain regions (right raphe, left raphe, right nucleus accumbens core, right nucleus accumbens shell), were observed in aged rats (Table 2 and Figure 1). All significance tests were conducted at the threshold p < 0.001 without correction.
Table 1. All of the rat brain regions included in the study.
| No. | Brain regions | Abbreviation | No. | Brain regions | Abbreviation |
| 1 | Nucleus Accumbens Core_R | AcbC_R | 49 | Nucleus Accumbens Core_L | AcbC_L |
| 2 | Nucleus Accumbens Shell_R | AcbSh_R | 50 | Nucleus Accumbens Shell_L | AcbSh_L |
| 3 | Amygdala_R | Amy_R | 51 | Amygdala_L | Amy_L |
| 4 | Bed Nucleus of the Stria Terminalis_R | BNST_R | 52 | Bed Nucleus of the Stria Terminalis_L | BNST_L |
| 5 | Caudate Putamen_R | CPu_R | 53 | Caudate Putamen_L | CPu_L |
| 6 | Corpus Collosum_R | CoC_R | 54 | Corpus Collosum_L | CoC_L |
| 7 | Cortex- Auditory_R | Aud_R | 55 | Cortex- Auditory_L | Aud_L |
| 8 | Cortex- Cingulate_R | CiC_R | 56 | Cortex- Cingulate_L | CiC_L |
| 9 | Cortex- Entorhinal_R | EC_R | 57 | Cortex- Entorhinal_L | EC_L |
| 10 | Cortex- Frontal Association_R | FrA_R | 58 | Cortex- Frontal Association_L | FrA_L |
| 11 | Cortex- Insular_R | In_R | 59 | Cortex- Insular_L | In_L |
| 12 | Cortex-Medial Prefrontal_R | mPFC_R | 60 | Cortex-Medial Prefrontal_L | mPFC_L |
| 13 | Cortex- Motor_R | M1_R | 61 | Cortex- Motor_L | M1_L |
| 14 | Cortex- Orbitofrontal_R | OFC_R | 62 | Cortex- Orbitofrontal_L | OFC_L |
| 15 | Cortex- Parietal Association_R | ParA_R | 63 | Cortex- Parietal Association_L | ParA_L |
| 16 | Piriform Cortex_R | PC_R | 64 | Piriform Cortex_L | PC_L |
| 17 | Cortex- Retrosplenial_R | RSC_R | 65 | Cortex- Retrosplenial_L | RSC_L |
| 18 | Cortex- Somatosensory_R | S1_R | 66 | Cortex- Somatosensory_L | S1_L |
| 19 | Cortex- Temporal Association_R | TeA_R | 67 | Cortex- Temporal Association_L | TeA_L |
| 20 | Cortex- Visual_R | V1_R | 68 | Cortex- Visual_L | V1_L |
| 21 | Diagonal Band_R | DB_R | 69 | Diagonal Band_L | DB_L |
| 22 | Globus Pallidus_R | GPa_R | 70 | Globus Pallidus_L | GPa_L |
| 23 | Antero-Dorsal Hippocampus_R | adHIP_R | 71 | Antero-Dorsal Hippocampus_L | adHIP_L |
| 24 | Posterior Hippocampus_R | pHIP_R | 72 | Posterior Hippocampus_L | pHIP_L |
| 25 | Postero-Dorsal Hippocampus_R | pdHIP_R | 73 | Postero-Dorsal Hippocampus_L | pdHIP_L |
| 26 | Hippocampus Subiculum_R | sHIP_R | 74 | Hippocampus Subiculum_L | sHIP_L |
| 27 | Ventral Hippocampus_R | vHPC_R | 75 | Ventral Hippocampus_L | vHPC_L |
| 28 | Lateral Hypothalamus_R | LH_R | 76 | Lateral Hypothalamus_L | LH_L |
| 29 | Medial Hypothalamus_R | MH_R | 77 | Medial Hypothalamus_L | MH_L |
| 30 | Internal Capsule_R | Ic_R | 78 | Internal Capsule_L | Ic_L |
| 31 | Interstitial Nucleus of the Posterior Limb of the Anterior Commissure_R | IPAC_R | 79 | Interstitial Nucleus of the Posterior Limb of the Anterior Commissure_L | IPAC_L |
| 32 | Medial Geniculate_R | MG_R | 80 | Medial Geniculate_L | MG_L |
| 33 | Mesencephalic Region_R | MR_R | 81 | Mesencephalic Region_L | MR_L |
| 34 | Olfactory Nuclei_R | ON_R | 82 | Olfactory Nuclei_L | ON_L |
| 35 | Olfactory Tubercle_R | OT_R | 83 | Olfactory Tubercle_L | OT_L |
| 36 | Periaqueductal Grey_R | PAG_R | 84 | Periaqueductal Grey_L | PAG_L |
| 37 | Pons_R | Pons_R | 85 | Pons_L | Pons_L |
| 38 | Raphe_R | Raphe_R | 86 | Raphe_L | Raphe_L |
| 39 | Septum_R | Septum_R | 87 | Septum_L | Septum_L |
| 40 | Substantia Innominata_R | SI_R | 88 | Substantia Innominata_L | SI_L |
| 41 | Substantia Nigra_R | SN_R | 89 | Substantia Nigra_L | SN_L |
| 42 | Superior Colliculus_R | SC_R | 90 | Superior Colliculus_L | SC_L |
| 43 | Dorsolateral Thalamus_R | DLT_R | 91 | Dorsolateral Thalamus_L | DLT_L |
| 44 | Dorsal Midline Thalamus_R | dMT_R | 92 | Dorsal Midline Thalamus_L | dMT_L |
| 45 | Ventromedial Thalamus_R | VMT_R | 93 | Ventromedial Thalamus_L | VMT_L |
| 46 | Ventral Pallidum_R | VP_R | 94 | Ventral Pallidum_L | VP_L |
| 47 | Ventral Tegmental Area_R | VTA_R | 95 | Ventral Tegmental Area_L | VTA_L |
| 48 | Zona Incerta_R | ZI_R | 96 | Zona Incerta_L | ZI_L |
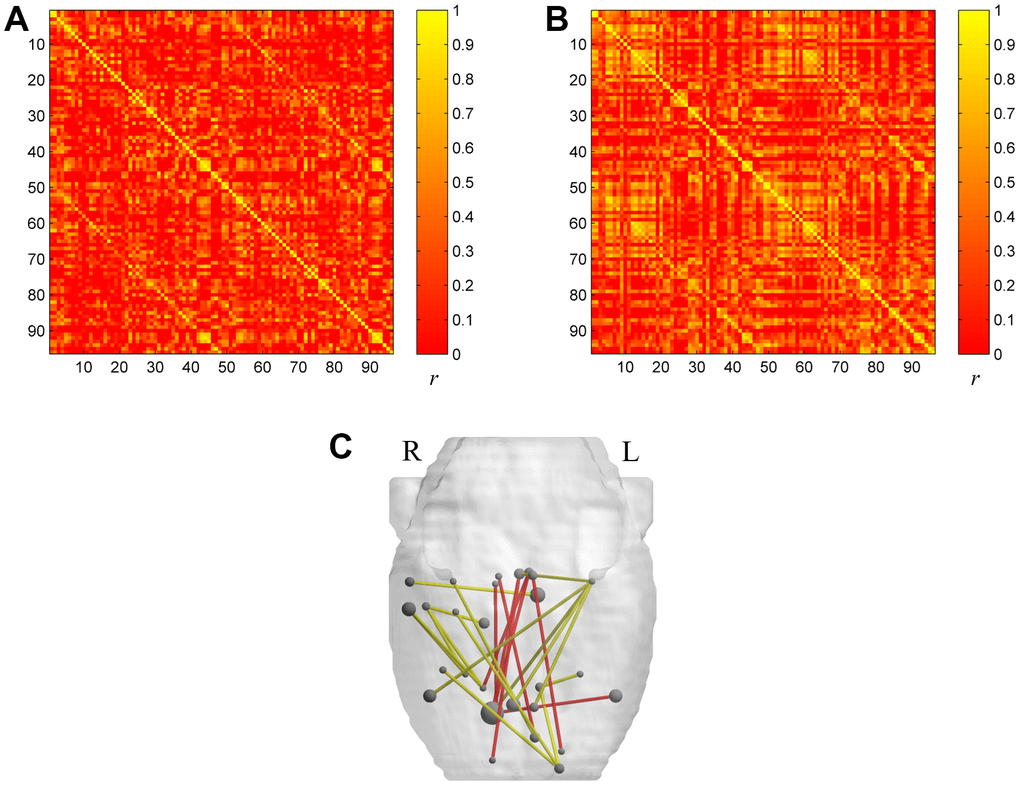
Figure 1. The metabolic brain networks of the two groups (A for the aged group and B for the young group). The color bar indicates the Pearson correlation coefficient between each pair of brain regions. The rank and row successively represent the 96 brain regions (Table 4). (C) The 3D Figure represents metabolic connections with significant differences between the two groups. Metabolic connections are overlaid on an anatomical map using nodes and edges. The red line shows significantly increased metabolic connectivity in the aged group (p<0.001) compared with the young group. The yellow line shows significantly reduced metabolic connectivity in the aged group (p<0.001) compared with the young group.
Table 2. Significant differences in metabolic connectivity between regions.
| Aged group < young group | Aged group > young group | ||||||||||||||||||||||||||||||||||||||||||||||||||||||||||||||||||||||||||||||||||||||||||||||||||
| Brain region | Brain region | P values | Brain region | Brain region | P values | ||||||||||||||||||||||||||||||||||||||||||||||||||||||||||||||||||||||||||||||||||||||||||||||
| V1_L | AcbC_R | <0.001 | Raphe_R | AcbC_R | <0.001 | ||||||||||||||||||||||||||||||||||||||||||||||||||||||||||||||||||||||||||||||||||||||||||||||
| V1_L | CiC_R | <0.001 | Raphe_R | ON_R | <0.001 | ||||||||||||||||||||||||||||||||||||||||||||||||||||||||||||||||||||||||||||||||||||||||||||||
| V1_L | CiC_L | <0.001 | Raphe_L | AcbC_R | <0.001 | ||||||||||||||||||||||||||||||||||||||||||||||||||||||||||||||||||||||||||||||||||||||||||||||
| V1_L | Raphe_R | <0.001 | Raphe_L | VP_R | <0.001 | ||||||||||||||||||||||||||||||||||||||||||||||||||||||||||||||||||||||||||||||||||||||||||||||
| V1_L | In_R | <0.001 | AcbSh_R | MR_R | <0.001 | ||||||||||||||||||||||||||||||||||||||||||||||||||||||||||||||||||||||||||||||||||||||||||||||
| V1_R | mPFC_L | <0.001 | AcbSh_R | In_L | <0.001 | ||||||||||||||||||||||||||||||||||||||||||||||||||||||||||||||||||||||||||||||||||||||||||||||
| Aud_R | IPAC_R | <0.001 | SC_R | mPFC_L | <0.001 | ||||||||||||||||||||||||||||||||||||||||||||||||||||||||||||||||||||||||||||||||||||||||||||||
| Aud_R | VP_R | <0.001 | OFC_L | PAG_L | <0.001 | ||||||||||||||||||||||||||||||||||||||||||||||||||||||||||||||||||||||||||||||||||||||||||||||
| EC_R | IPAC_R | <0.001 | |||||||||||||||||||||||||||||||||||||||||||||||||||||||||||||||||||||||||||||||||||||||||||||||||
| EC_R | VP_R | <0.001 | |||||||||||||||||||||||||||||||||||||||||||||||||||||||||||||||||||||||||||||||||||||||||||||||||
| EC_R | ZI_R | <0.001 | |||||||||||||||||||||||||||||||||||||||||||||||||||||||||||||||||||||||||||||||||||||||||||||||||
| FrA_L | S1_R | <0.001 | |||||||||||||||||||||||||||||||||||||||||||||||||||||||||||||||||||||||||||||||||||||||||||||||||
| FrA_L | ParA_R | <0.001 | |||||||||||||||||||||||||||||||||||||||||||||||||||||||||||||||||||||||||||||||||||||||||||||||||
| FrA_L | DB_L | <0.001 | |||||||||||||||||||||||||||||||||||||||||||||||||||||||||||||||||||||||||||||||||||||||||||||||||
| TeA_R | VTA_L | <0.001 | |||||||||||||||||||||||||||||||||||||||||||||||||||||||||||||||||||||||||||||||||||||||||||||||||
| DB_L | IPAC_L | <0.001 | |||||||||||||||||||||||||||||||||||||||||||||||||||||||||||||||||||||||||||||||||||||||||||||||||
| V1, Cortex- Visual; AcbC, Nucleus Accumbens Core; CiC, Cortex- Cingulate; In, Cortex- Insular; mPFC, Cortex-Medial Prefrontal; IPAC, Posterior Limb of the Anterior Commissure; VP, Ventral Pallidum; ZI, Zona Incerta; FrA, Cortex- Frontal Association; S1, Cortex- Somatosensory; ParA, Cortex- Parietal Association; DB, Diagonal Band; TeA, Cortex- Temporal Association; VTA, Ventral Tegmental Area; AcbSh, Nucleus Accumbens Shell; SC, Superior Colliculus; OFC, Cortex- Orbitofrontal; ON, Olfactory Nuclei; MR, Mesencephalic Region; PAG, Periaqueductal Grey. | |||||||||||||||||||||||||||||||||||||||||||||||||||||||||||||||||||||||||||||||||||||||||||||||||||
No intergroup differences in global topological properties
There were no significant differences in global network properties (path length (Lp), clustering coefficient (Cp), global efficiency (Eglob), or local efficiency (Eloc), σ, γ, λ) between aged rats and young rats (p > 0.05) (Table 3 and Figures 2, 3).
Table 3. Intergroup differences of global network properties.
| Global network properties | p values |
| Path length | 0.498 |
| Clustering coefficient | 0.160 |
| Global efficiency | 0.456 |
| Local efficiency | 0.652 |
| σ | 0.594 |
| γ | 0.669 |
| λ | 0.350 |
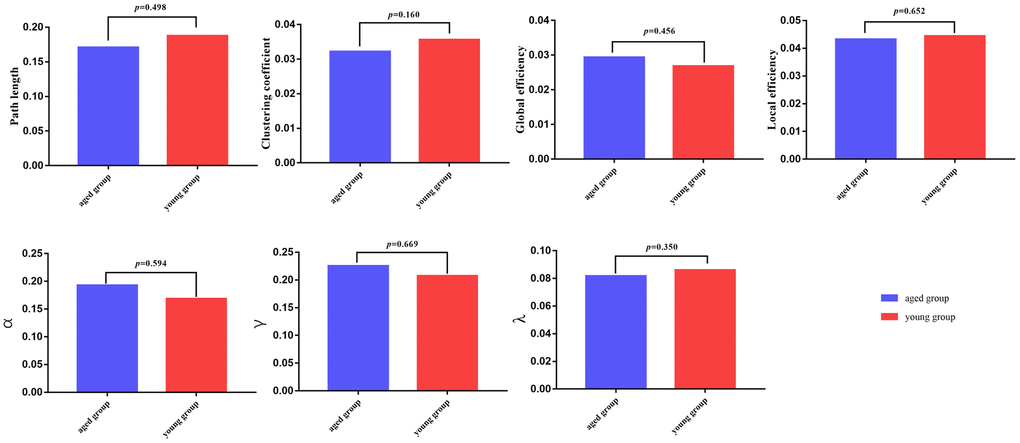
Figure 2. Global parameters are displayed in the bar chart, with blue bars for the aged rats and red bars for the young rats. In all of the parameters, no significant differences were found between the aged group and young group.
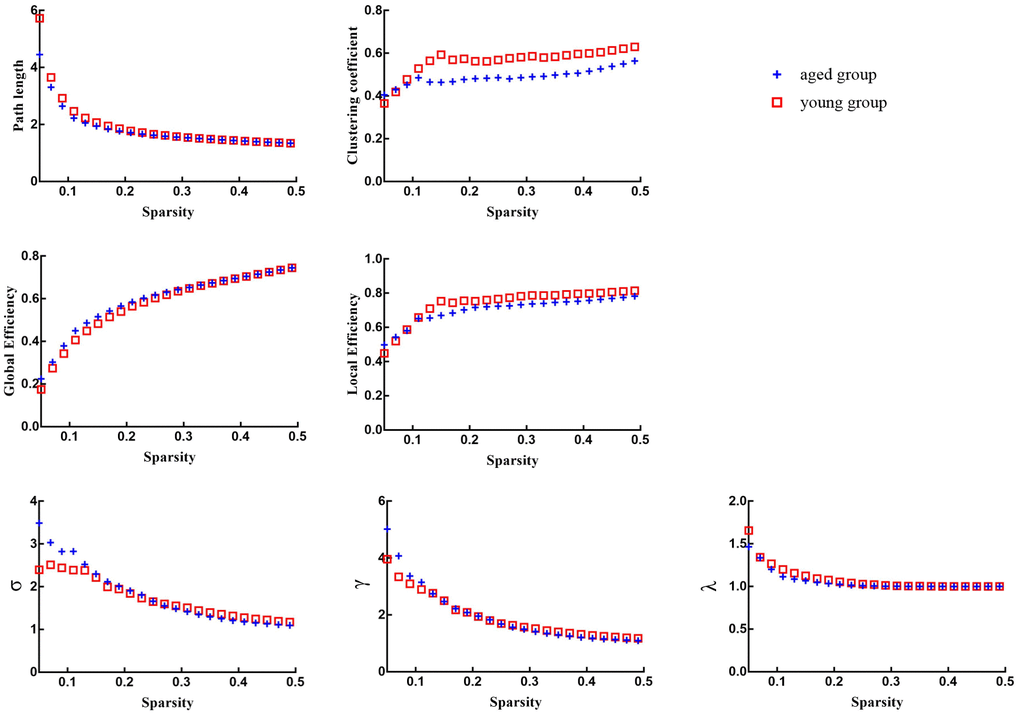
Figure 3. Global network properties of aged rats and young rats across a specific range of sparsity (0.05-0.5) at an interval of 0.01.
Lower regional topological properties of the aged brain metabolic network
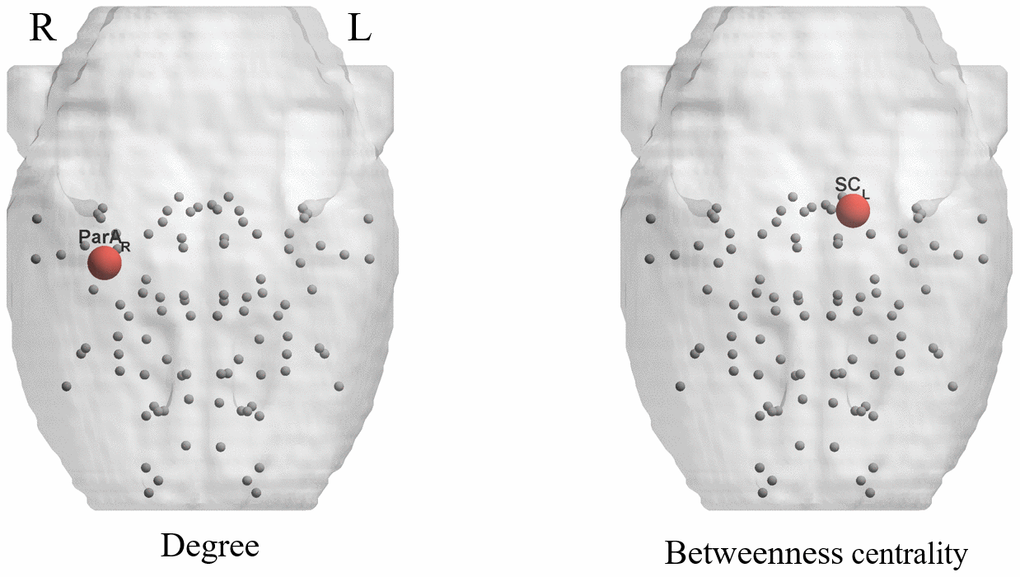
Intergroup differences of the regional network parameters are listed in Table 4. Compared with young rats, aged rats showed significantly lower betweenness centrality (BC) in the left superior colliculus (p < 0.001) and a lower degree (D) in the right parietal association cortex (p < 0.001) (Figure 4).
Table 4. Brain regions show significant differences in any of the three nodal characteristics.
| Brain regions | p values | ||
| Betweenness centrality | Degree | Efficiency | |
| Young rats>Aged rats | |||
| Cortex_Parietal_Association_R | - | <0.001 | - |
| Superior_Colliculus_L | <0.001 | - | - |
Lower robustness to virtual attacks in the aged brain metabolic network
Compared with aged rats, the networks of young rats were generally more robust to random failure and targeted attack in order of nodal BC.
Random failure analysis
When 1%, 4%, 5%, 9%, 13%, 15%, 17%, 22%, 24%, 27%, 39%, 41%, 44% and 67% of nodes were randomly removed, the Cp of brain networks in aged rats was significantly lower than that in young rats (p < 0.05). When 41%, 70% and 73% of nodes were randomly removed, the Eloc of brain networks in aged rats was significantly lower than that in young rats (p < 0.05) (Figure 5).
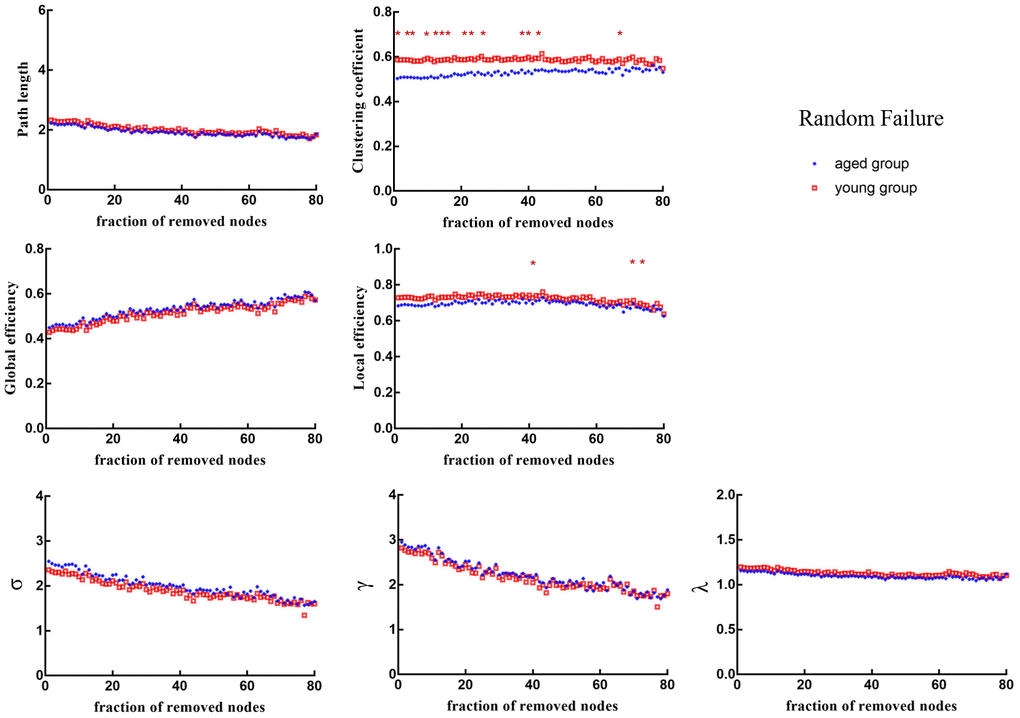
Figure 5. Changes in topological properties of the global network of the remaining network after random failure. The red * marker represents significant differences between aged rats and young rats.
Targeted attack analysis
When 39%, 40%, 43%, 44%, 45%, 50% and 53% of nodes were removed in order of nodal BC, the Eloc of brain networks in aged rats was significantly lower than that in young rats (p < 0.05) (Figure 6). Figure 7 shows the brain regions in descending order of BC. We also calculated the size of the largest remaining component when nodes were continuously removed. When the nodes were removed, the size of the largest connecting component in both groups steadily and approximately decreased (p > 0.05) (Figure 8).
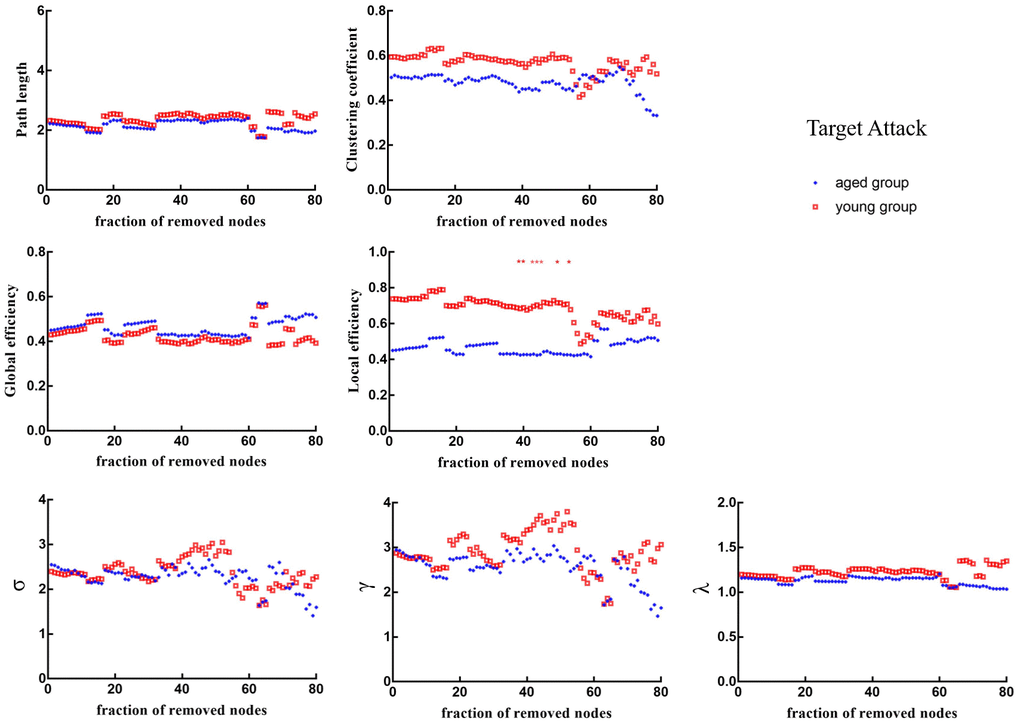
Figure 6. Changes in topological properties of the global network of the remaining network after target attack in order of nodal betweenness centrality. The red * marker represents significant differences between aged rats and young rats.
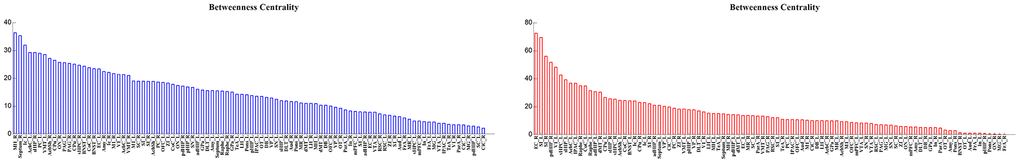
Figure 7. Hubs in decreasing order of betweenness centrality in the aged group (blue) and the young group (red).
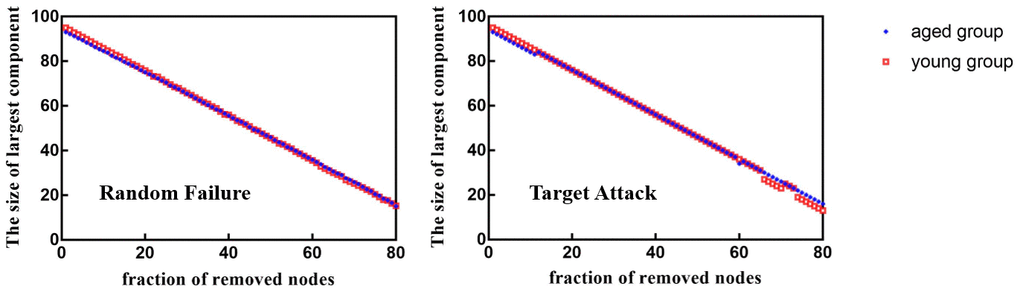
Figure 8. Between-group differences in network resilience to target attack and random failure.
Discussion
In the current study, we investigated differences in the brain metabolic network between aged rats and young rats based on 18F-FDG PET imaging. Our main results were as follows: (1) Compared to young rats, metabolic connectivity between regions related to visual, auditory, and olfactory senses was significantly reduced in aged rats, as well as significantly increased between limbic brain regions; (2) For global network properties, there were no significant differences between aged rats and young rats (p > 0.05); (3) In terms of regional nodal characteristics, the aged rats showed significantly lower BC in the left superior colliculus (p < 0.001) and lower degree in the right parietal association cortex (p < 0.001); (4) With regard to network robustness, the brain metabolic networks of aged rats were more vulnerable to simulated damage, which showed significantly lower Eloc and Cp than those of young rats against targeted attacks and random failures.
Degenerative changes caused by aging may affect the sensory experience, including vision, auditory and related cognitive domains [11]. Such changes occur as a part of normal physiological processes and may be irreversible [12]. In this study, the results demonstrated a decrease in metabolic connectivity between brain regions related to sensory experience that provided a basis to explain the pathogenesis of age-associated decline in sensory experience. However, the metabolic connectivity between emotion-related brain regions, such as raphe nuclei and nucleus accumbens, was significantly enhanced in aged rats. Raphe nuclei degeneration is related to the neurobiology of depression and is a common disorder in old age [13, 14]. Abnormal activation of raphe nuclei in metabolic connectivity might provide a new perspective for exploring the mechanism of depression in late life. The nucleus accumbens core, a limbic and premotor system nexus region, directly regulates behavior related to reward and motivation [15]. Consistent with the findings of this study, despite cognitive deficits, older adults have been reported to be sensitive to affective manipulations, such as reward motivation [16].
Studying the complex behavior of the brain from a brain network perspective will likely improve our understanding of brain function in health and disease states. Since animal models provide an understanding of disease progression, treatment and repair, research on extending brain networks to animal models has attracted increasing attention. Recent studies on brain network changes associated with aging have shown that node betweenness changes significantly with increasing aging [7]. Consistent with our study, the efficiency of information transfer in the left superior colliculus and the right parietal association cortex of aged rats was significantly lower than that of young rats.
The superior colliculus is primarily involved in integrating multisensory information that serves to guide and coordinate orienting motor responses toward visual and auditory signals in space [17]. Typically, visual and auditory impairments are signs of aging, and aging can have a detrimental effect on complex audiovisual interactions. Costa et al. [18] performed extracellular single-unit recording in the superior colliculus of anesthetized Sprague–Dawley adult (10-12 months) and aged (21-22 months) rats. The results showed that the audiovisual interactions in the superior colliculus were more numerous in adult rats (38%) than in aged rats. Moreover, spectral and temporal auditory processing in the superior colliculus is also impaired during aging [19]. In the present study, the significantly lower BC in the left superior colliculus of aged rats was thought to be associated with decreased audiovisual interactions with age.
The parietal association cortex, also known as the posterior parietal/anterior medial cortex, is a multichannel sensory region involved in spatial navigation, spatial memory, and associative tasks between different sensory patterns in rats [20, 21]. Meanwhile, the parietal association cortex is part of the retrosplenial cortex, an important cortical region that is closely related to the sensory-cognitive network [22]. As aging is characterized by cognitive impairment, our finding that the metabolic brain network of aged rats had a significantly lower degree in the right parietal association cortex would be consistent with its cognitive role. Cognitive impairments, such as learning and memory, are well-known features of the aging process [23, 24]. Rodent models have been frequently used in aging research to study the biochemical and functional effects of aging [25]. Compared with young rats, aged rats show poor spatial learning ability and behavioral flexibility, and the brain volume is correspondingly decreased in cognitive brain areas [26, 27]. Based on brain network analysis, our findings suggest that rats and humans exhibit similar changes in cognitive-related brain regions with age, providing further support for assessing whether changes in topological properties are associated with the behavioral effects of aging.
However, aging in healthy humans typically involves changes in the prefrontal and selective temporal brain regions, according to magnetic resonance imaging (MRI) studies [5, 28]. The characteristics of the aging brain structural network in rats are mainly manifested in the prefrontal/insula and temporal association/perirhinal cortices, as well as the cerebellum and olfactory bulb [2]. It is worth noting that there are some differences between the results of this study and previous studies, which may be due to different neuroimaging methods, nonhuman animal models and analysis methods of network properties [7].
The brain responds robustly to physical damage. Previous studies have indicated that human brain networks are remarkably resilient to different types of lesions compared to other types of complex networks, such as random or scale-free networks [29]. Furthermore, previous findings suggested that network-level robustness might serve as a biomarker of age-related cognitive decline in normal middle-aged individuals decades before the onset of overt cognitive impairment [30]. That said, exploring age-related brain robustness could provide a basis for distinguishing healthy aging from the early stages of degenerative neurological diseases, such as Alzheimer’s disease. In general, the complex network robustness relies heavily on its organizational structure and attack nature [29]. For the latter, two methods are usually applied: random deletion of and targeted attacks on nodes/edges according to their centrality in the network [31]. Damage to specific regions of the brain or their connections is simulated by removing nodes or edges [32]. In addition to the computational lesion study, a further empirical study might also be required. However, it has been difficult to quantify the extent of this virtual damage in vivo. Indeed, the node elimination strategy is appropriate for simulating damage to specific brain regions in computational lesion studies [33]. Then, the robustness of the network is usually analyzed based on the ability of the graph to remain in one part despite the removal of elements [29]. Previous studies examining the robustness properties of human networks have shown that the brain networks of the aged group are just as resilient to random failures as those of the young group but more vulnerable to targeted attacks [7]. In this study, there was no significant difference in the size of the largest connected component between aged and young rats under random or targeted attacks. Additionally, we found that the global properties of the remaining networks of aged rats were significantly decreased after random failure (Eloc and Cp) or targeted attack (Eloc), although there was no significant difference in the global properties of the intact brain networks between the aged rats and young rats. The changes in network parameters can reflect the interruption in the overall performance of the network, such as stability and robustness [7]. In cerebral terms, aging begins long before symptoms manifest. Aging causes gradual degeneration of the myelin sheaths that surround certain nerves, which in turn leads to a decline in the function of neurons and the functional connections between them. Even without symptoms of dysfunction, the network robustness of the normal aging brain has become abnormal. The results of our study were consistent with previous studies on the network robustness of the aging brain; that is, the brain networks of the aged group showed a significant decrease in global efficiency against simulated attacks [34], suggesting that aging brains are vulnerable to severe brain dysfunction even with minor damage. Consistently, human studies have reported that network integrity is decreased in healthy aging, but this decrease is accelerated in Alzheimer's networks, with specific systems hit the hardest [35].
As mentioned above, we investigated differences in the brain metabolic network between aged rats and young rats based on 18F-FDG PET imaging, involving topological properties and network robustness. The results showed decreased regional network measures and vulnerable robustness of brain metabolic networks in aged rats. The findings support the idea that aged rats have similar aging-related changes in the brain metabolic network to the human brain, which can be used as a model for aging studies to provide targets for potential therapies that promote healthy aging.
In addition, understanding the molecular and biological mechanisms of aging will be a key step in preventing, slowing and treating age-related diseases, such as Alzheimer's disease (AD) and Parkinson's disease (PD) [36]. However, there is no gold standard tool for evaluating healthy aging, nor is there a single indicator that can be used as a sensitive and specific biomarker of aging [37]. Currently, epigenetic clocks, a method for using human DNA methylation data to develop biomarkers of aging, have been noted as the most successful aging biomarkers [38]. With the rising prevalence of neurodegenerative diseases of aging, such as AD and PD, several studies have explored epigenetic clocks in brain tissue [39, 40]. This study showed age-related topological changes in some brain regions of the metabolic network, which provided an important basis for further locating epigenetic clocks in brain tissue. Furthermore, these findings, when combined with recently identified molecular and DNA-based markers, have greater potential to improve the prediction of healthy aging and contribute to aging, being better described as a multifactorial interactive process between biological and molecular mechanisms.
There are some limitations to this study. Given the more complex structure and function of the human brain, the study of aged rats might not fully reflect the effects of aging on the human brain. However, it opens the possibility of aging-related research at multiple macro- and microlevels, since the brain of aged rats had similar aging-related changes to the human brain. Another potential limitation was that only female rats were selected as subjects. In the future, we will further explore the sex differences of brain metabolic networks between male and female rats. In addition, it was only an observational study with a cross-sectional comparison. A longitudinal comparison of aging-related brain network changes in rats still needs further exploration.
Materials and Methods
Rats
In the study, 24 healthy aged female Sprague–Dawley (SD) rats (weight 350–380 g, age 18 months) and 24 healthy young female SD rats (weight 180–200 g, age 8 weeks) were included. Rats were raised under laboratory conditions of 21° C–23° C with a 12-h light-dark cycle and given sufficient food and water for 1 week before the examination.
All rats were obtained from the Shanghai Slack Laboratory Animal Limited Liability Company (Shanghai, China). All procedures for animals were carried out in accordance with the Guide for the Care and Use of Laboratory Animals (US National Institutes of Health) and approved by the Animal Ethical Committee of Shanghai University of Traditional Chinese Medicine.
18 F-FDG PET/CT scan
Scanning was conducted on a PET/CTR4 bed (Siemens Inc., USA). To enhance brain absorption of the tracer, all rats were fasted overnight before scanning. After 0.5 mCi 18F-FDG was injected through the tail vein, the rats were placed in a quiet space for an uptake period of 40 minutes. During scanning, halothane gas was used to anesthetize the rats, with a 5% induction and a 1.5% maintenance dose. After acquisition, the attenuation correction was automatically carried out, and images were obtained in a 128 × 128 matrix and recombined in OSEM3D mode. PET/CT acquisition showed the following parameters: spherical tube voltage (80 kV), current (500 μA), and time (492 s).
All rats were in a normal active state before 18F-FDG PET/CT scanning. One aged rat was excluded from the final analysis because of poor image quality. Thus, 23 aged rats and 24 young rats were included in the final data analysis.
Data preprocessing
Data preprocessing was performed using the Statistical Parametric Mapping 8 toolbox (SPM 8; http://www.fil.ion.ucl.ac.uk/spm/) based on the MATLAB 2013b platform (Mathworks, Inc., Natick, MA, USA). Preprocessing was performed as previously reported [41]. The DICOM-format PET/CT images were adapted into the NIFTI format by ImageJ software (Image Processing and Analysis in Java, National Institutes of Health, Bethesda, MD, USA). A hand drawing mask was applied to extract the rats’ PET images of the skull-stripped brain. The orientation of these images was modified by resetting the origin and adjusting pitch/roll/yaw parameters according to a standard template. To fit the algorithm in SPM8, the voxels were upscaled by a factor of 10. Accordingly, each brain PET image was normalized and resampled to a resolution of 2.06 × 2.06 × 2 mm3. In addition, the images were smoothed by a full width at half maximum (FWHM) twice the voxel size (FWHM = 4 mm). Finally, the 18F-FDG uptake value of each voxel was globally normalized by the mean uptake value of the whole brain [42].
Construction and property analysis of the metabolic brain network
Metabolic brain network construction and network property analysis were processed with the Brain Connectivity Toolbox (BCT, version 2017-15-01, http://www.brain-connectivity-toolbox.net/). Based on the standard rat brain template including 96 brain regions [43], the standard uptake value (SUV) of each brain region of all rats was extracted, and the Pearson correlation coefficient of each two brain regions was calculated to generate the group-level metabolic brain network in an intersubject manner. The nodes of the network were defined as the brain regions. The edges of the network were considered to be the correlation between each pair of brain regions. Figure 9 shows the locations of the 96 brain regions, and the explanation of the abbreviated region names is given in Table 1. To ensure that all of the networks had the same number of edges, the specific range of sparsity (0.05-0.5) at an interval of 0.01 was set for the correlation matrix [44], resulting in a set of undirected and unweighted binary networks. Finally, we explored the differences in topological properties of the metabolic brain network in aged rats and young rats by using graph theory network analysis. In addition, a simple analysis of network robustness against random failure and targeted attacks was performed. The diagram of network construction and analysis is shown in Figure 10.
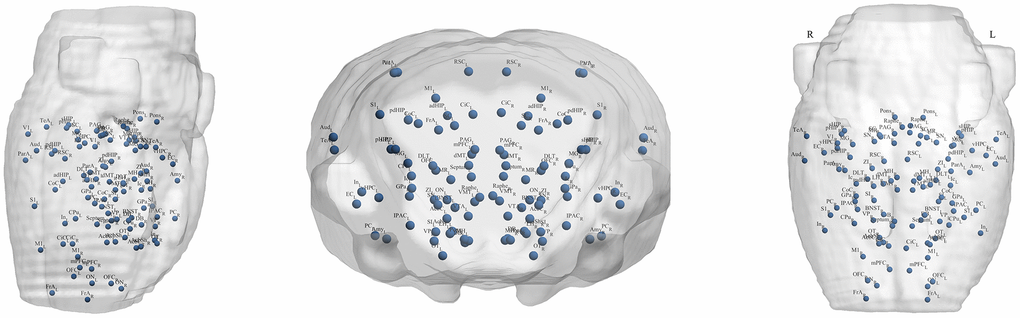
Figure 9. Locations of the 96 brain regions.
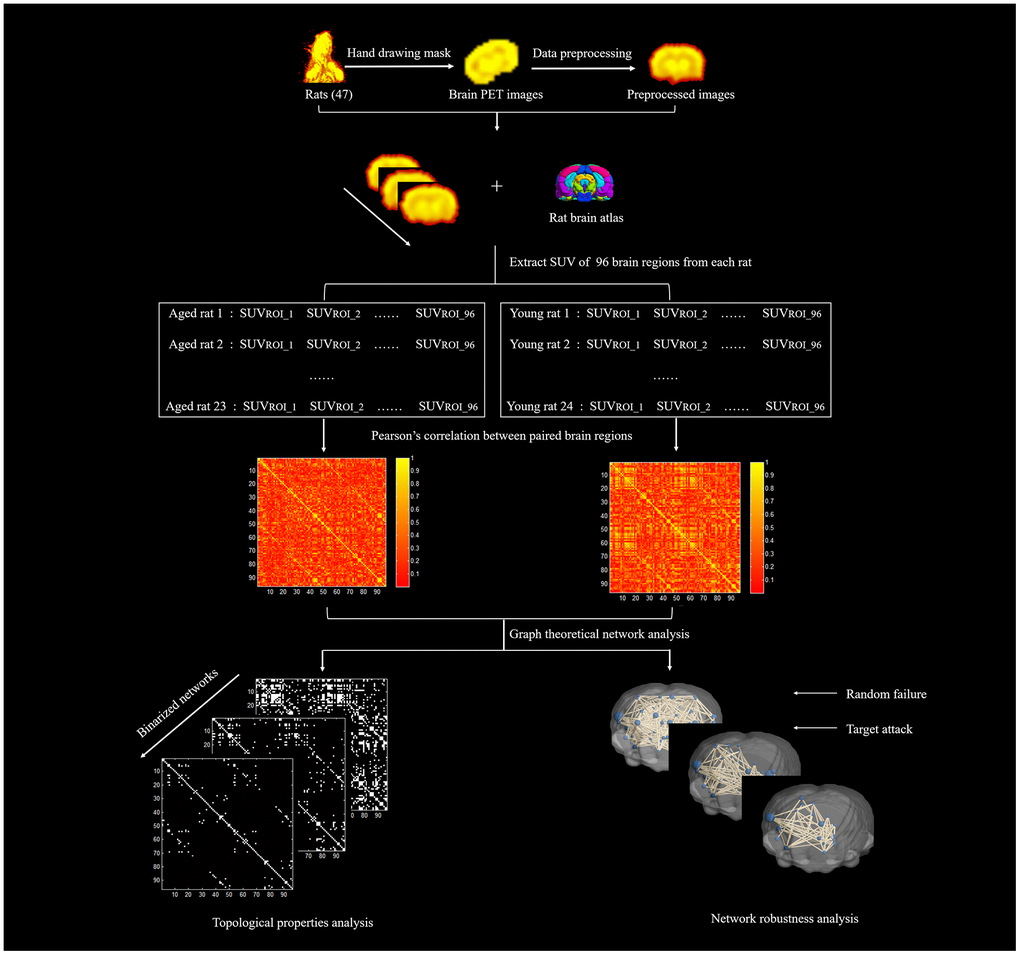
Figure 10. The diagram of network construction and analysis.
Global network properties
The topological properties of the global network, including path length (Lp), clustering coefficient (Cp), global efficiency (Eglob), local efficiency (Eloc) and small-worldness indices (σ, γ, λ), were calculated to describe the network’s global and local information transmission capability [45]. The Lp of the network refers to the average of the shortest path’s edges in the network’s node pairs [46]. The Cp of a node is the ratio of existing edges to all the others in its direct neighbors. The Cp of a network is the mean of Cp over all nodes, reflecting the local interconnectivity of the network [46]. Eglob refers to the inverse of all the network nodes’ average shortest Lp [45], and Eloc represents that of a node’s nearest neighbors [47]. By comparing the Cp and Lp to the mean Cprand and Lprand of 5000 random networks, the normalized Cp (γ) and normalized Lp (λ) were calculated. A network’s small-worldness is defined as σ = γ/λ, representing the balance between all of the network nodes’ segregation and integration [48, 49]. When the ratio is greater than 1, the network is considered a small-worldness network.
Regional network properties
Three topological characteristics of the regional network were used to demonstrate the nodal characteristics: degree (D), betweenness centrality (BC) and node efficiency (Enod). D refers to the number of neighbors of a given node, reflecting the importance of the node [50]. BC is defined as the fraction of shortest paths of a network through a given node, which is an indicator of the importance of a node in the network [51]. Enod is the average of the inverse of the shortest path between a given node and all other nodes and is an evaluation of regional connectivity [52].
Network robustness
Network robustness against simulated damage was analyzed by the iterative ‘random’ and ‘targeted’ removal of nodes [7, 53]. A random node attack refers to the continuous removal of a certain proportion of random nodes from the 96 × 96 connectivity matrix. Each random removal of nodes was repeated 40 times. In procedures requiring the targeted node attack, the 96 nodes are arranged in order of BC value from high to low. Nodes were removed in order of BC value, starting with the nodes of higher connectivity. In the case that information transfer follows the shortest path, BC reflects the centrality of nodes in the network. Therefore, the nodes with high centrality have a greater impact on the information transfer in the network. After each removal of nodes, the above global topological measures, including Lp, Cp, Eglob, Eloc, σ, γ, and λ, were calculated for the resulting networks thresholded at minimum density with full connectivity. In addition, the size of the largest connected component was calculated when nodes were continuously removed. Additionally, the network properties of the resulting networks after each random attack were averaged across 40 repetitions of random removal.
Statistical analysis
A 5000-repetition nonparametric permutation test was used to determine the between-group differences’ statistical significance. Metabolic Connectivity Analysis. We performed statistical comparison on the edges of the metabolic network between groups by 5000 permutation tests. In each repetition, the SUV of the ROIs of all rats was randomly assigned to two new groups with the sample sizes as the original groups, and then the Pearson correlation coefficient of each two brain regions was calculated to generate a new group-level metabolic brain network. After 5000 permutations, we obtained 5000 random intergroup differences in metabolic connectivity. Thus, the p value was obtained according to the percentile position of the real intergroup difference in the corresponding permutation distribution. Graph Theoretical Network Analysis. First, during each repetition, the SUV values of each rat were randomly assigned to either the aged group or the young group to form two randomized groups with the same number of rats as the original group. Second, the undirected and unweighted binarized network was established for each randomized group based on the new dataset. Third, the network properties of randomized groups were calculated through all sparsity thresholds, and the area under the curve (AUC) corresponding to the sparsity ranges of both groups was calculated in each permutation cycle. Last, the AUC difference between the two groups obtained under 5000 permutations constituted the permutation distribution under the original hypothesis. The p value was obtained from the AUC’s actual intergroup difference at the distribution. The above procedure was also used to investigate significant differences in the network robustness between the two groups. After each removal of nodes, the network properties of the two remaining networks were compared by a nonparametric permutation test with 5000 repetitions mentioned above. The significance level for the global network analysis was set at p < 0.05. p <0.05 after FDR correction for multiple comparisons was the significance level for regional network analysis.
Abbreviations
18F-FDG PET: [18F]Fluorodeoxyglucose with positron emission tomography; Lp: path length; Cp: clustering coefficient; Eglob: global efficiency; Eloc: local efficiency; BC: betweenness centrality; D: degree; Enod: node efficiency; SUV: standard uptake value; AUC: area under the curve.
Author Contributions
Xin Xue and Jia-Jia Wu contributed equally to this work. Xin Xue and Jia-Jia Wu: data analysis and manuscript drafting. Bei-Bei Huo, Xiang-Xin Xing: conducted experiments and data collection; Jie Ma: resources; Yu-Lin Li: visualization; Xu-Yun Hua, Mou-Xiong Zheng, and Jian-Guang Xu: study design and manuscript revision. All authors read and approved the final manuscript.
Conflicts of Interest
The authors declare that they have no conflicts of interest.
Funding
This work was supported by the National Key R&D Program of China (Grant No. 2018YFC2001600, 2018YFC2001604); National Natural Science Foundation of China (Grant Nos.: 81802249, 81871836, 81902301); Shanghai Rising-Star Program (Grant No.: 19QA1409000); Shanghai Municipal Commission of Health and Family Planning (Grant No.: 2018YQ02); Shanghai Youth Top Talent Development Plan and Shanghai “Rising Stars of Medical Talent” Youth Development Program (Grant No.: RY411.19.01.10); Shanghai Key Laboratory of Peripheral Nerve and Microsurgery (17DZ2270500), Key Laboratory of Hand Reconstruction, Ministry of Health, Shanghai, People’s Republic of China.
References
- 1. Damoiseaux JS. Effects of aging on functional and structural brain connectivity. Neuroimage. 2017; 160:32–40. https://doi.org/10.1016/j.neuroimage.2017.01.077 [PubMed]
- 2. Alexander GE, Lin L, Yoshimaru ES, Bharadwaj PK, Bergfield KL, Hoang LT, Chawla MK, Chen K, Moeller JR, Barnes CA, Trouard TP. Age-Related Regional Network Covariance of Magnetic Resonance Imaging Gray Matter in the Rat. Front Aging Neurosci. 2020; 12:267. https://doi.org/10.3389/fnagi.2020.00267 [PubMed]
- 3. Bonte S, Vandemaele P, Verleden S, Audenaert K, Deblaere K, Goethals I, Van Holen R. Healthy brain ageing assessed with 18F-FDG PET and age-dependent recovery factors after partial volume effect correction. Eur J Nucl Med Mol Imaging. 2017; 44:838–49. https://doi.org/10.1007/s00259-016-3569-0 [PubMed]
- 4. Huang CC, Hsieh WJ, Lee PL, Peng LN, Liu LK, Lee WJ, Huang JK, Chen LK, Lin CP. Age-related changes in resting-state networks of a large sample size of healthy elderly. CNS Neurosci Ther. 2015; 21:817–25. https://doi.org/10.1111/cns.12396 [PubMed]
- 5. Zhao T, Cao M, Niu H, Zuo XN, Evans A, He Y, Dong Q, Shu N. Age-related changes in the topological organization of the white matter structural connectome across the human lifespan. Hum Brain Mapp. 2015; 36:3777–92. https://doi.org/10.1002/hbm.22877 [PubMed]
- 6. Geerligs L, Renken RJ, Saliasi E, Maurits NM, Lorist MM. A Brain-Wide Study of Age-Related Changes in Functional Connectivity. Cereb Cortex. 2015; 25:1987–99. https://doi.org/10.1093/cercor/bhu012 [PubMed]
- 7. Liu Z, Ke L, Liu H, Huang W, Hu Z. Changes in topological organization of functional PET brain network with normal aging. PLoS One. 2014; 9:e88690. https://doi.org/10.1371/journal.pone.0088690 [PubMed]
- 8. Rocher AB, Chapon F, Blaizot X, Baron JC, Chavoix C. Resting-state brain glucose utilization as measured by PET is directly related to regional synaptophysin levels: a study in baboons. Neuroimage. 2003; 20:1894–8. https://doi.org/10.1016/j.neuroimage.2003.07.002 [PubMed]
- 9. Kalpouzos G, Chételat G, Baron JC, Landeau B, Mevel K, Godeau C, Barré L, Constans JM, Viader F, Eustache F, Desgranges B. Voxel-based mapping of brain gray matter volume and glucose metabolism profiles in normal aging. Neurobiol Aging. 2009; 30:112–24. https://doi.org/10.1016/j.neurobiolaging.2007.05.019 [PubMed]
- 10. Pardo JV, Lee JT, Sheikh SA, Surerus-Johnson C, Shah H, Munch KR, Carlis JV, Lewis SM, Kuskowski MA, Dysken MW. Where the brain grows old: decline in anterior cingulate and medial prefrontal function with normal aging. Neuroimage. 2007; 35:1231–7. https://doi.org/10.1016/j.neuroimage.2006.12.044 [PubMed]
- 11. de Villers-Sidani E, Merzenich MM. Lifelong plasticity in the rat auditory cortex: basic mechanisms and role of sensory experience. Prog Brain Res. 2011; 191:119–31. https://doi.org/10.1016/B978-0-444-53752-2.00009-6 [PubMed]
- 12. Mohamed ME, El-Shaarawy EA, Youakim MF, Shuaib DM, Ahmed MM. Aging changes in the retina of male albino rat: a histological, ultrastructural and immunohistochemical study. Folia Morphol (Warsz). 2019; 78:237–58. https://doi.org/10.5603/FM.a2018.0075 [PubMed]
- 13. Lessard-Beaudoin M, Yu-Taeger L, Laroche M, Singer E, Riess O, Nguyen HH, Graham RK. Olfactory bulb atrophy and caspase activation observed in the BACHD rat models of Huntington disease. Neurobiol Dis. 2019; 125:219–31. https://doi.org/10.1016/j.nbd.2019.02.002 [PubMed]
- 14. Tsopelas C, Stewart R, Savva GM, Brayne C, Ince P, Thomas A, Matthews FE, and Medical Research Council Cognitive Function and Ageing Study. Neuropathological correlates of late-life depression in older people. Br J Psychiatry. 2011; 198:109–14. https://doi.org/10.1192/bjp.bp.110.078816 [PubMed]
- 15. Proaño SB, Meitzen J. Estradiol decreases medium spiny neuron excitability in female rat nucleus accumbens core. J Neurophysiol. 2020; 123:2465–75. https://doi.org/10.1152/jn.00210.2020 [PubMed]
- 16. Bowen HJ, Gallant SN, Moon DH. Influence of Reward Motivation on Directed Forgetting in Younger and Older Adults. Front Psychol. 2020; 11:1764. https://doi.org/10.3389/fpsyg.2020.01764 [PubMed]
- 17. Lau C, Manno FA, Dong CM, Chan KC, Wu EX. Auditory-visual convergence at the superior colliculus in rat using functional MRI. Annu Int Conf IEEE Eng Med Biol Soc. 2018; 2018:5531–6. https://doi.org/10.1109/EMBC.2018.8513633 [PubMed]
- 18. Costa M, Piché M, Lepore F, Guillemot JP. Age-related audiovisual interactions in the superior colliculus of the rat. Neuroscience. 2016; 320:19–29. https://doi.org/10.1016/j.neuroscience.2016.01.058 [PubMed]
- 19. Costa M, Lepore F, Guillemot JP. Spectral and temporal auditory processing in the superior colliculus of aged rats. Neurobiol Aging. 2017; 57:64–74. https://doi.org/10.1016/j.neurobiolaging.2017.05.015 [PubMed]
- 20. Mesulam MM. From sensation to cognition. Brain. 1998; 121:1013–52. https://doi.org/10.1093/brain/121.6.1013 [PubMed]
- 21. Torrealba F, Valdés JL. The parietal association cortex of the rat. Biol Res. 2008; 41:369–77. https://doi.org/10.4067/S0716-97602008000400002 [PubMed]
- 22. Wang J, Nie B, Duan S, Zhu H, Liu H, Shan B. Functionally Brain Network Connected to the Retrosplenial Cortex of Rats Revealed by 7T fMRI. PLoS One. 2016; 11:e0146535. https://doi.org/10.1371/journal.pone.0146535 [PubMed]
- 23. Cohen RA, Marsiske MM, Smith GE. Neuropsychology of aging. Handb Clin Neurol. 2019; 167:149–80. https://doi.org/10.1016/B978-0-12-804766-8.00010-8 [PubMed]
- 24. Park DC, Reuter-Lorenz P. The adaptive brain: aging and neurocognitive scaffolding. Annu Rev Psychol. 2009; 60:173–96. https://doi.org/10.1146/annurev.psych.59.103006.093656 [PubMed]
- 25. Hoekzema E, Herance R, Rojas S, Pareto D, Abad S, Jiménez X, Figueiras FP, Popota F, Ruiz A, Torrent È, Fernández-Soriano FJ, Rocha M, Rovira M, et al. The effects of aging on dopaminergic neurotransmission: a microPET study of [11C]-raclopride binding in the aged rodent brain. Neuroscience. 2010; 171:1283–6. https://doi.org/10.1016/j.neuroscience.2010.10.012 [PubMed]
- 26. Hamezah HS, Durani LW, Ibrahim NF, Yanagisawa D, Kato T, Shiino A, Tanaka S, Damanhuri HA, Ngah WZ, Tooyama I. Volumetric changes in the aging rat brain and its impact on cognitive and locomotor functions. Exp Gerontol. 2017; 99:69–79. https://doi.org/10.1016/j.exger.2017.09.008 [PubMed]
- 27. Mota C, Taipa R, das Neves SP, Monteiro-Martins S, Monteiro S, Palha JA, Sousa N, Sousa JC, Cerqueira JJ. Structural and molecular correlates of cognitive aging in the rat. Sci Rep. 2019; 9:2005. https://doi.org/10.1038/s41598-019-39645-w [PubMed]
- 28. Colangeli S, Boccia M, Verde P, Guariglia P, Bianchini F, Piccardi L. Cognitive Reserve in Healthy Aging and Alzheimer’s Disease: A Meta-Analysis of fMRI Studies. Am J Alzheimers Dis Other Demen. 2016; 31:443–9. https://doi.org/10.1177/1533317516653826 [PubMed]
- 29. Aerts H, Fias W, Caeyenberghs K, Marinazzo D. Brain networks under attack: robustness properties and the impact of lesions. Brain. 2016; 139:3063–83. https://doi.org/10.1093/brain/aww194 [PubMed]
- 30. Korthauer LE, Zhan L, Ajilore O, Leow A, Driscoll I. Disrupted topology of the resting state structural connectome in middle-aged APOE ε4 carriers. Neuroimage. 2018; 178:295–305. https://doi.org/10.1016/j.neuroimage.2018.05.052 [PubMed]
- 31. Bullmore E, Sporns O. Complex brain networks: graph theoretical analysis of structural and functional systems. Nat Rev Neurosci. 2009; 10:186–98. https://doi.org/10.1038/nrn2575 [PubMed]
- 32. Albert R, Barabasi AL. Statistical mechanics of complex networks. Rev Mod Phys. 2002; 74:47–97. https://doi.org/10.1103/RevModPhys.74.47
- 33. Shu P, Zhu H, Jin W, Zhou J, Tong S, Sun J. The Resilience and Vulnerability of Human Brain Networks Across the Lifespan. IEEE Trans Neural Syst Rehabil Eng. 2021; 29:1756–65. https://doi.org/10.1109/TNSRE.2021.3105991 [PubMed]
- 34. Gomez-Ramirez J, Li Y, Wu Q, Wu J. A Quantitative Study of Network Robustness in Resting-State fMRI in Young and Elder Adults. Front Aging Neurosci. 2016; 7:256. https://doi.org/10.3389/fnagi.2015.00256 [PubMed]
- 35. Dennis EL, Thompson PM. Functional brain connectivity using fMRI in aging and Alzheimer’s disease. Neuropsychol Rev. 2014; 24:49–62. https://doi.org/10.1007/s11065-014-9249-6 [PubMed]
- 36. Shireby GL, Davies JP, Francis PT, Burrage J, Walker EM, Neilson GW, Dahir A, Thomas AJ, Love S, Smith RG, Lunnon K, Kumari M, Schalkwyk LC, et al. Recalibrating the epigenetic clock: implications for assessing biological age in the human cortex. Brain. 2020; 143:3763–75. https://doi.org/10.1093/brain/awaa334 [PubMed]
- 37. Wagner KH, Cameron-Smith D, Wessner B, Franzke B. Biomarkers of Aging: From Function to Molecular Biology. Nutrients. 2016; 8:338. https://doi.org/10.3390/nu8060338 [PubMed]
- 38. Jylhävä J, Pedersen NL, Hägg S. Biological Age Predictors. EBioMedicine. 2017; 21:29–36. https://doi.org/10.1016/j.ebiom.2017.03.046 [PubMed]
- 39. Lu AT, Hannon E, Levine ME, Crimmins EM, Lunnon K, Mill J, Geschwind DH, Horvath S. Genetic architecture of epigenetic and neuronal ageing rates in human brain regions. Nat Commun. 2017; 8:15353. https://doi.org/10.1038/ncomms15353 [PubMed]
- 40. Grodstein F, Lemos B, Yu L, Iatrou A, De Jager PL, Bennett DA. Characteristics of Epigenetic Clocks Across Blood and Brain Tissue in Older Women and Men. Front Neurosci. 2021; 14:555307. https://doi.org/10.3389/fnins.2020.555307 [PubMed]
- 41. Huo BB, Shen J, Hua XY, Zheng MX, Lu YC, Wu JJ, Shan CL, Xu JG. Alteration of metabolic connectivity in a rat model of deafferentation pain: a 18F-FDG PET/CT study. J Neurosurg. 2019; 132:1295–303. https://doi.org/10.3171/2018.11.JNS181815 [PubMed]
- 42. Hou AL, Zheng MX, Hua XY, Huo BB, Shen J, Xu JG. Electroacupuncture-Related Metabolic Brain Connectivity in Neuropathic Pain due to Brachial Plexus Avulsion Injury in Rats. Front Neural Circuits. 2020; 14:35. https://doi.org/10.3389/fncir.2020.00035 [PubMed]
- 43. Schwarz AJ, Danckaert A, Reese T, Gozzi A, Paxinos G, Watson C, Merlo-Pich EV, Bifone A. A stereotaxic MRI template set for the rat brain with tissue class distribution maps and co-registered anatomical atlas: application to pharmacological MRI. Neuroimage. 2006; 32:538–50. https://doi.org/10.1016/j.neuroimage.2006.04.214 [PubMed]
- 44. Bullmore ET, Bassett DS. Brain graphs: graphical models of the human brain connectome. Annu Rev Clin Psychol. 2011; 7:113–40. https://doi.org/10.1146/annurev-clinpsy-040510-143934 [PubMed]
- 45. Latora V, Marchiori M. Efficient behavior of small-world networks. Phys Rev Lett. 2001; 87:198701. https://doi.org/10.1103/PhysRevLett.87.198701 [PubMed]
- 46. Watts DJ, Strogatz SH. Collective dynamics of ‘small-world’ networks. Nature. 1998; 393:440–2. https://doi.org/10.1038/30918 [PubMed]
- 47. Shah C, Liu J, Lv P, Sun H, Xiao Y, Liu J, Zhao Y, Zhang W, Yao L, Gong Q, Lui S. Age Related Changes in Topological Properties of Brain Functional Network and Structural Connectivity. Front Neurosci. 2018; 12:318. https://doi.org/10.3389/fnins.2018.00318 [PubMed]
- 48. Humphries MD, Gurney K. Network ‘small-world-ness’: a quantitative method for determining canonical network equivalence. PLoS One. 2008; 3:e0002051. https://doi.org/10.1371/journal.pone.0002051 [PubMed]
- 49. Li Y, Wang Y, Wang Y, Wang H, Li D, Chen Q, Huang W. Impaired Topological Properties of Gray Matter Structural Covariance Network in Epilepsy Children With Generalized Tonic-Clonic Seizures: A Graph Theoretical Analysis. Front Neurol. 2020; 11:253. https://doi.org/10.3389/fneur.2020.00253 [PubMed]
- 50. Xin Z, Chen X, Zhang Q, Wang J, Xi Y, Liu J, Li B, Dong X, Lin Y, Zhang W, Chen J, Luo W. Alteration in topological properties of brain functional network after 2-year high altitude exposure: A panel study. Brain Behav. 2020; 10:e01656. https://doi.org/10.1002/brb3.1656 [PubMed]
- 51. Rubinov M, Sporns O. Complex network measures of brain connectivity: uses and interpretations. Neuroimage. 2010; 52:1059–69. https://doi.org/10.1016/j.neuroimage.2009.10.003 [PubMed]
- 52. Jiang W, Zhao Z, Wu Q, Wang L, Zhou L, Li D, He L, Tan Y. Study on brain structure network of patients with delayed encephalopathy after carbon monoxide poisoning: based on diffusion tensor imaging. Radiol Med. 2021; 126:133–41. https://doi.org/10.1007/s11547-020-01222-x [PubMed]
- 53. Mohan A, De Ridder D, Vanneste S. Robustness and dynamicity of functional networks in phantom sound. Neuroimage. 2017; 146:171–87. https://doi.org/10.1016/j.neuroimage.2016.04.033 [PubMed]