


Introduction
Stroke is the leading cause of death among the Chinese, and ischemic stroke accounts for approximately 82% of cases [1]. The immune and inflammatory responses after an acute ischemic stroke are complex pathophysiological processes that affect the prognosis of the disease [2]. Researchers have described how inflammatory immune cells (neutrophils, T cells, platelets, dendritic cells, monocytes, and/or macrophages) infiltrate the brains of patients with stroke [3, 4]. There are well-known correlations between stroke and a number of common biological indices, such as the neutrophil/lymphocyte ratio and the platelet/lymphocyte ratio. However, new indices are necessary to fully assess the prognosis of patients with acute ischemic stroke.
The systemic immune-inflammation index (SII) is a new type of comprehensive inflammation index that reflects the balance of the host’s immune and inflammatory states. The index is defined as neutrophils × platelets/lymphocytes [5]. The SII was first proposed in liver cancer research, aiming to identify patients with a high risk of recurrence or death, so early intervention could be initiated [5, 6]. In recent years, research on thrombus inflammation has attracted increasing attention. It is known that the interaction of platelets and neutrophils drives the occurrence and development of inflammation and damages brain tissues [7]. To date, cross-sectional studies have explored the relationship between the SII and stroke. One of these studies showed that the SII is closely related to the severity of acute ischemic stroke on admission [8]. However, prospective cohort studies exploring this relationship in patients with ischemic stroke are rare. A multicenter, large sample cohort study with a long follow-up is particularly lacking.
Therefore, we hypothesized that the prognosis of patients with acute ischemic stroke is related to the SII. In this study, we aimed to explore the relationship between the SII and the short- and long-term prognosis of patients who had an acute ischemic stroke.
Results
Baseline characteristics
A total of 9,107 patients from the China National Stroke Registry III (CNSR-III) qualified for this study (Supplementary Figure 1 and Supplementary Table 1). The average age of the enrolled patients was 61.9 ± 11.1 years (Table 1). These patients were divided into four groups according to the SII quartile: quartile (Q)1, <366 × 109/L; Q2, 366–533 × 109/L; Q3, 534–799 × 109/L; and Q4, ≥800 × 109/L. The median time from symptom onset to admission was 10 (interquartile range [IQR], 3–25) h. For all patients, the median National Institutes of Health Stroke Scale (NIHSS) score at admission was 3 (IQR, 2–6) points. To exclude an effect of the pre-admission modified Rankin Scale (mRS) score on prognosis, the lack of significant group differences regarding the percentages of mRS scores before onset ≥3 was confirmed (P = 0.0603).
Table 1. Baseline characteristics of patients stratified by SII quartile.
| Variable | Total (n = 9,107) | SII quartile | P value | ||||||||||||||||||||||||||||||||||||||||||||||||||||||||||||||||||||||||||||||||||||||||||||||||
| Q1 (n = 2,269) | Q2 (n = 2,285) | Q3 (n = 2,279) | Q4 (n = 2,274) | ||||||||||||||||||||||||||||||||||||||||||||||||||||||||||||||||||||||||||||||||||||||||||||||||
| Demographic and clinical features | |||||||||||||||||||||||||||||||||||||||||||||||||||||||||||||||||||||||||||||||||||||||||||||||||||
| Age (years), mean ± SD | 61.9 ± 11.1 | 62.7 ± 10.7 | 61.4 ± 10.9 | 61.5 ± 11.3 | 61.9 ± 11.4 | 0.0004 | |||||||||||||||||||||||||||||||||||||||||||||||||||||||||||||||||||||||||||||||||||||||||||||
| Sex, Male, n (%) | 6,343 (69.7) | 1,566 (69.0) | 1,651 (72.3) | 1,589 (69.7) | 1,537 (67.6) | 0.0063 | |||||||||||||||||||||||||||||||||||||||||||||||||||||||||||||||||||||||||||||||||||||||||||||
| Smoker, n (%) | 3,317 (36.4) | 830 (36.6) | 891 (39.0) | 842 (37.0) | 754 (33.2) | 0.0006 | |||||||||||||||||||||||||||||||||||||||||||||||||||||||||||||||||||||||||||||||||||||||||||||
| Drinking, n (%) | 3,553 (39.0) | 867 (38.2) | 945 (41.4) | 921 (40.4) | 820 (36.1) | 0.0011 | |||||||||||||||||||||||||||||||||||||||||||||||||||||||||||||||||||||||||||||||||||||||||||||
| Medical history | |||||||||||||||||||||||||||||||||||||||||||||||||||||||||||||||||||||||||||||||||||||||||||||||||||
| Ischemic stroke, n (%) | 1,850 (20.3) | 424 (18.7) | 468 (20.5) | 479 (21.0) | 479 (21.1) | 0.1550 | |||||||||||||||||||||||||||||||||||||||||||||||||||||||||||||||||||||||||||||||||||||||||||||
| Coronary heart diseases, n (%) | 914 (10.0) | 244 (10.8) | 216 (9.5) | 215 (9.4) | 239 (10.5) | 0.3036 | |||||||||||||||||||||||||||||||||||||||||||||||||||||||||||||||||||||||||||||||||||||||||||||
| Atrial fibrillation, n (%) | 592 (6.5) | 166 (7.3) | 136 (6.0) | 140 (6.1) | 150 (6.6) | 0.2480 | |||||||||||||||||||||||||||||||||||||||||||||||||||||||||||||||||||||||||||||||||||||||||||||
| Hypertension, n (%) | 5,717 (62.8) | 1,346 (59.3) | 1,440 (63.0) | 1,444 (63.4) | 1,487 (65.4) | 0.0003 | |||||||||||||||||||||||||||||||||||||||||||||||||||||||||||||||||||||||||||||||||||||||||||||
| Diabetes mellitus, n (%) | 2,126 (23.3) | 559 (24.6) | 542 (23.7) | 559 (24.5) | 466 (20.5) | 0.0024 | |||||||||||||||||||||||||||||||||||||||||||||||||||||||||||||||||||||||||||||||||||||||||||||
| Hypercholesterolemia, n (%) | 696 (7.6) | 167 (7.4) | 191 (8.4) | 175 (7.7) | 163 (7.2) | 0.4492 | |||||||||||||||||||||||||||||||||||||||||||||||||||||||||||||||||||||||||||||||||||||||||||||
| Hours of event onset, median (IQR) | 10 (3–25) | 10 (3–26) | 11 (3–26) | 11 (3–26) | 8 (3–24) | <0.0001 | |||||||||||||||||||||||||||||||||||||||||||||||||||||||||||||||||||||||||||||||||||||||||||||
| NIHSS score at admission, median (IQR) | 3 (2–6) | 3 (1–5) | 3 (2–5) | 3 (2–6) | 4 (2–7) | <0.0001 | |||||||||||||||||||||||||||||||||||||||||||||||||||||||||||||||||||||||||||||||||||||||||||||
| mRS score before onset ≥3, n (%) | 370 (4.1) | 82 (3.6) | 84 (3.7) | 90 (4.0) | 114 (5.0) | 0.0603 | |||||||||||||||||||||||||||||||||||||||||||||||||||||||||||||||||||||||||||||||||||||||||||||
| Laboratory tests | |||||||||||||||||||||||||||||||||||||||||||||||||||||||||||||||||||||||||||||||||||||||||||||||||||
| WBC (109/L) | 7.24 ± 2.21 | 6.08 ± 1.60 | 6.70 ± 1.67 | 7.28 ± 1.75 | 8.90 ± 2.59 | <0.0001 | |||||||||||||||||||||||||||||||||||||||||||||||||||||||||||||||||||||||||||||||||||||||||||||
| FPG (mmol/L) | 6.46 ± 2.62 | 6.30 ± 2.47 | 6.41 ± 2.67 | 6.51 ± 2.58 | 6.63 ± 2.77 | <0.0001 | |||||||||||||||||||||||||||||||||||||||||||||||||||||||||||||||||||||||||||||||||||||||||||||
| LDL-C (mmol/L) | 2.56 ± 1.04 | 2.48 ± 0.99 | 2.52 ± 0.97 | 2.57 ± 1.06 | 2.68 ± 1.12 | <0.0001 | |||||||||||||||||||||||||||||||||||||||||||||||||||||||||||||||||||||||||||||||||||||||||||||
| Hcy (μmol/L) | 18.93 ± 12.26 | 18.36 ± 11.41 | 18.98 ± 12.94 | 18.78 ± 11.99 | 19.61 ± 12.62 | 0.0206 | |||||||||||||||||||||||||||||||||||||||||||||||||||||||||||||||||||||||||||||||||||||||||||||
| hs-CRP (mg/L) | 5.67 ± 18.22 | 3.41 ± 10.23 | 4.35 ± 12.82 | 5.23 ± 15.49 | 9.62 ± 28.11 | <0.0001 | |||||||||||||||||||||||||||||||||||||||||||||||||||||||||||||||||||||||||||||||||||||||||||||
| 90-day follow-up | |||||||||||||||||||||||||||||||||||||||||||||||||||||||||||||||||||||||||||||||||||||||||||||||||||
| Poor functional outcome, n (%) | 1,110 (12.2) | 178 (7.8) | 223 (9.8) | 292 (12.8) | 417 (18.3) | <0.0001 | |||||||||||||||||||||||||||||||||||||||||||||||||||||||||||||||||||||||||||||||||||||||||||||
| Recurrent stroke, n (%) | 534 (5.9) | 127 (5.6) | 98 (4.3) | 139 (6.1) | 170 (7.5) | <0.0001 | |||||||||||||||||||||||||||||||||||||||||||||||||||||||||||||||||||||||||||||||||||||||||||||
| All-cause death, n (%) | 85 (0.9) | 13 (0.6) | 14 (0.6) | 18 (0.8) | 40 (1.8) | <0.0001 | |||||||||||||||||||||||||||||||||||||||||||||||||||||||||||||||||||||||||||||||||||||||||||||
| 1-year follow-up | |||||||||||||||||||||||||||||||||||||||||||||||||||||||||||||||||||||||||||||||||||||||||||||||||||
| Poor functional outcome, n (%) | 1,027 (11.3) | 172 (7.6) | 203 (8.9) | 266 (11.7) | 386 (17.0) | <0.0001 | |||||||||||||||||||||||||||||||||||||||||||||||||||||||||||||||||||||||||||||||||||||||||||||
| Recurrent stroke, n (%) | 847 (9.3) | 198 (8.7) | 182 (8.0) | 206 (9.0) | 261 (11.5) | 0.0003 | |||||||||||||||||||||||||||||||||||||||||||||||||||||||||||||||||||||||||||||||||||||||||||||
| All-cause death, n (%) | 205 (2.3) | 34 (1.5) | 38 (1.7) | 45 (2.0) | 88 (3.9) | <0.0001 | |||||||||||||||||||||||||||||||||||||||||||||||||||||||||||||||||||||||||||||||||||||||||||||
| Abbreviations: SII: systemic immune-inflammation index; SD: standard deviation; IQR: interquartile range; NIHSS: National Institutes of Health Stroke Scale; Q: quartile; mRS: modified Rankin Scale; WBC: white blood cell; FPG: fasting plasma glucose; LDL-C: low-density lipoprotein cholesterol; Hcy: homocysteine; hs-CRP: high-sensitivity C-reactive protein. | |||||||||||||||||||||||||||||||||||||||||||||||||||||||||||||||||||||||||||||||||||||||||||||||||||
SII and functional outcome
Table 1 displays the data for patients with poor functional outcomes at the 90-day and 1-year follow-up. Overall, 1,110 (12.2%) and 1,027 (11.3%) patients had poor functional outcome at the 90-day and 1-year follow-up, respectively. With the increase in SII, whether follow-up at 90-day or 1-year, the number of patients with poor functional outcomes was increasing.
The relationship between SII and poor functional outcome of stroke, analyzed using logistic regression, is shown using a forest plot (Figure 1). At the 90-day follow-up, the crude odds ratios (ORs) of Q2, Q3, and Q4 compared with Q1 were 1.270 (95% confidence interval [CI], 1.034–1.561), 1.726 (95% CI, 1.419–2.101), and 2.638 (95% CI, 2.190–3.178), respectively. At the 1-year follow-up, the crude ORs were 1.189 (95% CI, 0.962–1.469), 1.611 (95% CI, 1.371–1.1970), and 2.493 (95% CI, 2.061–3.015) for Q2, Q3, and Q4, respectively. After adjusting for confounding factors, the ORs of Q2, Q3, and Q4 compared with Q1 were 1.312 (95% CI, 1.053–1.636), 1.604 (95% CI, 1.298–1.981), and 2.167 (95% CI, 1.767–2.657) at the 90-day follow-up, and at 1-year follow-up, they were 1.245 (95% CI, 0.994–1.558), 1.538 (95% CI, 1.240–1.907), and 2.127 (95% CI, 1.729–2.615), respectively. The trend test revealed statistical significance (P < 0.0001). In addition, we conducted a stratified analysis based on the patients’ age, sex, smoking status, and alcohol consumption to further understand the effects of SII on the functional prognosis in different populations (Table 2). However, a particular subpopulation was not identified (P ≥ 0.10 for all interactions).
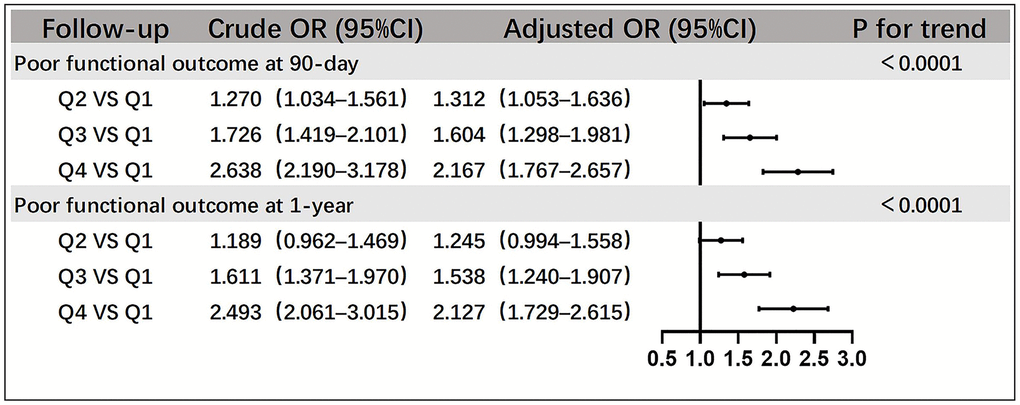
Figure 1. Relationships between SII quartiles and poor functional outcomes of patients with acute ischemic stroke at the 90-day and 1-year follow-up. Adjustment factors include sex, age, smoking status, alcohol consumption, history of cerebral infarction, hypertension, atrial fibrillation, coronary heart disease, diabetes mellitus, WBC, FPG, LDL-C, Hcy, hs-CRP, hours of event onset, NIHSS score at onset, and mRS score before onset ≥3. Abbreviations: WBC: white blood cell; FPG: fasting plasma glucose; LDL-C: low-density lipoprotein; Hcy: homocysteine; hs-CRP: high-sensitivity C-reactive protein.
Table 2. Stratified analysis of the relationship between SII quartiles and risk of poor functional outcome.
| Q1 | Q2 | Q3 | Q4 | P for trend | P for interaction | ||||||||||||||||||||||||||||||||||||||||||||||||||||||||||||||||||||||||||||||||||||||||||||||
| Poor functional outcome at 90-day follow-up | |||||||||||||||||||||||||||||||||||||||||||||||||||||||||||||||||||||||||||||||||||||||||||||||||||
| Age | <50 years, adjusted OR (95% Cl) | 1 (ref) | 1.930 (0.800–4.655) | 1.950 (0.830–4.591) | 2.650 (1.135–6.189) | 0.0319 | 0.7111 | ||||||||||||||||||||||||||||||||||||||||||||||||||||||||||||||||||||||||||||||||||||||||||||
| ≥50 years, adjusted OR (95% Cl) | 1 (ref) | 1.235 (0.984–1.550) | 1.542 (1.240–1.918) | 2.104 (1.706–2.594) | <0.0001 | ||||||||||||||||||||||||||||||||||||||||||||||||||||||||||||||||||||||||||||||||||||||||||||||
| Sex | Male, adjusted OR (95% Cl) | 1 (ref) | 1.266 (0.961–1.668) | 1.583 (1.213–2.064) | 2.113 (1.633–2.735) | <0.0001 | 0.9856 | ||||||||||||||||||||||||||||||||||||||||||||||||||||||||||||||||||||||||||||||||||||||||||||
| Female, adjusted OR (95% Cl) | 1 (ref) | 1.406 (0.972–2.034) | 1.638 (1.154–2.324) | 2.231 (1.597–3.118) | <0.0001 | ||||||||||||||||||||||||||||||||||||||||||||||||||||||||||||||||||||||||||||||||||||||||||||||
| Smoking | Smoking, adjusted OR (95% Cl) | 1 (ref) | 1.691 (1.125–2.543) | 2.246 (1.511–3.339) | 2.326 (1.563–3.463) | <0.0001 | 0.1084 | ||||||||||||||||||||||||||||||||||||||||||||||||||||||||||||||||||||||||||||||||||||||||||||
| Does not smoke, adjusted OR (95% Cl) | 1 (ref) | 1.186 (0.910–1.545) | 1.395 (1.084–1.795) | 2.127 (1.675–2.701) | <0.0001 | ||||||||||||||||||||||||||||||||||||||||||||||||||||||||||||||||||||||||||||||||||||||||||||||
| Drinking | Drinking, adjusted OR (95% Cl) | 1 (ref) | 1.149 (0.783–1.687) | 1.846 (1.286–2.649) | 2.307 (1.614–3.299) | <0.0001 | 0.1625 | ||||||||||||||||||||||||||||||||||||||||||||||||||||||||||||||||||||||||||||||||||||||||||||
| Does not drink, adjusted OR (95% Cl) | 1 (ref) | 1.410 (1.076–1.848) | 1.484 (1.142–1.928) | 2.102 (1.639–2.697) | <0.0001 | ||||||||||||||||||||||||||||||||||||||||||||||||||||||||||||||||||||||||||||||||||||||||||||||
| Poor functional outcome at 1-year follow-up | |||||||||||||||||||||||||||||||||||||||||||||||||||||||||||||||||||||||||||||||||||||||||||||||||||
| Age | <50 years, adjusted OR (95% Cl) | 1 (ref) | 1.233 (0.461–3.300) | 1.369 (0.544–3.442) | 2.585 (1.062–6.292) | 0.0150 | 0.7742 | ||||||||||||||||||||||||||||||||||||||||||||||||||||||||||||||||||||||||||||||||||||||||||||
| ≥50 years, adjusted OR (95% Cl) | 1 (ref) | 1.199 (0.953–1.507) | 1.495 (1.200–1.862) | 2.009 (1.627–2.480) | <0.0001 | ||||||||||||||||||||||||||||||||||||||||||||||||||||||||||||||||||||||||||||||||||||||||||||||
| Sex | Male, adjusted OR (95% Cl) | 1 (ref) | 1.165 (0.889–1.528) | 1.347 (1.034–1.754) | 1.929 (1.497–2.485) | <0.0001 | 0.5150 | ||||||||||||||||||||||||||||||||||||||||||||||||||||||||||||||||||||||||||||||||||||||||||||
| Female, adjusted OR (95% Cl) | 1 (ref) | 1.390 (0.926–2.086) | 1.986 (1.364–2.890) | 2.522 (1.756–3.624) | <0.0001 | ||||||||||||||||||||||||||||||||||||||||||||||||||||||||||||||||||||||||||||||||||||||||||||||
| Smoking | Smoking, adjusted OR (95% Cl) | 1 (ref) | 1.214 (0.811–1.816) | 1.698 (1.152–2.502) | 1.771 (1.198–2.617) | 0.0010 | 0.2195 | ||||||||||||||||||||||||||||||||||||||||||||||||||||||||||||||||||||||||||||||||||||||||||||
| Does not smoke, adjusted OR (95% Cl) | 1 (ref) | 1.242 (0.946–1.630) | 1.455 (1.123–1.886) | 2.271 (1.778–2.901) | <0.0001 | ||||||||||||||||||||||||||||||||||||||||||||||||||||||||||||||||||||||||||||||||||||||||||||||
| Drinking | Drinking, adjusted OR (95% Cl) | 1 (ref) | 1.050 (0.708–1.557) | 1.593 (1.097–2.312) | 1.935 (1.338–2.798) | <0.0001 | 0.4963 | ||||||||||||||||||||||||||||||||||||||||||||||||||||||||||||||||||||||||||||||||||||||||||||
| Does not drink, adjusted OR (95% Cl) | 1 (ref) | 1.351 (1.026–1.778) | 1.511 (1.160–1.968) | 2.225 (1.731–2.859) | <0.0001 | ||||||||||||||||||||||||||||||||||||||||||||||||||||||||||||||||||||||||||||||||||||||||||||||
| Adjustment factors include sex, age, smoking status, alcohol consumption, history of cerebral infarction, hypertension, atrial fibrillation, coronary heart disease, diabetes mellitus, WBC, FPG, LDL-C, Hcy, hs-CRP, hours of event onset, NIHSS score at onset, and mRS score before onset ≥3. Abbreviations: CI: confidence interval; Q: quartile; OR: odds ratio; mRS: modified Rankin Scale; NIHSS: National Institutes of Health Stroke Scale; SII: systemic immune-inflammation index; WBC: white blood cell; FPG: fasting plasma glucose; LDL-C: low-density lipoprotein cholesterol; Hcy: homocysteine; hs-CRP: high-sensitivity C-reactive protein. | |||||||||||||||||||||||||||||||||||||||||||||||||||||||||||||||||||||||||||||||||||||||||||||||||||
SII and secondary outcomes
During the 90-day and 1-year follow-up, the cumulative incidence rates of the secondary outcomes in different SII quartiles were represented with Kaplan–Meier curves (Figure 2). When the SII was high, the cumulative incidence of all-cause death and recurrent stroke during follow-up (log-rank test P < 0.01 for all outcomes) was also high.
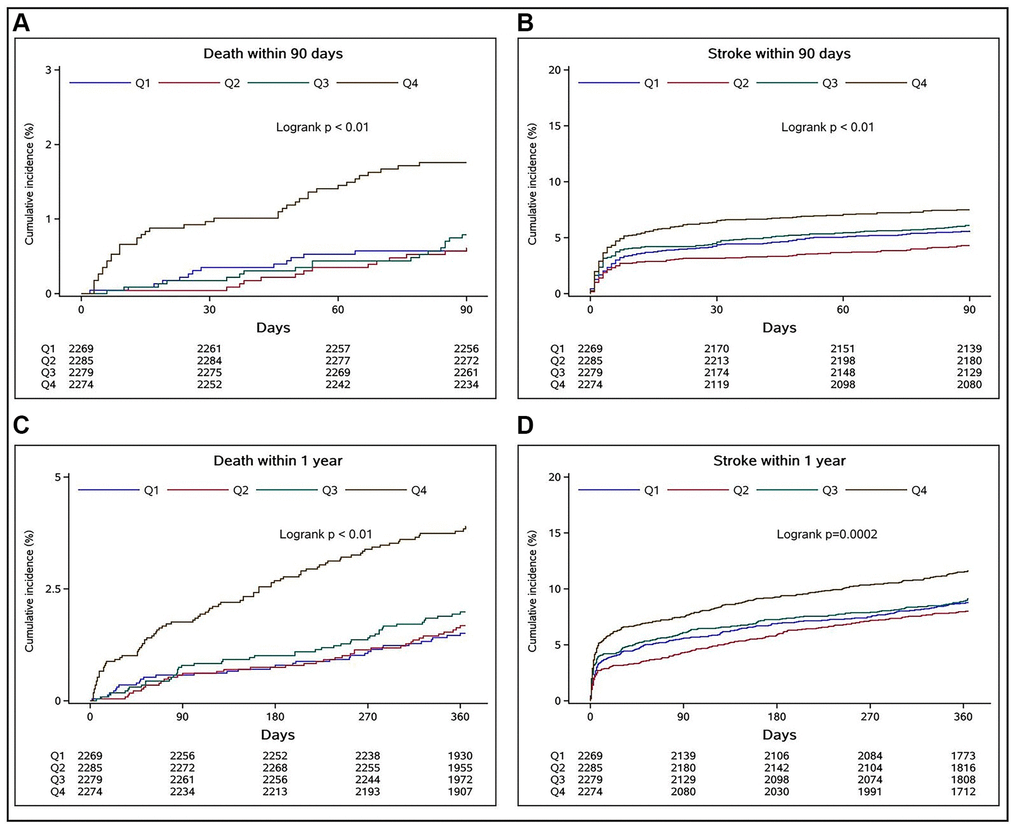
Figure 2. Relationships between SII quartiles and cumulative incidence rates of all-cause deaths and recurrent strokes in stroke patients at 90-day and 1-year follow-up assessments. (A and B) indicate the relationships of the SII quartiles with the cumulative incidence rates of all-cause death and recurrent stroke at the 90-day follow-up, respectively, whereas (C and D) show the respective outcomes at the 1-year follow-up.
Table 3 shows the data of secondary outcomes during the 90-day and 1-year follow-up, as well as the results of the Cox regression analysis between SII quartiles and secondary outcomes. Compared to Q1 of the SII, Q4 was associated with an increased risk of all-cause death (adjusted hazard ratio [HR], 2.409; 95% CI, 1.273–4.559) and recurrent stroke (adjusted HR, 1.279; 95% CI, 1.012–1.617) at the 90-day follow-up (all P < 0.05). Similarly, Q4 of the SII was associated with an increased risk of all-cause death (adjusted HR, 2.209; 95% CI, 1.474–3.311) and recurrent stroke (adjusted HR, 1.272; 95% CI, 1.054–1.536) at the 1-year follow-up (all P < 0.05).
Table 3. Multivariate Cox regression analysis of the relationships between SII and clinical outcomes of patients with acute ischemic stroke.
| Outcomes | Groups | Events, n (%) | Crude HR (95% CI) | P value | Adjusted HR (95% CI) | P value | |||||||||||||||||||||||||||||||||||||||||||||||||||||||||||||||||||||||||||||||||||||||||||||
| 90-day follow-up | |||||||||||||||||||||||||||||||||||||||||||||||||||||||||||||||||||||||||||||||||||||||||||||||||||
| Recurrent stroke 534 (5.9%) | Q1 | 127 (5.6) | 1 (ref) | 1 (ref) | |||||||||||||||||||||||||||||||||||||||||||||||||||||||||||||||||||||||||||||||||||||||||||||||
| Q2 | 98 (4.3) | 0.762 (0.585–0.991) | 0.0430 | 0.768 (0.590–1.001) | 0.0505 | ||||||||||||||||||||||||||||||||||||||||||||||||||||||||||||||||||||||||||||||||||||||||||||||
| Q3 | 139 (6.1) | 1.094 (0.860–1.392) | 0.4624 | 1.081 (0.849–1.376) | 0.5291 | ||||||||||||||||||||||||||||||||||||||||||||||||||||||||||||||||||||||||||||||||||||||||||||||
| Q4 | 170 (7.5) | 1.355 (1.077–1.705) | 0.0096 | 1.279 (1.012–1.617) | 0.0397 | ||||||||||||||||||||||||||||||||||||||||||||||||||||||||||||||||||||||||||||||||||||||||||||||
| All-cause death 85 (0.9%) | Q1 | 13 (0.6) | 1 (ref) | 1 (ref) | |||||||||||||||||||||||||||||||||||||||||||||||||||||||||||||||||||||||||||||||||||||||||||||||
| Q2 | 14 (0.6) | 1.068 (0.502–2.272) | 0.8644 | 1.175 (0.550–2.512) | 0.6772 | ||||||||||||||||||||||||||||||||||||||||||||||||||||||||||||||||||||||||||||||||||||||||||||||
| Q3 | 18 (0.8) | 1.378 (0.675–2.812) | 0.3788 | 1.366 (0.667–2.797) | 0.3938 | ||||||||||||||||||||||||||||||||||||||||||||||||||||||||||||||||||||||||||||||||||||||||||||||
| Q4 | 40 (1.8) | 3.092 (1.654–5.781) | 0.0004 | 2.409 (1.273–4.559) | 0.0069 | ||||||||||||||||||||||||||||||||||||||||||||||||||||||||||||||||||||||||||||||||||||||||||||||
| 1-year follow-up | |||||||||||||||||||||||||||||||||||||||||||||||||||||||||||||||||||||||||||||||||||||||||||||||||||
| Recurrent stroke 847 (9.3%) | Q1 | 198 (8.7) | 1 (ref) | 1 (ref) | |||||||||||||||||||||||||||||||||||||||||||||||||||||||||||||||||||||||||||||||||||||||||||||||
| Q2 | 182 (8.0) | 0.907 (0.741–1.109) | 0.3401 | 0.909 (0.743–1.112) | 0.3549 | ||||||||||||||||||||||||||||||||||||||||||||||||||||||||||||||||||||||||||||||||||||||||||||||
| Q3 | 206 (9.0) | 1.042 (0.857–1.266) | 0.6819 | 1.023 (0.841–1.244) | 0.8210 | ||||||||||||||||||||||||||||||||||||||||||||||||||||||||||||||||||||||||||||||||||||||||||||||
| Q4 | 261 (11.5) | 1.348 (1.121–1.621) | 0.0015 | 1.272 (1.054–1.536) | 0.0122 | ||||||||||||||||||||||||||||||||||||||||||||||||||||||||||||||||||||||||||||||||||||||||||||||
| All-cause death 205 (2.3%) | Q1 | 34 (1.5) | 1 (ref) | 1 (ref) | |||||||||||||||||||||||||||||||||||||||||||||||||||||||||||||||||||||||||||||||||||||||||||||||
| Q2 | 38 (1.7) | 1.109 (0.698–1.762) | 0.6608 | 1.185 (0.745–1.885) | 0.4747 | ||||||||||||||||||||||||||||||||||||||||||||||||||||||||||||||||||||||||||||||||||||||||||||||
| Q3 | 45 (2.0) | 1.318 (0.844–2.058) | 0.2242 | 1.286 (0.822–2.011) | 0.2707 | ||||||||||||||||||||||||||||||||||||||||||||||||||||||||||||||||||||||||||||||||||||||||||||||
| Q4 | 88 (3.9) | 2.621 (1.764–3.893) | <0.0001 | 2.209 (1.474–3.311) | 0.0001 | ||||||||||||||||||||||||||||||||||||||||||||||||||||||||||||||||||||||||||||||||||||||||||||||
| Adjustment factors include sex, age, smoking status, alcohol consumption, history of cerebral infarction, hypertension, atrial fibrillation, coronary heart disease, diabetes mellitus, WBC, FPG, LDL-C, Hcy, hs-CRP, hours of event onset, NIHSS score at onset, and mRS score before onset ≥3. Abbreviations: CI: confidence interval; Q: quartile; HR: hazard ratio; mRS: modified Rankin Scale; NIHSS: National Institutes of Health Stroke Scale; SII: systemic immune-inflammation index; WBC: white blood cell; FPG: fasting plasma glucose; LDL-C: low-density lipoprotein cholesterol; Hcy: homocysteine; hs-CRP: high-sensitivity C-reactive protein. | |||||||||||||||||||||||||||||||||||||||||||||||||||||||||||||||||||||||||||||||||||||||||||||||||||
Discussion
As the SII quartile increased, patients with acute ischemic stroke were more likely to have poor functional outcomes during the follow-up. The proportion of poor functional outcomes at 1-year follow-up was slightly lower than that at 90-day follow-up, suggesting that some patients were still recovering during this period, but the recovery was slow, and the proportion was low. To determine whether there were specific subpopulations whose characteristics were affected by inflammation, a stratified analysis was performed. Although age, smoking status, and alcohol consumption are risk factors [9–11] and female estrogen is a protective factor for stroke [12], we did not identify subgroups specifically being affected by these factors, indicating that the SII is relatively independent and stable (Table 2, P ≥ 0.10 for all interactions). Figure 2 shows that patients in the Q4 group had the highest cumulative incidence of all-cause death and recurrent stroke during the follow-up period (log-rank test P < 0.01 for all outcomes). Finally, the Cox regression analysis showed that Q4 of the SII at admission was an independent risk factor for all-cause death and recurrent stroke in patients with acute ischemic stroke during the 90-day and 1-year follow-up periods. Even if we adjusted our model for factors identified by previous studies as immune-inflammation markers that might affect prognosis, such as the high-sensitivity C-reactive protein level, our results still suggested that SII is closely related to short- and long-term prognosis of patients with acute ischemic stroke.
Previous studies have shown that the immune and inflammatory response after stroke is an important factor that affects patient prognosis [13, 14]. Neutrophils and lymphocytes are involved in the inflammatory and immune response, whereas platelets have a primary role in the thrombo-inflammation of stroke. As a new type of immune-inflammation index, the SII integrates neutrophils, platelets, and lymphocytes and can reflect the balance of the systemic immune response and inflammatory response [5]. Studies have also shown that neutrophils, which are the primary cells of the inflammatory response, are recruited in large numbers to participate in the immune-inflammatory response of post-stroke lesions [15, 16]. The massive production of platelets after a stroke is also involved in the pathological processes of infarct lesions [17]. The interaction between neutrophils and platelets exacerbates the destruction created by infarcts [18], causing a series of pathological reactions, such as the production of oxygen free radicals, exudation, and extracellular traps, which can induce thrombosis [19] and result in further damage to the ischemic brain tissue [7]. In a recent review by Langer et al., it was concluded that platelets mediate the immune-inflammatory response along with a variety of cells and can cause injury both inside and outside blood vessels, as well as to neurons [20]. These effects show that platelets are vital contributors to thrombotic inflammation and play a very important role in the immune-inflammatory response after stroke. Previous studies have shown that immunosuppression and decreased levels of lymphocytes after a stroke lead to a worse prognosis [21–23]. This explains how, in accordance with cellular-level pathophysiology, the SII can quite accurately reflect the systemic immune-inflammatory state and predict the prognosis of patients with stroke.
The SII can reveal the state of systemic immune-inflammatory response in patients with stroke and predict the development and prognosis of stroke. The primary advantage of this indicator is that it can be easily calculated from the results of routine blood tests that are mandatory upon hospital admission for every patient. To a certain extent, this research can provide evidence and guidance for clinicians in the treatment of stroke and prediction of its prognosis. The earlier high-risk patients are identified, the better the attention and care that will be given. This will improve the prognosis of patients with stroke and can minimize the burden of the disease on patients, their families, and the entire society. The main advantages of this study include its large sample size, multicenter nature, prospective demographics, and clinical follow-up data.
This study has some limitations. First, the study excluded patients with missing SII values and missing follow-up outcomes, which may have created a selection bias to some extent. Second, dynamic changes in the immune-inflammatory state were not considered in our data collection or analysis despite studies that have shown that the immune-inflammatory response state changes over time [24–26]. However, we strictly controlled the schedule of admission time and blood collection of patients and kept it as consistent as possible. Lastly, the study did not compare other indices, such as the neutrophil/lymphocyte ratio and platelet/lymphocyte ratio. However, the study can still provide good support and reference for clinical and basic research.
In conclusion, our research shows that patients with higher SIIs after an acute ischemic stroke were more likely to have poor functional outcomes at the 90-day and 1-year follow-ups. Furthermore, patients with higher SIIs were more likely to experience all-cause death and recurrent stroke.
Materials and Methods
Study population
Data were derived from the CNSR-III. The CNSR-III is a nationwide, multicenter, prospective registry of patients with ischemic stroke and transient ischemic attack in China. The database includes complete imaging and biomarker data [27]. The study included patients in the CNSR-III with ischemic stroke who were admitted to a hospital within 72 h of onset but excluded the following: 1) patients with cancer and peripheral thrombosis; 2) patients with active infections or those who took antibiotics or immunosuppressive agents 2 weeks before admission and during hospitalization; and 3) patients with missing SII and follow-up data (shown in Supplementary Figure 1).
Data collection
The patients’ baseline data included their age, sex, smoking status, alcohol consumption, medical history, time from stroke onset to admission, NIHSS score at admission, and laboratory data. All the above data were collected by trained research coordinators following a standard data collection protocol. The coordinators identified the eligible patients, obtained informed consent, enrolled consecutive patients, and collected data through face-to-face interviews with the patients. Fasting venous blood was withdrawn from all patients within 24 h after admission, and an automatic routine blood analysis was performed. We calculated the SII for each patient based on the results of the routine blood analysis using the formula: neutrophils × platelets/lymphocytes.
Outcome assessment
According to the CNSR-III research protocol, researchers conducted face-to-face 90-day and 1-year follow-ups of patients. At the follow-up, the mRS score was used to assess the functional outcomes of the patients. The primary outcome was poor functional outcome, defined as 3≤mRS score≤6, where 6 points indicated death. The secondary outcome was the incidence of all-cause death and recurrent stroke.
Statistical analysis
Categorical variables were described as percentages and continuous variables as either means and standard deviations or medians and interquartile ranges. According to the quartile of the SII value, the eligible study participants were divided into four groups and compared using the χ2 test for categorical variables. The Kruskal–Wallis test was used to compare continuous variables. Logistic regression was used to analyze the relationships between the SII quartile groups and poor functional outcome at the follow-up points, with SII Q1 as the reference group. In addition, we conducted stratified analyses by trend and interaction tests. The cumulative incidence of adverse events was described using the Kaplan–Meier curves and compared using the log-rank test. The Cox regression analysis was used to explore the HR between the SII quartiles and adverse events at different follow-up points. The selection of adjustment variables in the adjustment model of logistic regression analysis and Cox regression analysis was derived from the variables with significant differences in univariate analysis or variables considered to be clinically significant. A two-tailed P value < 0.05 was considered statistically significant. All statistical analyses were completed using the SAS software (version 9.4; SAS Institute, Inc., Cary, NC, USA).
Data availability statement
Part of the data in this article is provided in the supplementary material. Other anonymized data not published within this article will be made available to any qualified investigator by request from the corresponding author.
Abbreviations
CI: confidence interval; CNSR-III: China National Stroke Registry III; HR: hazard ratio; IQR: interquartile range; mRS: modified Rankin Scale; NIHSS: National Institutes of Health Stroke Scale; OR: odds ratio; Q: quartile; SII: systemic immune-inflammation index.
Author Contributions
YiW had full access to all the data in the study and takes responsibility for the integrity of the data and the accuracy of the data analysis. NW contributed to this work as first author. Concept and design: NW, YY, BQ, YG, BS, YiW. Acquisition, analysis, or interpretation of data: NW, QX, AW, YX, YoW, BS, YiW. Drafting of the manuscript: NW. Critical revision of the manuscript for important intellectual content: YY, BS, YiW. Statistical analysis: NW, QX, AW. Obtained funding: YiW, YoW. Administrative, technical, or material support: YX, YoW, XM, BS, YiW.
Acknowledgments
We are grateful to all the sub-centers participating in the China National Stroke Registry III (CNSR-III), as well as to the doctors, nurses, and the related personnel who have done the corresponding work.
Conflicts of Interest
The authors declare no conflicts of interest related to this study.
Ethical Statement and Consent
The Ethics Committee of Beijing Tiantan Hospital (IRB approval number: KY2015-001-01) and those of all study centers provided ethical approval for the CNSR-III study protocol from which data for this study were acquired. All patients or their legal representatives provided written informed consent before being enrolled in the CNSR-III study.
Funding
This study was supported by the National Natural Science Foundation of China (No. 81870905); the National Natural Science Foundation of China (No. 81825007); the Beijing Outstanding Young Scientist Program (No. BJJWZYJH01201910025030); the “Thirteenth-Five” Key Development and Research Plan by the Ministry of Science and Technology of the People’s Republic of China (No. 2017YFC1307900); the Beijing Talent Project - Class A: Innovation and Development (No. 2018A12); the “National Ten-Thousand Talent Plan”- Leadership of Scientific and Technological Innovation; the Youth Beijing Scholar Program; and the National Key R&D Program of China (2018YFC1312400, 2018YFC1312402).
References
- 1. Wang YJ, Li ZX, Gu HQ, Zhai Y, Jiang Y, Zhao XQ, Wang YL, Yang X, Wang CJ, Meng X, Li H, Liu LP, Jing J, et al, and China Stroke Statistics 2019 Writing Committee. China Stroke Statistics 2019: A Report From the National Center for Healthcare Quality Management in Neurological Diseases, China National Clinical Research Center for Neurological Diseases, the Chinese Stroke Association, National Center for Chronic and Non-communicable Disease Control and Prevention, Chinese Center for Disease Control and Prevention and Institute for Global Neuroscience and Stroke Collaborations. Stroke Vasc Neurol. 2020; 5:211–39. https://doi.org/10.1136/svn-2020-000457 [PubMed]
- 2. Anrather J, Iadecola C. Inflammation and Stroke: An Overview. Neurotherapeutics. 2016; 13:661–70. https://doi.org/10.1007/s13311-016-0483-x [PubMed]
- 3. Zrzavy T, Machado-Santos J, Christine S, Baumgartner C, Weiner HL, Butovsky O, Lassmann H. Dominant role of microglial and macrophage innate immune responses in human ischemic infarcts. Brain Pathol. 2018; 28:791–805. https://doi.org/10.1111/bpa.12583 [PubMed]
- 4. Nieswandt B, Kleinschnitz C, Stoll G. Ischaemic stroke: a thrombo-inflammatory disease? J Physiol. 2011; 589:4115–23. https://doi.org/10.1113/jphysiol.2011.212886 [PubMed]
- 5. Hu B, Yang XR, Xu Y, Sun YF, Sun C, Guo W, Zhang X, Wang WM, Qiu SJ, Zhou J, Fan J. Systemic immune-inflammation index predicts prognosis of patients after curative resection for hepatocellular carcinoma. Clin Cancer Res. 2014; 20:6212–22. https://doi.org/10.1158/1078-0432.CCR-14-0442 [PubMed]
- 6. Wang BL, Tian L, Gao XH, Ma XL, Wu J, Zhang CY, Zhou Y, Guo W, Yang XR. Dynamic change of the systemic immune inflammation index predicts the prognosis of patients with hepatocellular carcinoma after curative resection. Clin Chem Lab Med. 2016; 54:1963–9. https://doi.org/10.1515/cclm-2015-1191 [PubMed]
- 7. Lisman T. Platelet-neutrophil interactions as drivers of inflammatory and thrombotic disease. Cell Tissue Res. 2018; 371:567–76. https://doi.org/10.1007/s00441-017-2727-4 [PubMed]
- 8. Hou D, Wang C, Luo Y, Ye X, Han X, Feng Y, Zhong P, Wu D. Systemic immune-inflammation index (SII) but not platelet-albumin-bilirubin (PALBI) grade is associated with severity of acute ischemic stroke (AIS). Int J Neurosci. 2021; 131:1203–8. https://doi.org/10.1080/00207454.2020.1784166 [PubMed]
- 9. Zha A, Vahidy F, Randhawa J, Parsha K, Bui T, Aronowski J, Savitz SI. Association Between Splenic Contraction and the Systemic Inflammatory Response After Acute Ischemic Stroke Varies with Age and Race. Transl Stroke Res. 2018; 9:484–92. https://doi.org/10.1007/s12975-017-0596-5 [PubMed]
- 10. Sandu RE, Dumbrava D, Surugiu R, Glavan DG, Gresita A, Petcu EB. Cellular and Molecular Mechanisms Underlying Non-Pharmaceutical Ischemic Stroke Therapy in Aged Subjects. Int J Mol Sci. 2017; 19:99. https://doi.org/10.3390/ijms19010099 [PubMed]
- 11. Ahnstedt H, McCullough LD. The impact of sex and age on T cell immunity and ischemic stroke outcomes. Cell Immunol. 2019; 345:103960. https://doi.org/10.1016/j.cellimm.2019.103960 [PubMed]
- 12. Wise PM, Dubal DB, Wilson ME, Rau SW, Böttner M, Rosewell KL. Estradiol is a protective factor in the adult and aging brain: understanding of mechanisms derived from in vivo and in vitro studies. Brain Res Brain Res Rev. 2001; 37:313–9. https://doi.org/10.1016/s0165-0173(01)00136-9 [PubMed]
- 13. Chamorro Á, Meisel A, Planas AM, Urra X, van de Beek D, Veltkamp R. The immunology of acute stroke. Nat Rev Neurol. 2012; 8:401–10. https://doi.org/10.1038/nrneurol.2012.98 [PubMed]
- 14. Shi K, Tian DC, Li ZG, Ducruet AF, Lawton MT, Shi FD. Global brain inflammation in stroke. Lancet Neurol. 2019; 18:1058–66. https://doi.org/10.1016/S1474-4422(19)30078-X [PubMed]
- 15. Drieu A, Buendia I, Levard D, Hélie P, Brodin C, Vivien D, Rubio M. Immune Responses and Anti-inflammatory Strategies in a Clinically Relevant Model of Thromboembolic Ischemic Stroke with Reperfusion. Transl Stroke Res. 2020; 11:481–95. https://doi.org/10.1007/s12975-019-00733-8 [PubMed]
- 16. Strecker JK, Schmidt A, Schäbitz WR, Minnerup J. Neutrophil granulocytes in cerebral ischemia - Evolution from killers to key players. Neurochem Int. 2017; 107:117–26. https://doi.org/10.1016/j.neuint.2016.11.006 [PubMed]
- 17. Stoll G, Nieswandt B. Thrombo-inflammation in acute ischaemic stroke - implications for treatment. Nat Rev Neurol. 2019; 15:473–81. https://doi.org/10.1038/s41582-019-0221-1 [PubMed]
- 18. Rayasam A, Hsu M, Kijak JA, Kissel L, Hernandez G, Sandor M, Fabry Z. Immune responses in stroke: how the immune system contributes to damage and healing after stroke and how this knowledge could be translated to better cures? Immunology. 2018; 154:363–76. https://doi.org/10.1111/imm.12918 [PubMed]
- 19. Zhang S, Guo M, Liu Q, Liu J, Cui Y. Neutrophil extracellular traps induce thrombogenicity in severe carotid stenosis. Immun Inflamm Dis. 2021; 9:1025–36. https://doi.org/10.1002/iid3.466 [PubMed]
- 20. Rawish E, Nording H, Münte T, Langer HF. Platelets as Mediators of Neuroinflammation and Thrombosis. Front Immunol. 2020; 11:548631. https://doi.org/10.3389/fimmu.2020.548631 [PubMed]
- 21. Famakin BM. The Immune Response to Acute Focal Cerebral Ischemia and Associated Post-stroke Immunodepression: A Focused Review. Aging Dis. 2014; 5:307–26. https://doi.org/10.14336/AD.2014.0500307 [PubMed]
- 22. Lunardi Baccetto S, Lehmann C. Microcirculatory Changes in Experimental Models of Stroke and CNS-Injury Induced Immunodepression. Int J Mol Sci. 2019; 20:5184. https://doi.org/10.3390/ijms20205184 [PubMed]
- 23. Kim J, Song TJ, Park JH, Lee HS, Nam CM, Nam HS, Kim YD, Heo JH. Different prognostic value of white blood cell subtypes in patients with acute cerebral infarction. Atherosclerosis. 2012; 222:464–7. https://doi.org/10.1016/j.atherosclerosis.2012.02.042 [PubMed]
- 24. Petrone AB, Eisenman RD, Steele KN, Mosmiller LT, Urhie O, Zdilla MJ. Temporal dynamics of peripheral neutrophil and lymphocytes following acute ischemic stroke. Neurol Sci. 2019; 40:1877–85. https://doi.org/10.1007/s10072-019-03919-y [PubMed]
- 25. Gelderblom M, Leypoldt F, Steinbach K, Behrens D, Choe CU, Siler DA, Arumugam TV, Orthey E, Gerloff C, Tolosa E, Magnus T. Temporal and spatial dynamics of cerebral immune cell accumulation in stroke. Stroke. 2009; 40:1849–57. https://doi.org/10.1161/STROKEAHA.108.534503 [PubMed]
- 26. Kömürcü HF, Gözke E, Doğan Ak P, Kalyoncu Aslan I, Salt I, Özgenç Bi Er Çİ. Changes in neutrophil, lymphocyte, platelet ratios and their relationship with NIHSS after rtPA and/or thrombectomy in ischemic stroke. J Stroke Cerebrovasc Dis. 2020; 29:105004. https://doi.org/10.1016/j.jstrokecerebrovasdis.2020.105004 [PubMed]
- 27. Wang Y, Jing J, Meng X, Pan Y, Wang Y, Zhao X, Lin J, Li W, Jiang Y, Li Z, Zhang X, Yang X, Ji R, et al. The Third China National Stroke Registry (CNSR-III) for patients with acute ischaemic stroke or transient ischaemic attack: design, rationale and baseline patient characteristics. Stroke Vasc Neurol. 2019; 4:158–64. https://doi.org/10.1136/svn-2019-000242 [PubMed]