


Introduction
Laryngeal squamous cell carcinoma (LSCC), a frequent and invasive malignancy of head and neck squamous cell carcinoma (HNSCC), is the eighth largest cause of cancer-associated death in the world [1]. The morbidity of LSCC is higher in men than in women and the leading pathogenic risk factors includes smoking and alcohol drinking [2]. As the proportion of people over 70 years of age rises in the past twenty years, the incidence of LSCC is growing globally and the burden may continue to ascend in the future [3, 4]. Conventional management approaches to laryngeal cancer include radical surgery, radiation therapy, and chemotherapy. However, to date, there is still a poor prognosis for laryngeal cancer.
RNA-binding proteins (RBPs) [5] participate in many biological activities, such as the modulation of pre–messenger RNA (mRNA) splicing and RNA modification, translation, stability, and localization [6]. RBPs identify targets and regulate co-transcriptional RNA, post-transcriptional processes by RNA-binding domains [7]. Thus far, some RBPs have been identified in human cell lines and tumors through genome-wide analysis [8]. Statistically, approximately half of these RBPs can be grouped according to their mRNA targets, while others can interact with different RNA types. Moreover, about one third of the RBPs can combine with DNA and RNA [9]. The abnormal expression of RBPs has been detected in multiple human tumor types, and different RBPs can control different processes in RNA metabolism of the target genes [10]. For example, RNA-binding motif protein 47 (RBM47) can suppress progression and metastasis in breast cancer cells [11].
RBPs are known to be linked to the development, and metastasis of urothelial carcinoma of bladder [12]. MSI1, a RBP of the Musashi family, is associated with oral squamous cell carcinoma [13], gastric carcinoma [14], and carcinoma of the lungs [15]. However, the prognostic value of RBPs for laryngeal cancer is rarely reported so far. In our study, we intended to establish and verify a novel prognostic signature in view of RBPs expression profile for LSCC patients by integrating different independent cohorts.
Materials and Methods
Detection of DERBPs
Transcript data were obtained from TCGA (https://portal.gdc.cancer.gov), which containing 111 LSCC samples and 12 paired samples. In Supplementary Table 1, detailed clinical information is presented. The RNA-seq data were processed by using “limma” package of the R software. | log (FC) | ≥ 0.5 and an adjusted p-value < .05 were defined as the screening criteria for detecting DERBPs between healthy laryngeal tissues and LSCC tissues from TCGA.
Pathway enrichment analysis
To identify the predominant biological processes of the DERBPs, gene ontology (GO) [16] and Kyoto encyclopedia of Genes and Genomes (KEGG) pathway analysis [17] were performed. An adjusted p-value < .05 was considered as a screening criterion.
PPI network establishment
To screen hub genes that were tightly linked to each other, DERBPs were introduced into the String database (https://string-db.org/) and Cytoscape software (version: 3.7.1). The plug-in unit “MODE” was used for sub-network construction. We then performed pathway enrichment and visualized the sub-networks.
GEO cohorts
To increase the reliability of the prognostic signature, we integrated GSE27020 dataset (109 patients) from GEO database for DFS analysis. Thirty-four recurrent and seventy-five non-recurrent LSCC patients were collected as external cohorts for further validation. GSE27020 dataset was derived from the GPL96 platform (Affymetrix Human Genome U133A Array). Moreover, GSE65858 dataset including 270 HNSCC patients was further screened out and selected for validation of OS, which was derived from GPL10558 platform.
Identification and validation of the transcriptomic signature
To develop a RBPs-related prognostic signature with good predictive performance, 111 LSCC patients were randomly assigned to training (56 patients) and test cohort (55 patients). The univariate Cox regression analysis was served to select the prognostic DERBPs in training cohort, and LASSO analysis method was performed to avoid overfitting. Multivariate Cox regression analysis was applied to determine the prognostic signature. The DERBPs with a p-value < .05 were considered as hub prognosis-related DERBPs. The calculation formula of the risk score based on training cohort was described below:
Risk score = coef A * A Expression + coef B * B Expression + coef i * i Expression [18–20]
On the basis of the median risk score, all samples were sorted into either the low- or high-risk group in training cohort. We compared the overall survival rate of the two groups by Kaplan-Meier methods, and evaluated the transcriptomic signature by plotting the receiver operating characteristic (ROC) curves for training, test, entire, GSE65858 and GSE27020 cohort.
Immune infiltration and drug sensitivity analysis
In this study, cell-type identification by estimating relative subsets of RNA transcripts (CIBERSORT) algorithm [21] and single sample gene set enrichment analysis (ssGSEA) algorithm [22] were carried out on LSCC patients of TCGA cohort. The Wilcoxon test was applied to compare the immune cell infiltration of LSCC patients in different groups with the p value < .05 as statistically significant. Further, the RBPs expression of TCGA cohort were uploaded to Tumor Immune Dysfunction and Exclusion (TIDE) website (http://tide.dfci.harvard.edu/) in order to predict the immunotherapy response of the two different groups. Also, with the p value < .01 as statistically significant, effective chemotherapeutic drugs targeting low- or high-risk group were screened out via using Drug Sensitivity in Cancer (GDSC) database (https://www.cancerrxgene.org/) [23].
Cell culture
Three LSCC cell lines and HuLa-PC were used to verify the gene expression. As described before [24], cell culture assays were performed. Moreover, a normal epithelial cell (HuLa-PC) was purchased from ATCC (Gaithersburg, MD, USA) and cultured in BEGM (CC-3170 Lonza).
qRT-PCR
We performed real-time quantitative reverse transcriptase PCR (qRT-PCR) as described in our previous study [24]. The primers were synthesized by Sangon Biotech Co., Ltd. (Shanghai, China). Primer sequences are detailed in Supplementary Table 2.
Independent prognosis analysis
Based on the entire cohort, we tried to judge whether the risk score that calculated by our prognostic signature was an independent prognostic factor for LSCC by univariate and multivariate Cox regression analyses.
Nomogram construction
To better connect with the clinical application, we developed a nomogram by “rms” package of R software according to the result of independent prognosis analysis. Nomogram can assess the overall survival rate of patients with LSCC at different time points according to the scoring of independent prognostic factors. Time-dependent calibration curves were plotted to verify the effectiveness of nomogram internally.
Statistical analysis
R software (version: x64 3.6.1) and GraphPad Prism7 were used for all statistical analyses in this study. The results of qRT-PCR were subjected to GraphPad Prism7 software by the Student’s t-test. A p-value < .05 was regarded as statistically significant.
Results
Identification of DERBPs
The research design is illustrated in Figure 1. According to the screening criteria (adjusted p-value < .05, | log (FC) | ≥ 0.5), 285 DERBPs were identified (Supplementary Table 3). Among them, 111 down-regulated and 174 up-regulated DERBPs were identified (Figure 2).
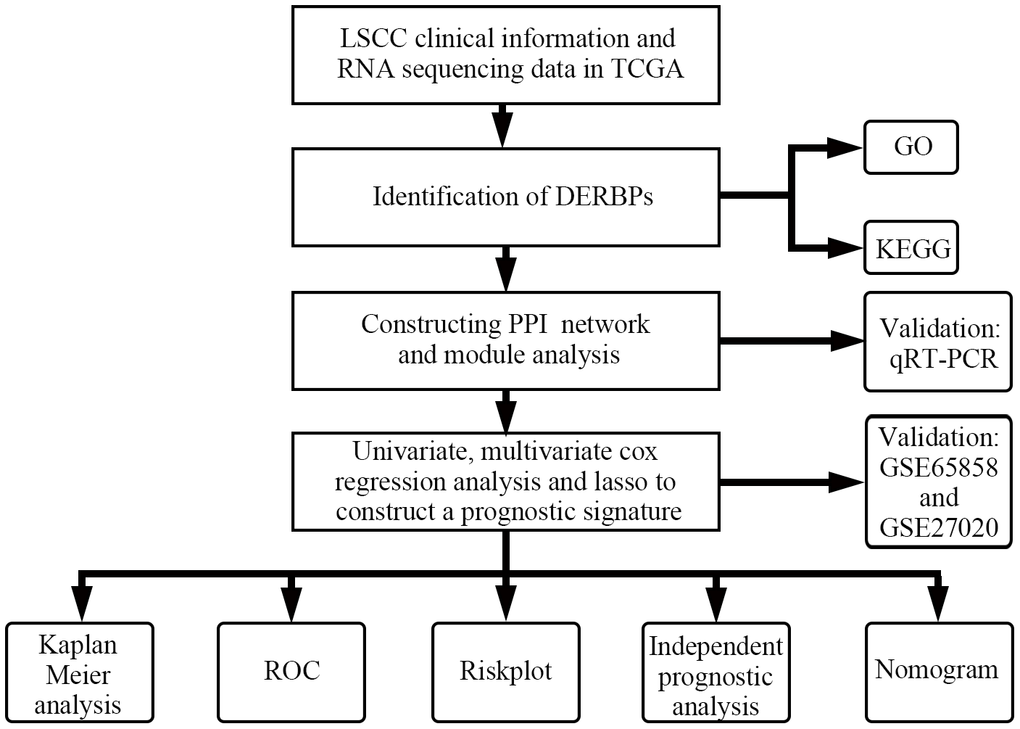
Figure 1. Flowchart of this study.
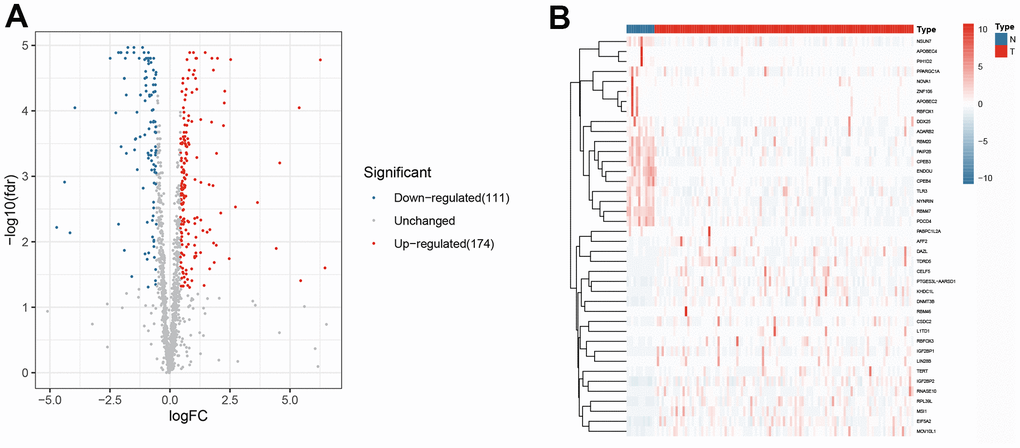
Figure 2. The differentially expressed RNA-binding proteins from TCGA. (A) Volcano plot; (B) Heat map.
GO and KEGG analysis of DERBPs
The results indicated that down-regulated DERBPs were significantly enriched in the biological processes including mRNA processing, translation regulation, cellular amide regulation, metabolic processes, mRNA catabolic processes, and RNA catabolic processes (Table 1). The up-regulated DERBPs were significantly enriched in the non-coding RNA (ncRNA) metabolic processes, mRNA processing, RNA splicing, ncRNA processing, RNA splicing, and transesterification reactions (Table 1). According to the analysis of cellular component, down-regulated DERBPs were enriched in the ribosomal subunit, ribonucleoprotein granule, cytosolic ribosome, ribosome, and cytoplasmic ribonucleoprotein granule. On the other hand, the up-regulated DERBPs were mainly enriched in the spliceosomal complex, U2-type precatalytic spliceosome, precatalytic spliceosome, cytoplasmic ribonucleoprotein granule, and ribonucleoprotein granule (Table 1). According to the molecular function analysis, the down-regulated DERBPs were enriched during catalytic activity, acting on the RNA, AU-rich element binding, mRNA 3’-UTR AU-rich region binding, mRNA 3’-UTR binding, and ribonucleoprotein complex binding (Table 1), while the up-regulated DERBPs were significantly enriched during catalytic activity, acting on the RNA, nuclease activity, ribonuclease activity, transfer (tRNA), and tRNA binding (Table 1). Moreover, we found that down-regulated DERBPs were mainly enriched in mRNA surveillance pathway, ribosomes, RNA transport, and progesterone-mediated oocyte maturation; while up-regulated RBPs were significantly enriched in spliceosome, RNA transport, RNA degradation, mRNA surveillance pathway, and cytosolic DNA-sensing pathway (Table 1).
Table 1. Gene ontology pathway and Kyoto Encyclopedia of Genes and Genomes enrichment analysis of differentially expressed RNA-binding proteins.
| Description | p value | p.adjust | |
| Down-regulated RBPs | |||
| BP | mRNA processing | 3.32E-17 | 4.98E-14 |
| regulation of translation | 7.43E-13 | 5.58E-10 | |
| regulation of cellular amide metabolic process | 7.23E-12 | 3.62E-09 | |
| mRNA catabolic process | 6.79E-11 | 2.55E-08 | |
| RNA catabolic process | 2.38E-10 | 7.14E-08 | |
| CC | ribosomal subunit | 2.89E-07 | 2.14E-05 |
| ribonucleoprotein granule | 5.84E-07 | 2.14E-05 | |
| cytosolic ribosome | 6.23E-07 | 2.14E-05 | |
| ribosome | 7.51E-07 | 2.14E-05 | |
| cytoplasmic ribonucleoprotein granule | 3.75E-06 | 8.56E-05 | |
| MF | catalytic activity, acting on RNA | 1.15E-11 | 2.39E-09 |
| AU-rich element binding | 8.77E-09 | 4.78E-07 | |
| mRNA 3'-UTR AU-rich region binding | 8.77E-09 | 4.78E-07 | |
| mRNA 3'-UTR binding | 9.19E-09 | 4.78E-07 | |
| ribonucleoprotein complex binding | 2.40E-08 | 1.00E-06 | |
| KEGG | mRNA surveillance pathway | 0.000158718 | 0.007591248 |
| Ribosome | 0.00025733 | 0.007591248 | |
| RNA transport | 0.000518043 | 0.010188172 | |
| Progesterone-mediated oocyte maturation | 0.002382425 | 0.03514077 | |
| Up-regulated RBPs | |||
| BP | ncRNA metabolic process | 2.31E-32 | 3.98E-29 |
| mRNA processing | 1.08E-26 | 8.80E-24 | |
| RNA splicing | 1.96E-26 | 8.80E-24 | |
| ncRNA processing | 2.04E-26 | 8.80E-24 | |
| RNA splicing, via transesterification reactions | 1.24E-20 | 4.26E-18 | |
| CC | spliceosomal complex | 1.30E-10 | 2.26E-08 |
| U2-type precatalytic spliceosome | 2.95E-10 | 2.26E-08 | |
| precatalytic spliceosome | 2.95E-10 | 2.26E-08 | |
| cytoplasmic ribonucleoprotein granule | 4.61E-10 | 2.65E-08 | |
| ribonucleoprotein granule | 1.10E-09 | 4.33E-08 | |
| MF | catalytic activity, acting on RNA | 1.01E-30 | 2.15E-28 |
| nuclease activity | 7.84E-14 | 8.35E-12 | |
| ribonuclease activity | 4.07E-13 | 2.89E-11 | |
| catalytic activity, acting on a tRNA | 8.50E-13 | 4.52E-11 | |
| tRNA binding | 2.46E-11 | 1.05E-09 | |
| KEGG | Spliceosome | 1.19E-15 | 6.33E-14 |
| RNA transport | 1.04E-08 | 2.75E-07 | |
| RNA degradation | 4.52E-08 | 7.99E-07 | |
| mRNA surveillance pathway | 2.20E-05 | 0.000291209 | |
| Cytosolic DNA-sensing pathway | 0.002889905 | 0.026712079 |
PPI network construction
As shown in Figure 3A, 3B, PPI network was established to further screen the hub DERBPs in LSCC. The most three important modules were screened out and shown in Figure 3C–3E. Pathway enrichment analysis of the three key modules showed that the hub DERBPs were related to RNA activities, such as RNA splicing, RNA transport and RNA binding (Supplementary Table 4).
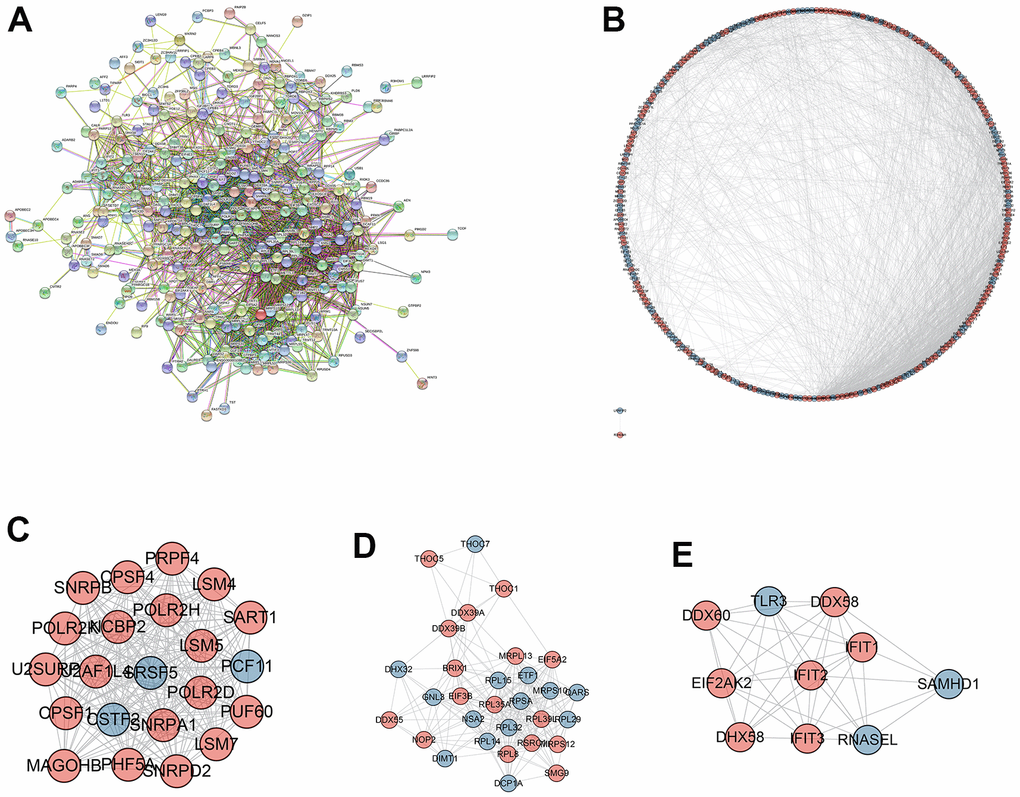
Figure 3. Protein-protein interaction (PPI) network and module analysis. (A) PPI network of integrated DERBPs by String database; (B) Visualized PPI analysis of DERBPs based on Cytoscape; (C–E) Top three modules from the PPI network.
Identification of a RBPs-associated prognostic signature
In training cohort, ten RBPs related to prognosis were obtained for the LASSO analysis (Table 2). Next, the LASSO analysis was performed, and the coefficients of five DERBPs are shown in Figure 4. Subsequently, through multivariate Cox regression, three RBPs (GTPBP3, KHDRBS3 and RBM38) were selected to develop the transcriptomic signature for LSCC (Figure 4C and Table 3). The calculation formula of the risk score based on training cohort was described below:
Risk score = (-2.421 * Exp GTPBP3) + (2.022 * Exp KHDRBS3) + (-1.071 * Exp RBM38).
Table 2. Univariate Cox regression analysis for prognostic signature.
| id | HR | HR.95L | HR.95H | pvalue |
| KHDRBS3 | 7.072258353 | 2.609931172 | 19.16404492 | 0.000119996 |
| RBM38 | 0.216674422 | 0.078590104 | 0.597375531 | 0.003119943 |
| EIF5A2 | 3.429842961 | 1.389144386 | 8.46839454 | 0.007523681 |
| GTPBP3 | 0.130350488 | 0.028933995 | 0.587241752 | 0.00797546 |
| CCDC86 | 4.703911956 | 1.496876874 | 14.78196909 | 0.008038545 |
| TDRD3 | 7.617503865 | 1.443551636 | 40.19694458 | 0.016732381 |
| CD3EAP | 3.877391645 | 1.156712741 | 12.99732028 | 0.028101935 |
| CPEB3 | 0.028673549 | 0.000949282 | 0.86609916 | 0.041088249 |
| NARS | 3.177289338 | 1.019643854 | 9.900680028 | 0.04620559 |
| THOC7 | 2.769197743 | 1.003182988 | 7.644124983 | 0.04928726 |
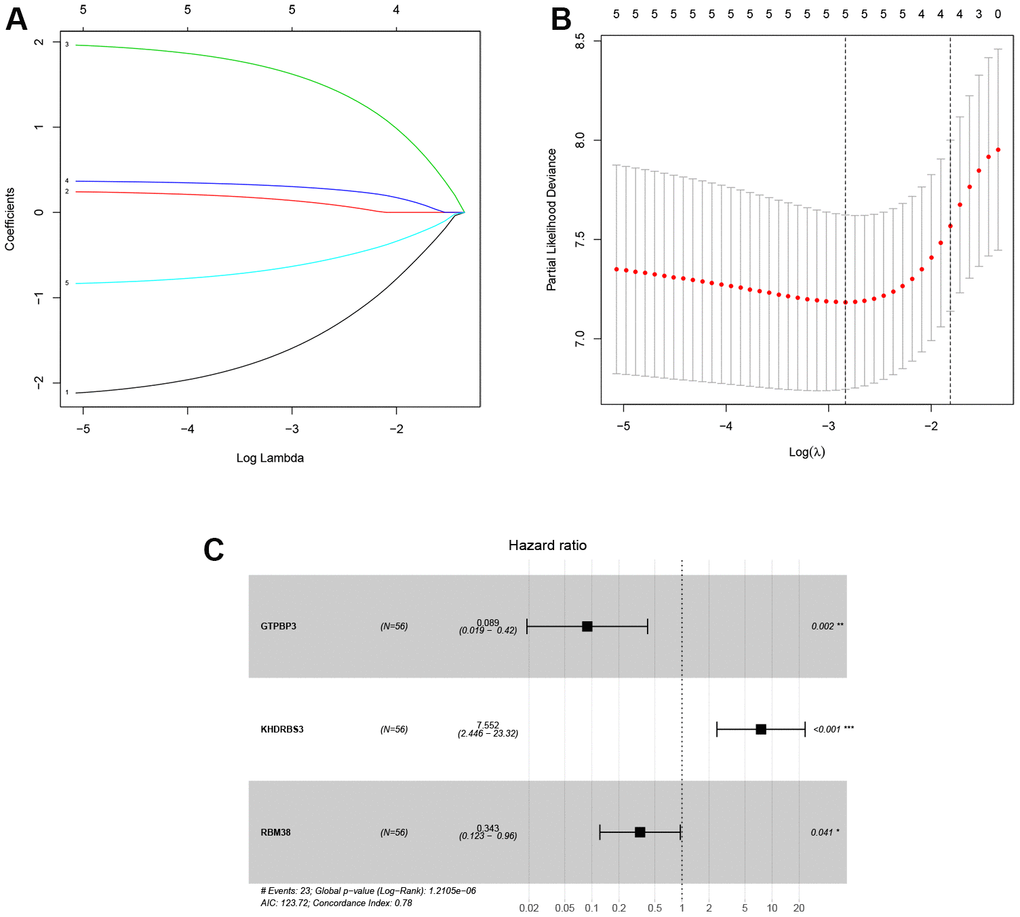
Figure 4. Identification of prognosis-related DERBPs associated with laryngeal squamous cell carcinoma. (A, B) LASSO coefficient profiles of DERBPs selected by univariate Cox regression analysis; (C) Forest plot of multivariate Cox regression analysis.
Table 3. Multivariate Cox regression analysis for prognostic signature.
| id | coef | HR | HR.95L | HR.95H | pvalue |
| GTPBP3 | -2.421490619 | 0.088789168 | 0.01897852 | 0.415391518 | 0.002098438 |
| KHDRBS3 | 2.021819781 | 7.552055522 | 2.445703998 | 23.31988772 | 0.000440374 |
| RBM38 | -1.070742906 | 0.342753789 | 0.122551551 | 0.958618301 | 0.041300275 |
In training cohort, there was a worse prognosis for high-risk group compared with low-risk group (p < .001, Figure 5A). The one-, three-, and five-years AUC values of the signature was 0.895, 0.883 and 0.89 (Figure 5B), indicating great diagnostic capability of the prognostic signature. The survival status of patients and risk score of the signature consisting of the three DERBPs in the low- and high-risk subgroups were shown in Figure 5C, 5D.
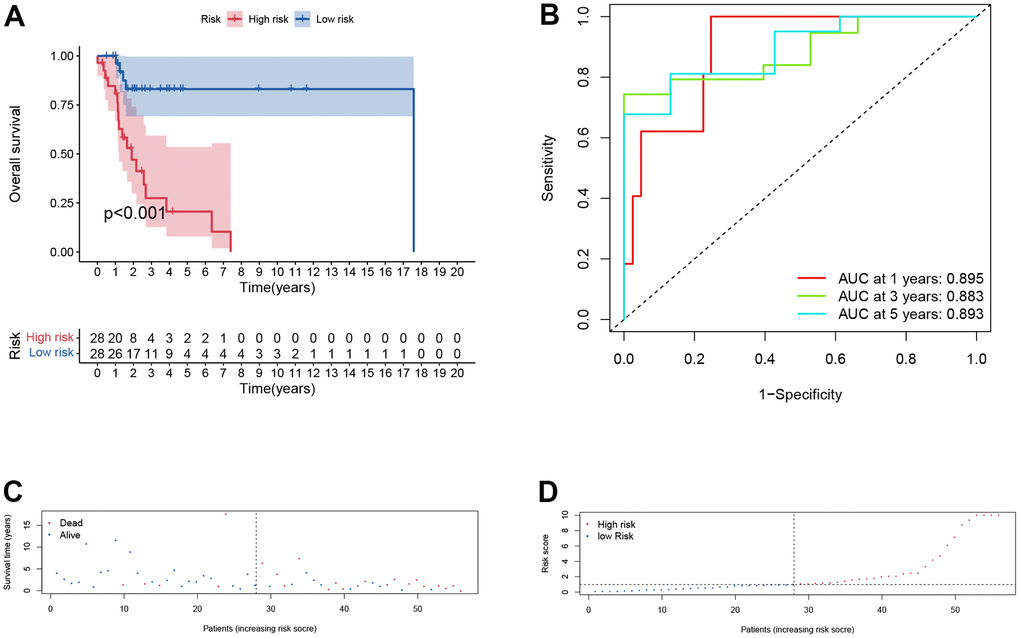
Figure 5. Prognostic assessment of the transcriptomic signature in training cohort. (A) Kaplan-Meir (KM) survival curves; (B) Receiver operating characteristic curves; (C, D) Risk score distribution and survival status.
Furthermore, the same analysis methods were applied in different cohorts, including test cohort (n=55), entire cohort (n=111), GSE65858 cohort (n=270) and GSE27020 cohort (n=109). In test cohort, patients with a higher risk score also had a worse overall survival than those with a lower risk score (p = 0.048, Figure 6A) and entire cohort (p < .001, Figure 7A). The Time-dependent AUC values of test cohort and entire cohort were plotted in Figures 6B, 7B. In GSE27020 cohort, patients with higher risk score were more likely to have a worse disease-free survival compared with patients in the lower risk score (p = 0.011, Supplementary Figure 1A). The Time-dependent AUC values of GSE27020 cohort were plotted in Supplementary Figure 1B. In GSE65858 cohort (n=270), patients with a higher risk score also had a worse overall survival (p = 0.147, Supplementary Figure 2A). The AUC values of the GSE65858 cohort was displayed in Supplementary Figure 2B. As shown in Supplementary Figure 2C, 2D, patients with higher risk score had a higher mortality.
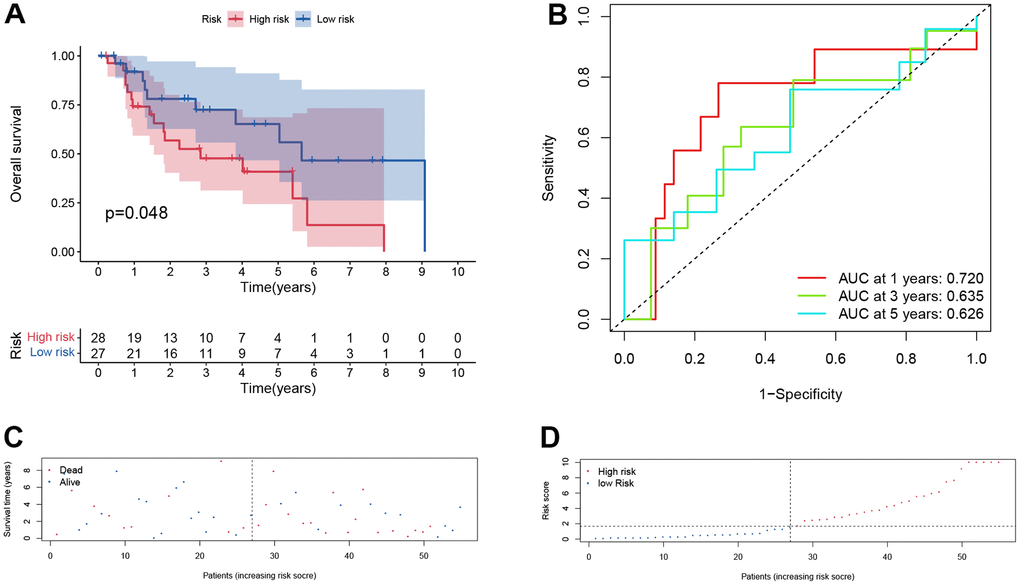
Figure 6. Prognostic assessment of the transcriptomic signature in training cohort in test cohort. (A) Kaplan-Meir (KM) survival curves; (B) Receiver operating characteristic curves; (C, D) Risk score distribution and survival status.
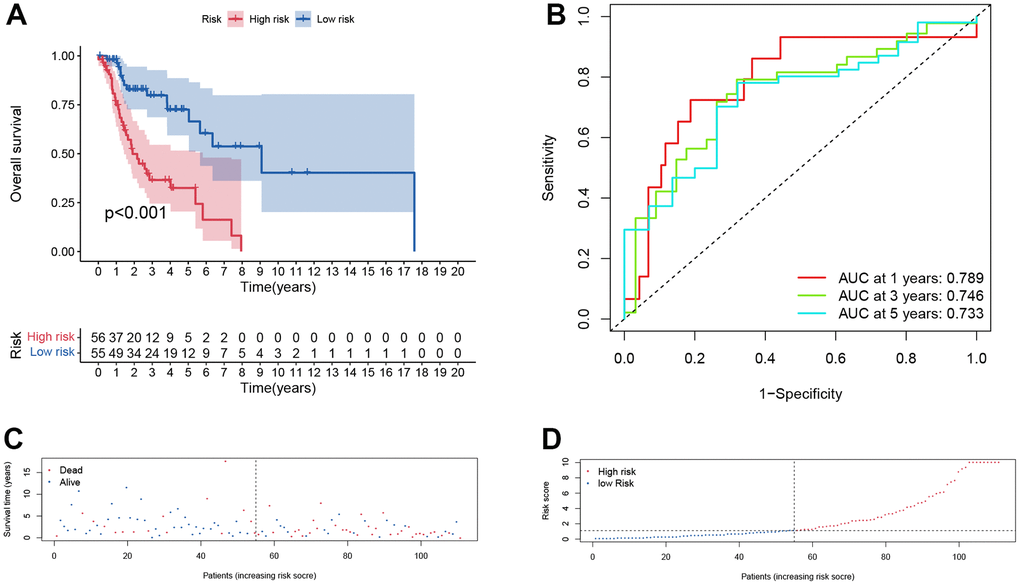
Figure 7. Prognostic assessment of the transcriptomic signature in TCGA cohort. (A) Kaplan-Meir (KM) survival curves; (B) Receiver operating characteristic curves; (C, D) Risk score distribution and survival status.
Immune context of the prognostic signature
To explore the immune characteristics of different subgroups, in TCGA cohort, CIBERSORT (Supplementary Figure 3A) and ssGSEA (Supplementary Figure 3B) algorithms were performed. While only para-inflammation was differentially enriched in the high-risk and low-risk groups, there was no significant difference in immune cell infiltration and TIDE scores between the high-risk and low-risk groups (Supplementary Figure 3C). Additionally, we found that patients in the low-risk group were more sensitive to KIN001-135, MP470, QL-XII-61 and VX-702 (Supplementary Figure 3D–3G).
Verification by qRT-PCR
In clinical tissues, higher GTPBP3 and RBM38 expression were found in LSCC tissues, while lower KHDRBS3 expression was found (Figure 8D–8F), which was consistent with the results of differential expression analysis from TCGA (Figure 8A–8C). In cell lines, the same results were noted. (Figure 8G–8I).
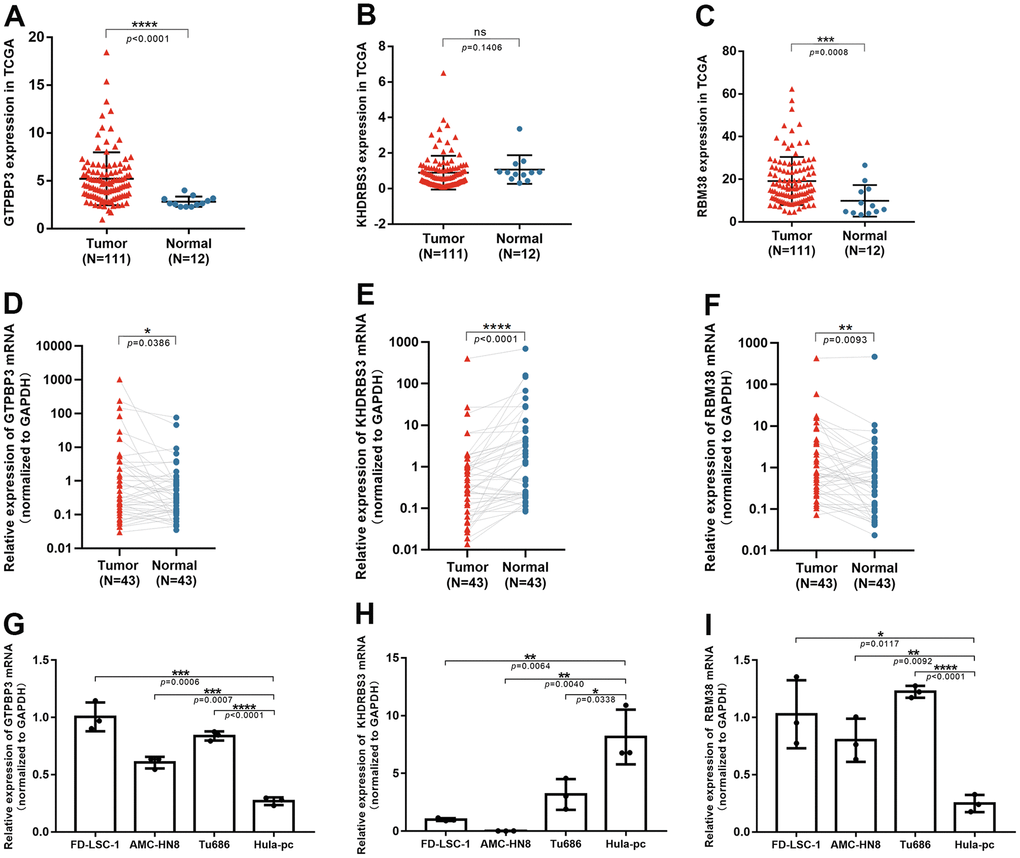
Figure 8. The validation of three RBPs in tissues and cell lines through qRT-PCR. (A–C) Expression of GTPBP3, KHDRBS3 and RBM38 in TCGA database; (D–F) GTPBP3 and RBM38 presented higher expression in LSCC, compared to their adjacent normal tissue, while KHDRBS3 was the opposite; (G–I) GTPBP3 and RBM38 presented higher expression in LSCC cell lines, compared to laryngeal epithelial cell line HuLa-PC, while KHDRBS3 was the opposite.
Independent prognosis analysis
Univariate and multivariate Cox regression analysis suggested that gender, lymph node metastasis and risk score were independent prognostic factors of LSCC patients (p < .05, Figure 9A, 9B). These results suggested that the risk score calculated by transcriptomic signature was an independent risk factor for patients with LSCC.
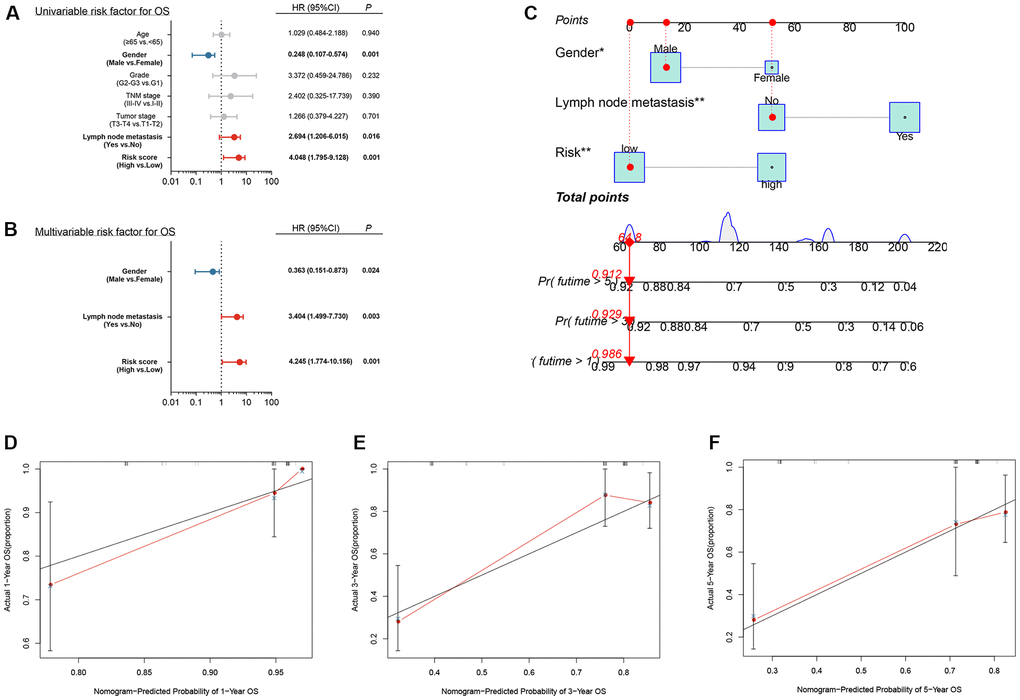
Figure 9. Independent prognostic analysis and construction of a nomogram (A) Univariate analysis of clinical factors; (B) Multivariate analysis of clinical factors; (C) Nomogram for predicting one-, three-, and five-year overall survival of laryngeal squamous cell carcinoma patients based on entire cohort; (D–F) Calibration plots of the nomogram based on one-, three-, and five-year overall survival. The y-axis represents actual survival, and the x-axis represents nomogram-predicted survival.
Construction of a nomogram based on the three hub DERBPs
Based on the independent prognosis analysis, a nomogram integrating gender, lymph node metastasis and risk score was developed based on the entire cohort to predict the overall survival of LSCC patients at one, three, and five years after diagnosis (Figure 9C). The calibration curves for predicting one-, three- and five-year overall survival showed that the nomogram-predicted survival rate closely matched the ideal curve (Figure 9D–9F). Our results suggested that, the nomogram we developed according to independent prognosis analysis exhibited great performance for risk stratification of LSCC.
Discussion
Even with advances in treatment modalities, the prognosis of laryngeal cancer remains poor and the survival rates have not been obviously improved. Hence, it is urgently required to explore molecular mechanisms and identify novel signatures, which could assess the tumor behavior during initial diagnosis in LSCC patients [25]. Nowadays, RNA-sequencing technology was widely applied to development of disease prognostic model [26, 27]. Perfect and effective prognostic features can improve personalized patient management. The large amount of genomic information collected from individual tumor samples has promoted the identification of novel diagnostic, prognostic, or predictive biomarkers [28]. For example, Peng identified a novel gene signature for the prognosis of gastric cancer [29]; Yang found five significant microRNAs related to the prognosis of colorectal cancer [30]; Zhong suggested that six long non-coding RNAs (lncRNAs) might be involved with breast cancer–related biological processes [31]; Zhang identified 214 differentially expressed lncRNAs, and found a novel four-lncRNA signature that could predict the prognosis of cancer [32].
Despite the universal application of prognostic signatures, few signatures were constructed and assessed for laryngeal cancer. To our knowledge, this is the first time that RBPs has been combined with laryngeal cancer. Prognosis-related RBPs were filtered out and a transcriptomic signature was developed according to three RBPs expression (GTPBP3, KHDRBS3, and RBM38).
GTP binding protein 3 (GTPBP3) exists in mitochondria and exerts effects on mitochondria [33]. Past studies suggested that GTPBP3 was associated with some oxidative phosphorylation diseases [33]. As an example, Chen et al. [34] suggested that GTPBP3 was related to mitochondrial tRNA metabolism. Moreover, GTPBP3 is also correlated with primary angle closure glaucoma [35] and non-syndromic hearing loss [36].
KH RNA binding domain containing, signal transduction associated 3 (KHDRBS3) was initially found to be associated with spermatogenesis. Recent research has indicated that KHDRBS3 is strongly involved in tumorigenesis and development. Shi [37] suggested that KHDRBS3 drove circ-0088300 to accelerate the metastasis of gastric carcinoma cells. In colorectal cancer cells, KHDRBS3 was found to promote drug resistance by maintaining stem cell stemness [38]. In this study, lower KHDRBS3 expression was detected in LSCC tissues.
RNA binding motif protein (38RBM38) is located on chromosome 20q13 and is expressed broadly in bone marrow and lymph node [39]. It is worth mentioning that the expression levels of RBM38 are different in different tumor, indicating that the function of RBM38 in tumors is complex. RBM38 acts as a tumor suppressor by reducing c-Myc and enhancing PTEN expression in breast cancer [40]; Observations in most studies suggested that RBM38 promotes cancer [41, 42].
In this study, higher GTPBP3, higher RBM38 and lower KHDRBS3 expression were found in LSCC tissues and cell lines. We developed a transcriptomic signature associated with these prognostic RBPs for laryngeal cancer and verified in internal and external cohorts. Interestingly, based on the results of independent prognostic analysis and the nomogram we constructed, we found that female gender was an independent prognostic factor and females were more likely to suffer from laryngeal cancer. Statistically, laryngeal cancer occurs more commonly in men than in women and the incidence of laryngeal cancer in men is nearly five times that in women [43]. In this retrospective analysis, we found that the prognosis of laryngeal cancer in women was worse than that in men, which could give new hints for our clinical work.
In the previous studies, Duan et al. [44–47] developed a transcriptomic signature based on RBPs in HNSCC. HNSCC contains many regions such as pharynx, larynx, tongue, oral cavity, nasal cavity and paranasal cavity. However, the biological characteristics and overall survival rate of different HNSCC regions are rather divergent. Therefore, it may lead to confusion if many tumor types are enrolled in one study. Based on the principle of precision therapy, we believe studying the function of RBPs in LSCC instead a composition of multiple HNSCC could obtain better results in terms of precision and minimize bias. As far as we know, this was the first attempt to develop a prognostic signature and nomogram based on RBPs for prognostic evaluation in LSCC. In general, the signature showed a higher AUC value than those by other studies [44–47] in predicting 3- and 5-year OS (Supplementary Figure 3H, 3I), indicating a better sensitivity and specificity.
Also, the research we conducted has some shortcomings. The tumor sample size used to construct the transcriptomic signature was small and more LSCC cohorts needed to be collected and included for further analysis. More, molecular biology experiments on GTPBP3, KHDRBS3 and RBM38 need to be performed.
Conclusions
In this study, we identified differentially expressed RBPs and screened an innovative three-RBP signature to predict the outcome of LSCC patients for the first time. Results from different independent cohorts showed that this prognostic signature had decent discriminative ability in predicting the prognosis of LSCC patients.
Supplementary Materials
Abbreviations
RBPs: RNA-binding proteins; LSCC: laryngeal squamous cell carcinoma; DERBPs: differentially expressed RBPs; TCGA: The Cancer Genome Atlas; GO: Gene Ontology; KEGG: Kyoto Encyclopedia of Genes and Genomes; LASSO: least absolute shrinkage and selection operator; GEO: Gene Expression Omnibus; NCBI: National Center of Biotechnology Information; NGS: next-generation sequencing; ROC: receiver operating characteristic; CI: confidence intervals.
Author Contributions
YS and HC performed the data curation and analysis. QH and HD analyzed and interpreted the results. LZ and YS drafted and reviewed the manuscript. All authors read and approved the final manuscript. YS, HC and QH contributed equally to this study.
Acknowledgments
We would like to thank the reviewers for their careful reviewing and helpful comments on the manuscript.
Conflicts of Interest
The authors declare that there are no potential conflicts of interest.
Ethical Statement and Consent
Tumor sample and paired normal adjacent sample from 43 patients with laryngeal cancer were collected between October 2020 to June 2021 at Department of Otorhinolaryngology, Eye and ENT Hospital, Fudan University. The Ethical Committee of Eye and ENT Hospital, Fudan University approved this study and informed consents were acquired from all participants.
Funding
The present study was supported by grants from the National Natural Science Foundation of China [No. 81972529] and the Science and Technology Commission of Shanghai Municipality [No. 19411961300].
References
- 1. Choong N, Vokes E. Expanding role of the medical oncologist in the management of head and neck cancer. CA Cancer J Clin. 2008; 58:32–53. https://doi.org/10.3322/CA.2007.0004 [PubMed]
- 2. Zhang Q, Xiong Y, Lin L, Yuan K. Analysis of related factors of surgical treatment effect on 215 patients with laryngeal cancer. Exp Ther Med. 2018; 15:2786–91. https://doi.org/10.3892/etm.2018.5741 [PubMed]
- 3. Nocini R, Molteni G, Mattiuzzi C, Lippi G. Updates on larynx cancer epidemiology. Chin J Cancer Res. 2020; 32:18–25. https://doi.org/10.21147/j.issn.1000-9604.2020.01.03 [PubMed]
- 4. Rettig EM, D’Souza G. Epidemiology of head and neck cancer. Surg Oncol Clin N Am. 2015; 24:379–96. https://doi.org/10.1016/j.soc.2015.03.001 [PubMed]
- 5. Zheng J, Zhang X, Zhao X, Tong X, Hong X, Xie J, Liu S. Deep-RBPPred: Predicting RNA binding proteins in the proteome scale based on deep learning. Sci Rep. 2018; 8:15264. https://doi.org/10.1038/s41598-018-33654-x [PubMed]
- 6. Zaharieva E, Haussmann IU, Bräuer U, Soller M. Concentration and Localization of Coexpressed ELAV/Hu Proteins Control Specificity of mRNA Processing. Mol Cell Biol. 2015; 35:3104–15. https://doi.org/10.1128/MCB.00473-15 [PubMed]
- 7. Livi CM, Klus P, Delli Ponti R, Tartaglia GG. catRAPID signature: identification of ribonucleoproteins and RNA-binding regions. Bioinformatics. 2016; 32:773–5. https://doi.org/10.1093/bioinformatics/btv629 [PubMed]
- 8. Gerstberger S, Hafner M, Tuschl T. A census of human RNA-binding proteins. Nat Rev Genet. 2014; 15:829–45. https://doi.org/10.1038/nrg3813 [PubMed]
- 9. Yang ZS, Qing H, Gui H, Luo J, Dai LJ, Wang B. Role of caprin-1 in carcinogenesis. Oncol Lett. 2019; 18:15–21. https://doi.org/10.3892/ol.2019.10295 [PubMed]
- 10. Kumari P, Aeschimann F, Gaidatzis D, Keusch JJ, Ghosh P, Neagu A, Pachulska-Wieczorek K, Bujnicki JM, Gut H, Großhans H, Ciosk R. Evolutionary plasticity of the NHL domain underlies distinct solutions to RNA recognition. Nat Commun. 2018; 9:1549. https://doi.org/10.1038/s41467-018-03920-7 [PubMed]
- 11. Vanharanta S, Marney CB, Shu W, Valiente M, Zou Y, Mele A, Darnell RB, Massagué J. Loss of the multifunctional RNA-binding protein RBM47 as a source of selectable metastatic traits in breast cancer. Elife. 2014; 3:e02734. https://doi.org/10.7554/eLife.02734 [PubMed]
- 12. Guo C, Shao T, Jiang X, Wei D, Wang Z, Li M, Bao G. Comprehensive analysis of the functions and prognostic significance of RNA-binding proteins in bladder urothelial carcinoma. Am J Transl Res. 2020; 12:7160–73. [PubMed]
- 13. Wang CF, Zhang HC, Feng XM, Song XM, Wu YN. Knockdown of MSI1 inhibits the proliferation of human oral squamous cell carcinoma by inactivating STAT3 signaling. Int J Mol Med. 2019; 44:115–24. https://doi.org/10.3892/ijmm.2019.4181 [PubMed]
- 14. Guan A, Wang H, Li X, Xie H, Wang R, Zhu Y, Li R. MiR-330-3p inhibits gastric cancer progression through targeting MSI1. Am J Transl Res. 2016; 8:4802–11. [PubMed]
- 15. Liu L, Qiu F, Chen J, Wu D, Nong Q, Zhou Y, Lu J. Functional Polymorphism in the MSI1 Gene Promoter Confers a Decreased Risk of Lung Cancer in Chinese by Reducing MSI1 Expression. Curr Genomics. 2018; 19:375–83. https://doi.org/10.2174/1389202919666171128151544 [PubMed]
- 16. Gene Ontology Consortium. Gene Ontology Consortium: going forward. Nucleic Acids Res. 2015; 43:D1049–56. https://doi.org/10.1093/nar/gku1179 [PubMed]
- 17. Kanehisa M, Furumichi M, Tanabe M, Sato Y, Morishima K. KEGG: new perspectives on genomes, pathways, diseases and drugs. Nucleic Acids Res. 2017; 45:D353–61. https://doi.org/10.1093/nar/gkw1092 [PubMed]
- 18. Wu J, Jin S, Gu W, Wan F, Zhang H, Shi G, Qu Y, Ye D. Construction and Validation of a 9-Gene Signature for Predicting Prognosis in Stage III Clear Cell Renal Cell Carcinoma. Front Oncol. 2019; 9:152. https://doi.org/10.3389/fonc.2019.00152 [PubMed]
- 19. Zhang G, Fan E, Yue G, Zhong Q, Shuai Y, Wu M, Feng G, Chen Q, Gou X. Five genes as a novel signature for predicting the prognosis of patients with laryngeal cancer. J Cell Biochem. 2019. [Epub ahead of print]. https://doi.org/10.1002/jcb.29535 [PubMed]
- 20. Li W, Gao LN, Song PP, You CG. Development and validation of a RNA binding protein-associated prognostic model for lung adenocarcinoma. Aging (Albany NY). 2020; 12:3558–73. https://doi.org/10.18632/aging.102828 [PubMed]
- 21. Newman AM, Liu CL, Green MR, Gentles AJ, Feng W, Xu Y, Hoang CD, Diehn M, Alizadeh AA. Robust enumeration of cell subsets from tissue expression profiles. Nat Methods. 2015; 12:453–7. https://doi.org/10.1038/nmeth.3337 [PubMed]
- 22. Huang L, Wu C, Xu D, Cui Y, Tang J. Screening of Important Factors in the Early Sepsis Stage Based on the Evaluation of ssGSEA Algorithm and ceRNA Regulatory Network. Evol Bioinform Online. 2021; 17:11769343211058463. https://doi.org/10.1177/11769343211058463 [PubMed]
- 23. Yang W, Soares J, Greninger P, Edelman EJ, Lightfoot H, Forbes S, Bindal N, Beare D, Smith JA, Thompson IR, Ramaswamy S, Futreal PA, Haber DA, et al. Genomics of Drug Sensitivity in Cancer (GDSC): a resource for therapeutic biomarker discovery in cancer cells. Nucleic Acids Res. 2013; 41:D955–61. https://doi.org/10.1093/nar/gks1111 [PubMed]
- 24. Shen Y, Huang Q, Zhang Y, Hsueh CY, Zhou L. A novel signature derived from metabolism-related genes GPT and SMS to predict prognosis of laryngeal squamous cell carcinoma. Cancer Cell Int. 2022; 22:226. https://doi.org/10.1186/s12935-022-02647-2 [PubMed]
- 25. Wong N, Khwaja SS, Baker CM, Gay HA, Thorstad WL, Daly MD, Lewis JS
Jr , Wang X. Prognostic microRNA signatures derived from The Cancer Genome Atlas for head and neck squamous cell carcinomas. Cancer Med. 2016; 5:1619–28. https://doi.org/10.1002/cam4.718 [PubMed] - 26. Shen S, Bai J, Wei Y, Wang G, Li Q, Zhang R, Duan W, Yang S, Du M, Zhao Y, Christiani DC, Chen F. A seven-gene prognostic signature for rapid determination of head and neck squamous cell carcinoma survival. Oncol Rep. 2017; 38:3403–11. https://doi.org/10.3892/or.2017.6057 [PubMed]
- 27. Shi H, Chen J, Li Y, Li G, Zhong R, Du D, Meng R, Kong W, Lu M. Identification of a six microRNA signature as a novel potential prognostic biomarker in patients with head and neck squamous cell carcinoma. Oncotarget. 2016; 7:21579–90. https://doi.org/10.18632/oncotarget.7781 [PubMed]
- 28. Subramanian J, Simon R. What should physicians look for in evaluating prognostic gene-expression signatures? Nat Rev Clin Oncol. 2010; 7:327–34. https://doi.org/10.1038/nrclinonc.2010.60 [PubMed]
- 29. Peng PL, Zhou XY, Yi GD, Chen PF, Wang F, Dong WG. Identification of a novel gene pairs signature in the prognosis of gastric cancer. Cancer Med. 2018; 7:344–50. https://doi.org/10.1002/cam4.1303 [PubMed]
- 30. Yang G, Zhang Y, Yang J. A Five-microRNA Signature as Prognostic Biomarker in Colorectal Cancer by Bioinformatics Analysis. Front Oncol. 2019; 9:1207. https://doi.org/10.3389/fonc.2019.01207 [PubMed]
- 31. Zhong L, Lou G, Zhou X, Qin Y, Liu L, Jiang W. A six-long non-coding RNAs signature as a potential prognostic marker for survival prediction of ER-positive breast cancer patients. Oncotarget. 2017; 8:67861–70. https://doi.org/10.18632/oncotarget.18919 [PubMed]
- 32. Zhang G, Fan E, Zhong Q, Feng G, Shuai Y, Wu M, Chen Q, Gou X. Identification and potential mechanisms of a 4-lncRNA signature that predicts prognosis in patients with laryngeal cancer. Hum Genomics. 2019; 13:36. https://doi.org/10.1186/s40246-019-0230-6 [PubMed]
- 33. Villarroya M, Prado S, Esteve JM, Soriano MA, Aguado C, Pérez-Martínez D, Martínez-Ferrandis JI, Yim L, Victor VM, Cebolla E, Montaner A, Knecht E, Armengod ME. Characterization of human GTPBP3, a GTP-binding protein involved in mitochondrial tRNA modification. Mol Cell Biol. 2008; 28:7514–31. https://doi.org/10.1128/MCB.00946-08 [PubMed]
- 34. Chen D, Zhang Z, Chen C, Yao S, Yang Q, Li F, He X, Ai C, Wang M, Guan MX. Deletion of Gtpbp3 in zebrafish revealed the hypertrophic cardiomyopathy manifested by aberrant mitochondrial tRNA metabolism. Nucleic Acids Res. 2019; 47:5341–55. https://doi.org/10.1093/nar/gkz218 [PubMed]
- 35. Qiao C, Jia H, Zhang H, Wang H, Liang J, Song J, Li L, Duan X, Cao K, Hu J. Coding Variants in HOOK2 and GTPBP3 May Contribute to Risk of Primary Angle Closure Glaucoma. DNA Cell Biol. 2020; 39:949–57. https://doi.org/10.1089/dna.2019.5079 [PubMed]
- 36. Khatami S, Rokni-Zadeh H, Mohsen-Pour N, Biglari A, Changi-Ashtiani M, Shahrooei M, Shahani T. Whole exome sequencing identifies both nuclear and mitochondrial variations in an Iranian family with non-syndromic hearing loss. Mitochondrion. 2019; 46:321–5. https://doi.org/10.1016/j.mito.2018.08.006 [PubMed]
- 37. Shi H, Huang S, Qin M, Xue X, Guo X, Jiang L, Hong H, Fang J, Gao L. Exosomal circ_0088300 Derived From Cancer-Associated Fibroblasts Acts as a miR-1305 Sponge and Promotes Gastric Carcinoma Cell Tumorigenesis. Front Cell Dev Biol. 2021; 9:676319. https://doi.org/10.3389/fcell.2021.676319 [PubMed]
- 38. Ukai S, Sakamoto N, Taniyama D, Harada K, Honma R, Maruyama R, Naka K, Hinoi T, Takakura Y, Shimizu W, Ohdan H, Yasui W. KHDRBS3 promotes multi-drug resistance and anchorage-independent growth in colorectal cancer. Cancer Sci. 2021; 112:1196–208. https://doi.org/10.1111/cas.14805 [PubMed]
- 39. Shu L, Yan W, Chen X. RNPC1, an RNA-binding protein and a target of the p53 family, is required for maintaining the stability of the basal and stress-induced p21 transcript. Genes Dev. 2006; 20:2961–72. https://doi.org/10.1101/gad.1463306 [PubMed]
- 40. Zhou XJ, Wu J, Shi L, Li XX, Zhu L, Sun X, Qian JY, Wang Y, Wei JF, Ding Q. PTEN expression is upregulated by a RNA-binding protein RBM38 via enhancing its mRNA stability in breast cancer. J Exp Clin Cancer Res. 2017; 36:149. https://doi.org/10.1186/s13046-017-0620-3 [PubMed]
- 41. Ye J, Liang R, Bai T, Lin Y, Mai R, Wei M, Ye X, Li L, Wu F. RBM38 plays a tumor-suppressor role via stabilizing the p53-mdm2 loop function in hepatocellular carcinoma. J Exp Clin Cancer Res. 2018; 37:212. https://doi.org/10.1186/s13046-018-0852-x [PubMed]
- 42. Lin QY, Yin HL. RBM38 induces SIRT1 expression during hypoxia in non-small cell lung cancer cells by suppressing MIR34A expression. Biotechnol Lett. 2020; 42:35–44. https://doi.org/10.1007/s10529-019-02766-3 [PubMed]
- 43. Steuer CE, El-Deiry M, Parks JR, Higgins KA, Saba NF. An update on larynx cancer. CA Cancer J Clin. 2017; 67:31–50. https://doi.org/10.3322/caac.21386 [PubMed]
- 44. Duan X, Cheng X, Yin X, Ke Z, Song J. Systematic analysis of the function and prognostic value of RNA binding protein in head and neck squamous cell carcinoma. Eur Arch Otorhinolaryngol. 2022; 279:1535–47. https://doi.org/10.1007/s00405-021-06929-9 [PubMed]
- 45. Hu G, Jiang Q, Liu L, Peng H, Wang Y, Li S, Tang Y, Yu J, Yang J, Liu Z. Integrated Analysis of RNA-Binding Proteins Associated With the Prognosis and Immunosuppression in Squamous Cell Carcinoma of Head and Neck. Front Genet. 2021; 11:571403. https://doi.org/10.3389/fgene.2020.571403 [PubMed]
- 46. Ming R, Li X, Wang E, Wei J, Liu B, Zhou P, Yu W, Zong S, Xiao H. The Prognostic Signature of Head and Neck Squamous Cell Carcinoma Constructed by Immune-Related RNA-Binding Proteins. Front Oncol. 2022; 12:795781. https://doi.org/10.3389/fonc.2022.795781 [PubMed]
- 47. Yang X, Han B, Zhang R, Su Y, Hosseini DK, Wu H, Yang M, Sun H. Development and validation of a RNA binding protein-associated prognostic model for head and neck squamous cell carcinoma. Aging (Albany NY). 2021; 13:7975–97. https://doi.org/10.18632/aging.202848 [PubMed]