


Introduction
Lung cancer has the highest incidence and mortality of all cancers [1, 2]. Lung adenocarcinoma (LUAD) is a major component of lung cancer, accounting for 40% of lung cancer [3]. Although the oncology treatment of advanced lung cancer has made significant progress in recent years, the 5-year survival rate remains poor. Therefore, further studies on the underlying mechanism of tumor initiation and development are necessary.
MicroRNA (miRNA) is a class of short non-coding RNA molecules ranging from 19 to 25 nucleotides [3–5]. MiRNAs work by base-pairing with complementary sequences within the mRNA molecule [6, 7]. More and more researches are focusing on the miRNA-mRNA regulation pairs, trying to explore the mechanism of the pairs in the occurrence and development of the disease [8–10].
The research performed an extensive analysis of miRNA-mRNA regulatory pairs in LUAD to provide a new strategy for the underlying mechanism of LUAD.
Materials and Methods
miRNA and mRNA expression profiles
We downloaded the miRNA and mRNA expression profile from the TCGA database and the Gene Expression Omnibus (GEO) database. We use the GEO database web analytics tool GEO2R and “limma” and the “edgeR” R bag to filter DE-mRNAs and DE-miRNAs. The overview of the workflow steps is shown in Figure 1.
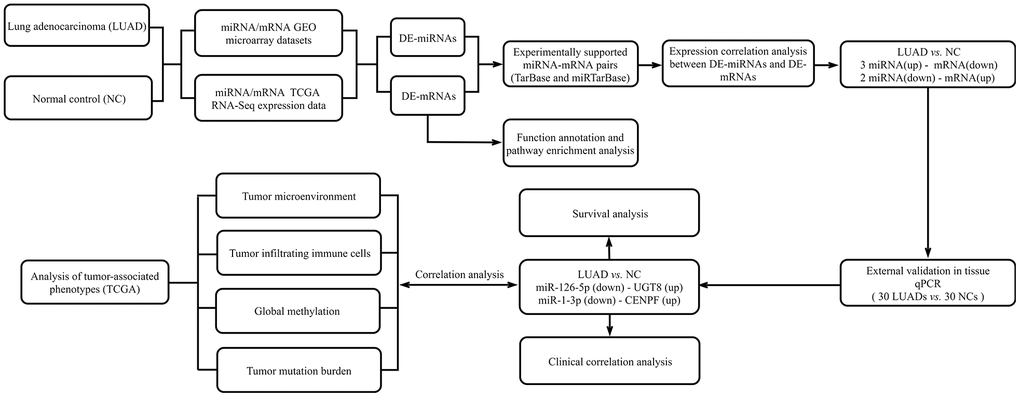
Figure 1. Flow chart for identifying the miRNA-mRNA regulatory networks and the comprehensive analysis of regulatory pairs role in lung adenocarcinoma (LUAD).
Analysis of miRNA-mRNA regulation pairs
TarBase and miRTarBase databases were used to screen miRNA-mRNA regulatory pairs. TarBase and miRTarBase are experimentally supported miRNA target index reference databases [11, 12]. Then, we further analyzed the correlation between miRNA and mRNA in TCGA-LUAD. We used DAVID, Diana-miRPath and Hiplot for functional and pathway analysis [13].
Sample collection
Formalin-fixed paraffin-embedded (FFPE) of LUAD and corresponding normal tissues were obtained from the First Affiliated Hospital of Nanjing Medical University. This study was conducted in accordance with the Helsinki Declaration and approved by the Institutional Review Committee of the First Affiliated Hospital of Nanjing Medical University (ID: 2016-SRFA-148). All specimens were collected with informed written consent of patients. The clinical characteristics of the 30 patients are listed in Table 1.
Table 1. Clinicopathological and molecular features of LUAD patients.
| Variables | Number of cases | Rate (%) |
| (n=30) | ||
| Age (years) | ||
| ≤60 | 14 | 46.7 |
| >60 | 16 | 53.3 |
| Gender | ||
| Female | 21 | 70 |
| Male | 9 | 30 |
| Tumor size (cm) | ||
| ≤3 | 21 | 70 |
| > 3 | 9 | 30 |
| TNM stage | ||
| I | 21 | 70 |
| II-IV | 9 | 30 |
| Lymph node metastasis | ||
| No | 21 | 70 |
| Yes | 9 | 30 |
| Bronchial invasion | ||
| No | 24 | 80 |
| Yes | 6 | 20 |
Quantitative reverse transcription PCR (qRT-PCR) assay
External validation of qRT-PCR validation was performed using PrimeScript RT reagent Kit (Takara) and SYBR Premix Ex Taq II (Takara). PCR primer sequences are shown in Supplementary Table 1. We used the 2-ΔΔCt to calculate miRNA and mRNA expression levels (ΔCt = CtmiRNA/mRNA− Ctnormalizer; Ct: the threshold cycle) [14].
Cell culture and cell transfection
Lung adenocarcinoma cell lines A549 was obtained from the American Type Culture Collection (ATCC). The cells were seeded into 24-well plates. The miR-126-5p mimics, miR-1-3p mimics, Negative control mimics were purchased from RiboBio. When cell fusion reached 60%, cells were transfected with 20mM Opti-MEM transfection medium (Invitrogen) and Lipofectamine 2000(Invitrogen).
Cell proliferation and scratch wound healing assays
Cell Counting Kit-8 (CCK-8, Dojindo, Kumamoto, Japan) assay was used to assess cell proliferation. At indicated time points (24h, 48h, 72h, 96h), the cells were incubated in 10% CCK8 solution in culture medium at 37° C. The absorbance at 450nm was measured with a microplate reader. To examine the migratory ability of cells in vitro, the scratch wound healing assay was performed. When the cells were cultured to 80%-90% in 6-well plates, after the medium was discarded, the cells were scratched with 100 μL tip. The cells were placed in serum-free DMEM medium and observed at 0 and 24h.
Statistical analysis
We used the IBM SPSS Statistics v.26 software, GraphPad Prism software and R language v3.6.3 (https://cran.r-project.org/) to analyze the data.
Data availability statement
The data that support the findings of this study are available from the corresponding author upon reasonable request.
Results
Screening of differentially expressed miRNA and mRNA
A total of 7 miRNA and 13 mRNA expression datasets were downloaded from GEO database, and the information of 20 GEO datasets is shown in Table 2. As shown in Figure 2A, the GEO2R tool was used to analyze each dataset, and the DE-miRNAs and DE-mRNAs in each dataset were screened out. Then, the intersection was taken in the GEO database. A rank-sum test was performed to screen out the DE-miRNAs and DE-mRNAs in the TCGA database. A total of 11 miRNAs and 128 mRNAs were selected with differences in both databases as the final DE-miRNAs and DE-mRNAs (Table 3). We utilized DIANA-miRPath to predict the possible functions of the 11 DE-miRNAs (Figure 2B). KEGG pathway enrichment analysis revealed that the DE-mRNAs enriched in the drug metabolism, etc. (Figure 2C). The GO terms were enriched in the cell adhesion, cellular protein modification process, cytoplasm, organelle, etc.
Table 2. Information pertaining to the selected GEO datasets for LUAD.
| Experiment type | Source name | GEO accession | Platform | Group | ||
| Tumor | Control | |||||
| microRNA expression | Array | Tissue | GSE51853 | GPL7341 | 76 | 5 |
| GSE135918 | GPL18058 | 5 | 5 | |||
| GSE63805 | GPL18410 | 32 | 30 | |||
| GSE77380 | GPL16770 | 3 | 12 | |||
| GSE74190 | GPL19622 | 36 | 44 | |||
| GSE36681 | GPL8179 | 103 | 103 | |||
| GSE48414 | GPL16770 | 154 | 20 | |||
| mRNA expression | Array | Tissue | GSE1037 | GPL962 | 12 | 19 |
| GSE116959 | GPL17077 | 57 | 11 | |||
| GSE19188 | GPL570 | 45 | 65 | |||
| GSE1987 | GPL91 | 7 | 7 | |||
| GSE2088 | GPL962 | 9 | 30 | |||
| GSE21933 | GPL6254 | 11 | 21 | |||
| GSE27262 | GPL570 | 25 | 25 | |||
| GSE32863 | GPL6884 | 58 | 58 | |||
| GSE33532 | GPL570 | 40 | 20 | |||
| GSE40275 | GPL15974 | 8 | 43 | |||
| GSE43458 | GPL6244 | 40 | 30 | |||
| GSE62113 | GPL14951 | 7 | 9 | |||
| GSE63459 | GPL6883 | 33 | 32 | |||
Table 3. The list of DE-miRNAs and DE-mRNAs (up-regulated or down-regulated in LUAD).
| DE-miRNA (down) | DE-mRNA(up) | DE-miRNA(up) | DE-mRNA(down) |
| hsa-miR-139-5p | ANLN | hsa-miR-182-5p | ABCA8 |
| hsa-miR-30a-3p | AURKA | hsa-miR-183-5p | ABLIM3 |
| hsa-miR-486-5p | BAIAP2L1 | hsa-miR-196a-5p | ACADL |
| hsa-miR-1-3p | BUB1 | hsa-miR-96-5p | ADAMTSL3 |
| hsa-miR-126-5p | CCNA2 | hsa-miR-135b-5p | ADARB1 |
| CCNB1 | hsa-miR-9-5p | ADH1B | |
| CDCA7 | AFAP1L1 | ||
| CEACAM1 | AGER | ||
| CEACAM5 | AHNAK | ||
| CENPF | AQP4 | ||
| CTHRC1 | BMP2 | ||
| CXCL13 | BMPR2 | ||
| EZH2 | BTNL9 | ||
| FHL2 | CADM1 | ||
| HIST1H2BD | CALCRL | ||
| HMGA1 | CAT | ||
| KIF11 | CAV1 | ||
| METTL7B | CBX7 | ||
| PDIA4 | CD34 | ||
| PGM2L1 | CD36 | ||
| PLOD2 | CD93 | ||
| PTTG1 | CDH5 | ||
| S100P | CLDN18 | ||
| SPP1 | CLEC1A | ||
| STK39 | CLIC5 | ||
| SULF1 | CPB2 | ||
| TK1 | CYBRD1 | ||
| TPX2 | CYYR1 | ||
| UGT8 | DACH1 | ||
| XPR1 | DPT | ||
| EDNRB | |||
| EFEMP1 | |||
| EMCN | |||
| FABP4 | |||
| FAM107A | |||
| FBLN1 | |||
| FBLN5 | |||
| FCN3 | |||
| FEZ1 | |||
| FGD5 | |||
| FHL1 | |||
| FHL5 | |||
| FMO2 | |||
| FZD4 | |||
| GAS6 | |||
| GATA2 | |||
| GKN2 | |||
| GNG11 | |||
| GPC3 | |||
| GPM6A | |||
| GPM6B | |||
| GRASP | |||
| GRK5 | |||
| GSTM5 | |||
| ID3 | |||
| IGSF10 | |||
| KLF4 | |||
| LDLR | |||
| LMO2 | |||
| LMO7 | |||
| MAL | |||
| MAOB | |||
| METTL7A | |||
| MFAP4 | |||
| MME | |||
| MYH10 | |||
| MYH11 | |||
| MYL9 | |||
| PDE8B | |||
| PDZD2 | |||
| PLEKHH2 | |||
| PODXL | |||
| PRELP | |||
| PTPRB | |||
| PTPRM | |||
| RAMP2 | |||
| RHOJ | |||
| SASH1 | |||
| SCGB1A1 | |||
| SDPR | |||
| SFTPC | |||
| SH2D3C | |||
| SLC39A8 | |||
| SLIT2 | |||
| SNRK | |||
| SOSTDC1 | |||
| SPARCL1 | |||
| STARD13 | |||
| STX11 | |||
| STXBP6 | |||
| TBX2 | |||
| TEK | |||
| TGFBR3 | |||
| THBD | |||
| TIMP3 | |||
| TMEM47 | |||
| VWF | |||
| WIF1 |
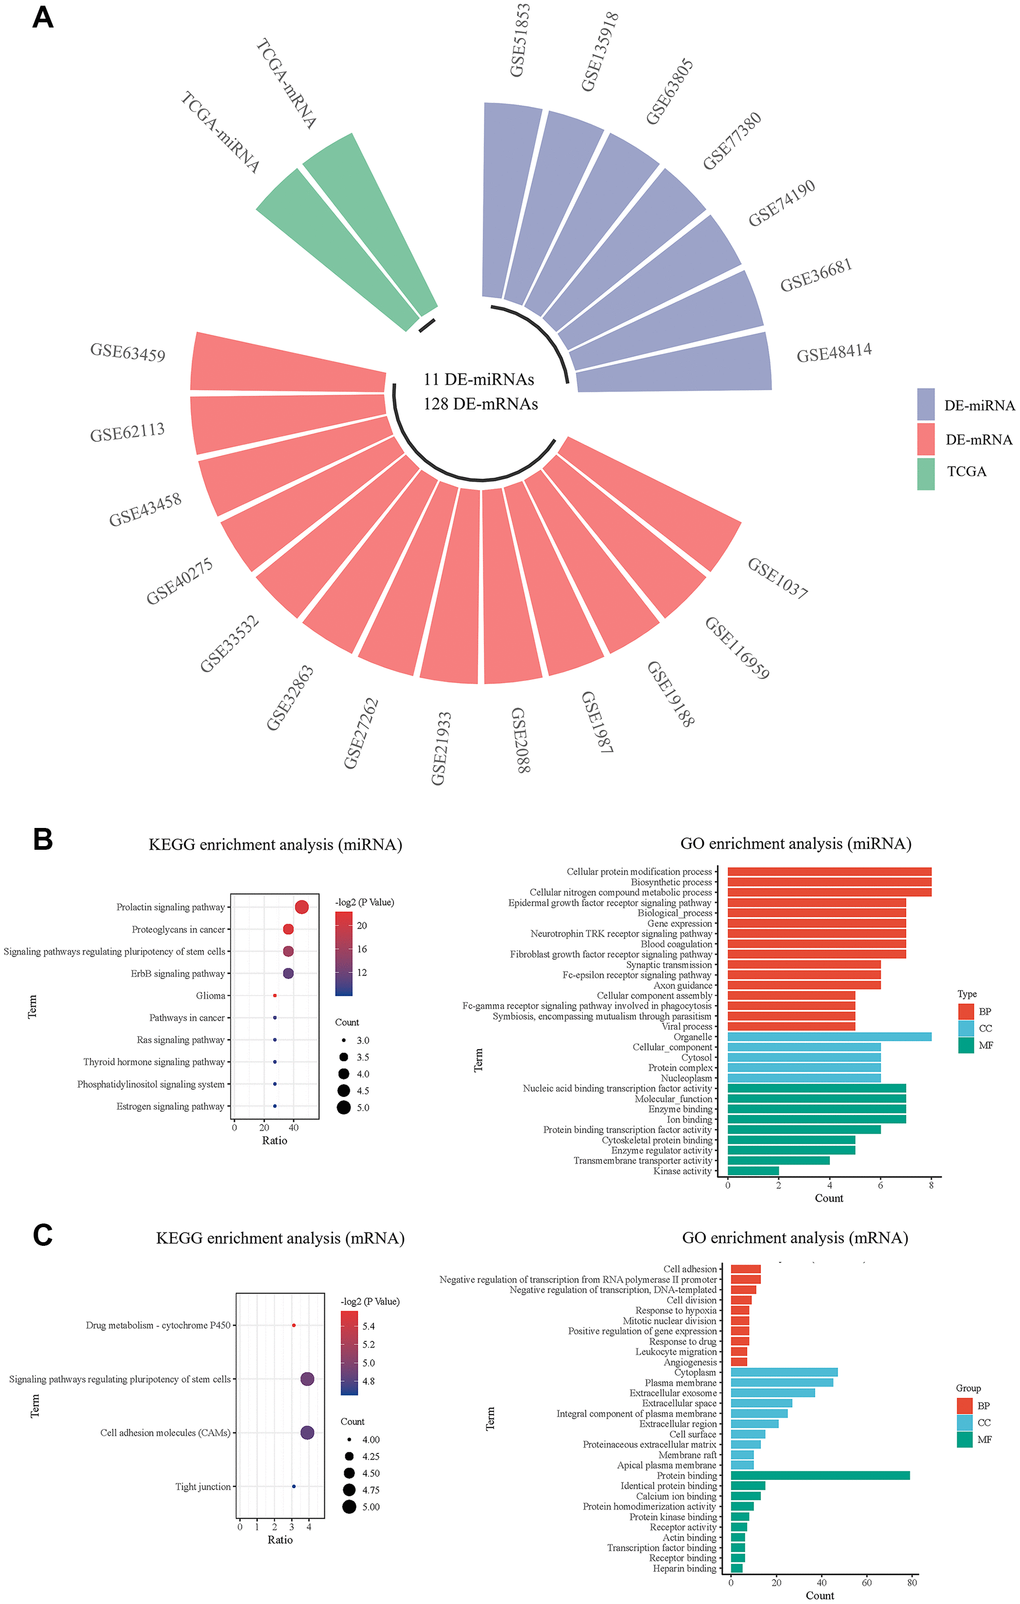
Figure 2. Screening and pathway analysis of DE-miRNAs and DE-mRNA. (A) The circular bar chart showing the datasets from different sources for screening differentially expressed miRNAs and mRNAs; (B) The KEGG and GO enrichment analysis of DE-miRNAs; (C) The KEGG and GO enrichment analysis of DE-mRNAs.
Screening of miRNA-RNA regulatory pairs
As shown in Figure 3A, six miRNA-mRNA regulation pairs (miR-1-3p/CENPF, miR-126-5p/UGT8, miR-135b-5p/BMPR2, miR-9-5p/STARD13, miR-196a-5p/TGFBR3, miR-1-3p/UGT8) were identified. The 6 pairs of miRNA-mRNA were experimentally verified, and the 4 miRNA-mRNA pairs in TCGA-LUAD showed significant negative correlation (Figure 3B).
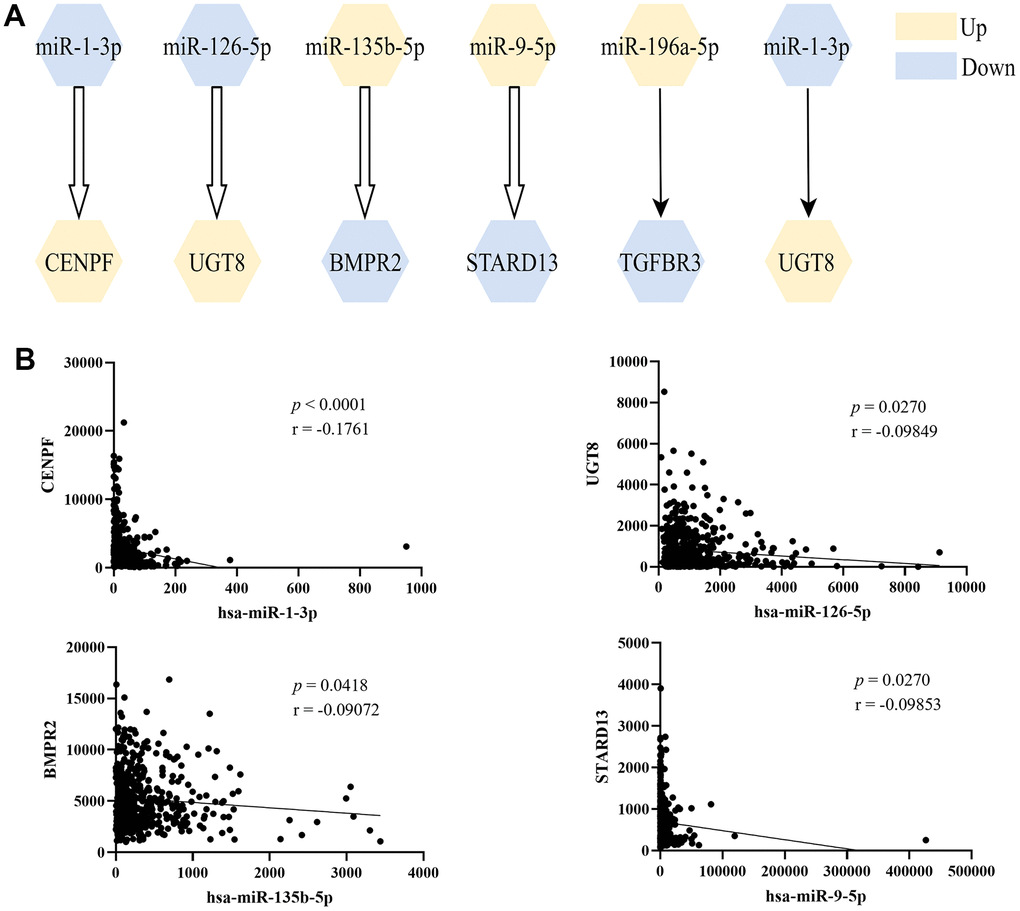
Figure 3. The screened miRNA-mRNA regulation pairs. (A) Six miRNA-mRNA regulatory pairs were screened from miRTarBase and TarBase databases, and the first four were verified by correlation analysis; (B) Pearson’s correlation analysis of miRNA-mRNA regulation pairs in TCGA-LUAD.
Verification of miRNAs and mRNAs expression in LUAD tissues
We used qRT-PCR to verify 4 miRNA-mRNA pairs in 30 matched tissues. In Figure 4, the expression of the miR-1-3p (P=0.0037) and miR-126-5p (P=0.0032) were down-regulated in tumor tissues, while miR-135b-5p (P=0.0037), CENPF (P<0.001) and UGT8 (P<0.001) were up-regulated. There was no significant difference in the expression of miR-9-5p (P=0.0841), BMPR2 (P=0.4522), and STARD13 (P=0.1241). Spearman correlation analysis showed that miR-1-3p was significantly correlated with CENPF expression (P<0.001, r=-0.5398), and miR-126-5p was significantly correlated with UGT8 (P=0.0116, r=-0.3239). IHC images in the HPA database evidenced higher expression of CENPF and UGT8 in LUAD tissue than in normal control and the results are shown in Supplementary Figure 1.
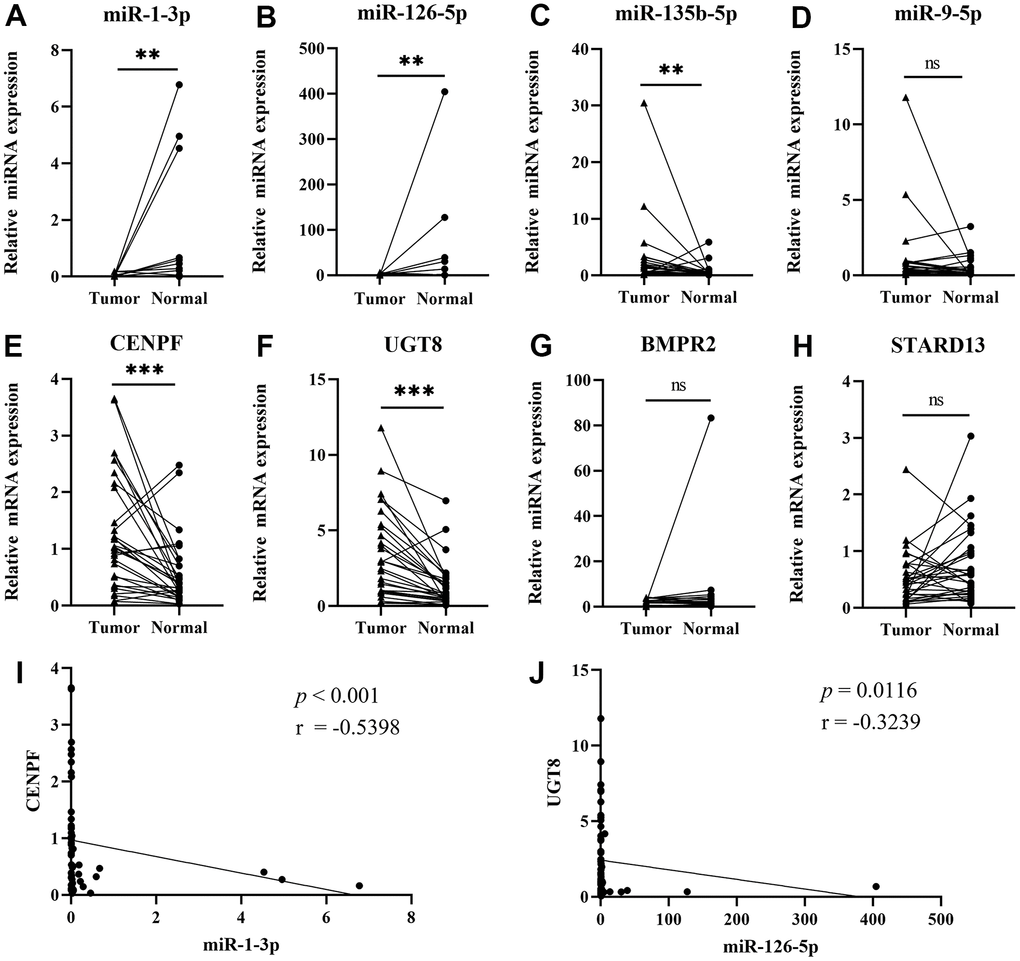
Figure 4. Validating the expression of the four networks by qRT-PCR. (Data are presented as mean±SEM; *p < 0.05, **p < 0.01, ***p < 0.001). (A) miR-1-3p; (B) miR-126-5p; (C) miR-135b-5p; (D) miR-9-5p; (E) CENPF; (F) UGT8; (G) BMPR2; (H) STARD13; (I) Pearson’s correlation analysis of miR-1-3p and CENPF; (J) Pearson’s correlation analysis of miR-126-5p and UGT8.
Analysis of the diagnostic efficacy
MiR-1-3p, PTPRM, miR-126-5p and UGT8 were combined as a panel using the logistic regression analysis, and the equation to predict LUAD probability was: Logit(P) = 0.813 + 0.028*miR-126-5p – 0.262*UGT8 + 1.727*miR-1-3p – 0.526*CENPF. The AUC of the panel was 0.973 (95% CI: 0.955-0.991, p<0.0001) in TCGA-LUAD and 0.771 (95% CI: 0.652-0.890, p<0.0001) in the external validation (Figure 5A, 5B). The DCA results showed that regulation pairs had good diagnostic performance (Figure 5C, 5D).
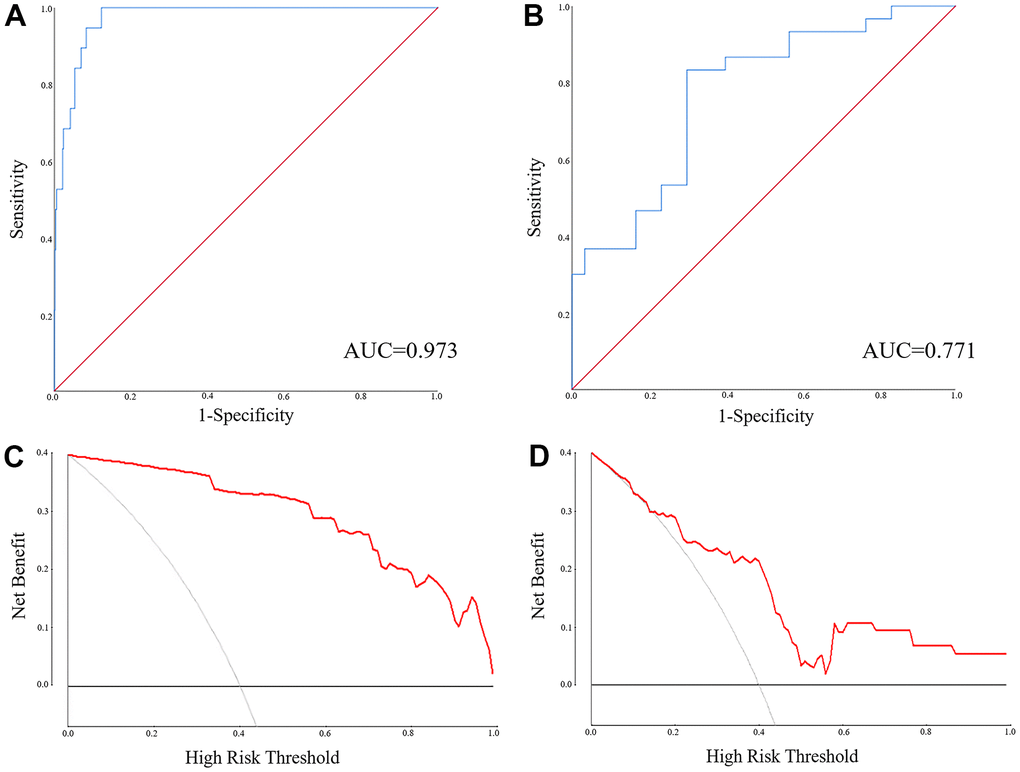
Figure 5. The ROC and DCA of the panel of miR-1-3p, miR-126-5p, CENPF and UGT8 for discriminating LUAD patients from NCs. (A) The ROC of the TCGA-LUAD (AUC = 0.973, 95% CI: 0.955-0.991, p<0.0001); (B) The ROC of the external validation (AUC = 0.771, 95% CI: 0.652-0.890, p<0.0001); (C) The DCA of the external validation; (D) The DCA of the TCGA-LUAD.
Correlation analysis of LUAD clinical-pathological features and survival analysis
According to the analysis of FIGO stages, the expression of CENPF (P=0.008) is lower in early-stage (I) than late-stage (II+III+IV) (Figure 6A). The expression of miR-1-3p (P=0.001) in female patients is higher, while CENPF (P=0.001) was lower in female patients (Figure 6B). CENPF was higher in the age≤65 group while UGT8 was lower in the age≤65 group (Figure 6C). We analyzed the association of the regulation pairs and gene mutations in KRAS, ROS1, ALK, and EGFR. The level of miR-1-3p was higher in KRAS(P=0.039), ROS1(P=0.013), ALK(P=0.02) wild-type LUAD tissues than KRAS-mutated LUAD tissues (P=0.039, P=0.013, and P=0.02, respectively). The expression of CENPF was higher in ROS1-mutated, ALK-mutated LUAD tissues and EGFR wild-type LUAD tissues (P<0.001, P=0.008, and P=0.041, respectively) shown in Figure 6D. K-M survival analysis showed that CENPF (P=0.026) correlated with prognosis, and the higher the CENPF expression level, the worse the prognosis (Figure 6E).
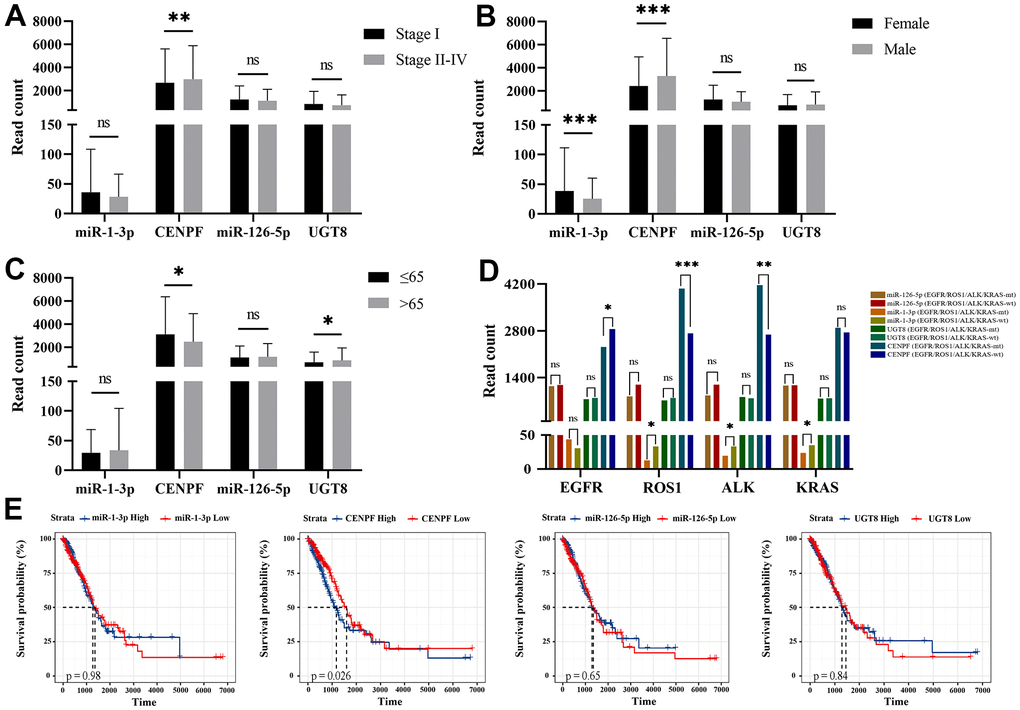
Figure 6. Correlation analysis of LUAD clinical-pathological features and survival analysis with the expression of miRNA and mRNA expression levels. (Data are presented as mean±SEM; *p < 0.05; **p < 0.01; ***p < 0.001). (A) Stage I vs. Stage II-IV; (B) Female vs. Male; (C) Age ≤ 65 vs. Age > 65; (D) mutation vs. wild-type of KRAS, ROS1, ALK, EGFR; (E) The survival analysis of miR-1-3p, CENPF, miR-126-5p and UGT8 in TCGA-LUAD.
Validation of cell experiments
We transfected miR-1-3p mimic and miR-126-5p mimic into A549 cells to established miR-1-3p and miR-126-5p overexpressed cells to investigate the potential function in regulating LUAD cell proliferation. The expression level of miR-1-3p and miR-126-5p in A549 cells upregulated significantly after transfecting miR-1-3p and miR-126-5p mimic (Figure 7A). We found that the mRNA levels of CENPF and UGT8 were declined after transfecting miR-1-3p mimics and miR-126-5p mimics respectively (Figure 7A). Then CCK8 assay was performed to testify the effects of miR-1-3p and miR-126-5p on cell proliferation. MiR-1-3p and miR-126-5p overexpressed significantly inhibited cell proliferation of A549 cells after transfecting 48h, 72h and 96h (Figure 7B). To gain further insight into the role of miR-1-3p and miR-126-5p in LUAD cell migration was performed in A549 cells transfected with miR-1-3p and miR-126-5p mimics or Negative control. The overexpression of miR-1-3p and miR-126-5p significantly inhibited LUAD cell migration (Figure 7C).
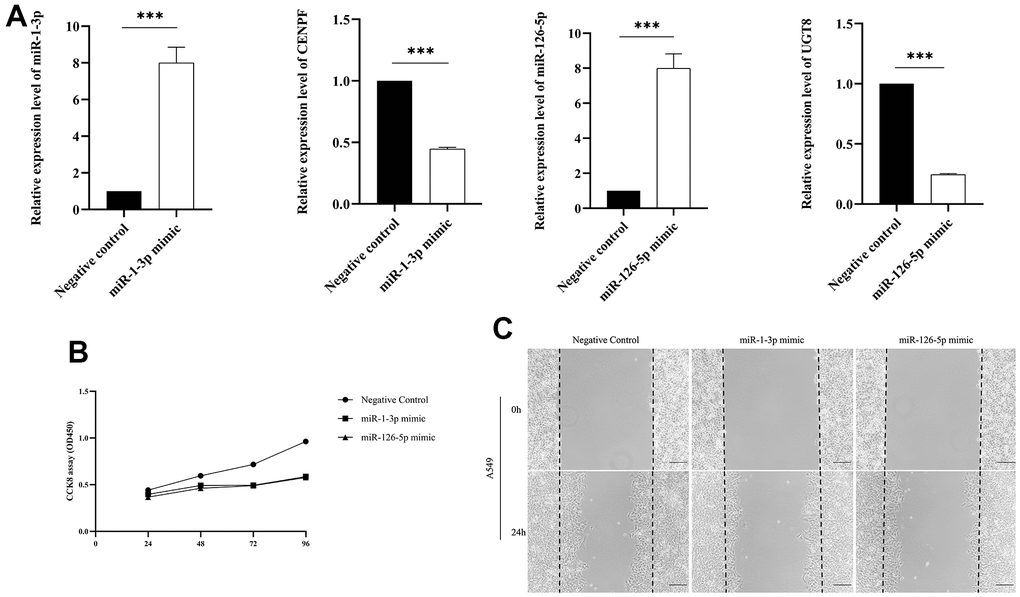
Figure 7. The validation of biological function assays. (Data are presented as mean±SD; *p < 0.05; **p < 0.01; ***p < 0.001). (A) Comparison of miRNA and mRNA expression levels between transfected miR-1-3p mimic and miR-126-5p mimic and negative control; (B) CCK-8 assay was performed to assess cell proliferation; (C) Wound-healing assay was conducted to explore LUAD cell migration.
Analysis of tumor-related phenotypes
The miRNA-mRNA regulation pairs correlated with mRNA synthesis pathways, such as transport of the SLBP dependent mature mRNA (Figure 8A). Therefore, we further analyzed the correlation between miRNA-mRNA regulation pairs and immune cells, and explored its role in tumor immunity. There are 19 different types of immune cells between tumor tissue and normal tissue, as shown in Supplementary Table 2. MiR-1-3p and CENPF correlated with macrophages m0, mast cells resting, and dendritic cells resting, etc. while miR-126-5p and UGT8 were related to plasma cells (Figure 8B). As shown in Figure 8C, miR-1-3p and CENPF have some correlation with TMB and tumor microenvironment, but not with DNA methylation.
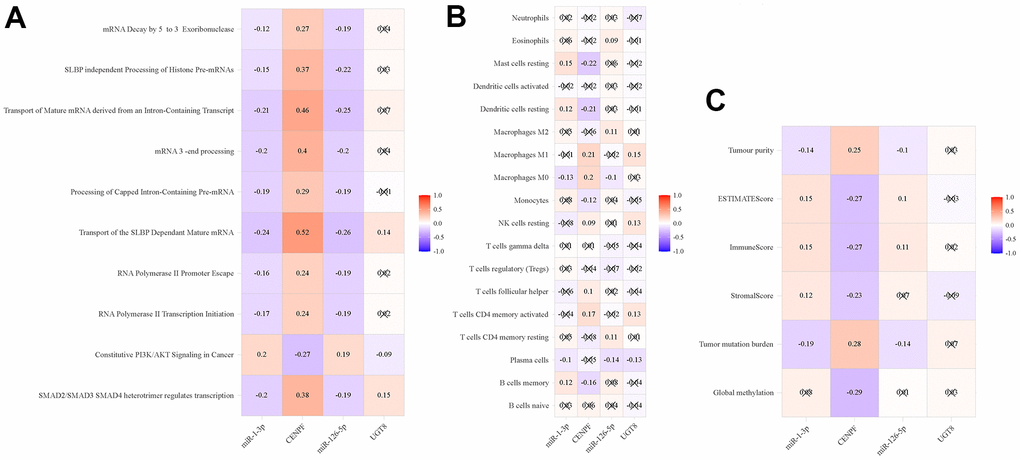
Figure 8. Pearson’s correlation analysis of immune-related phenotypes and regulatory pairs in TCGA-LUAD. (A) ssGSEA; (B) Immune cells; (C) Global methylation, tumor mutation burden and tumor microenvironment factors.
Discussion
In the past few years, many studies have suggested that changes in the expression levels of miRNA and mRNA are closely related to cancers [20–22]. The research aims to construct potential miRNA-mRNA regulatory pairs in LUAD. Firstly, we selected qualified datasets from the GEO database and determined 7 miRNA and 13 mRNA datasets. Expression profiles in the GEO datasets and TCGA database were analyzed using GEO2R, “R-limma” and “R-edgeR” tools to screen for DE-miRNA and DE-mRNA. 11 DE-miRNAs (6 upregulated and 5 down-regulated miRNAs) and 270 DE-mRNAs (30 upregulated and 98 down-regulated mRNAs) showed consistent differential expression in the TCGA database and 7 miRNA and 13 mRNA datasets of the GEO database. The verified pairs were screened from miRTarBase and TarBase database, and Pearson correlation analysis was performed on TCGA-LUAD to screen out 4 miRNA-mRNA regulatory pairs. We further verified the expression levels of 4 pairs in 30 pairs of FFPE lung tissues by qRT-PCR. Finally, the pairs of miR-1-3p-CENPF and miR-126-5p-UGT8 were verified.
In this study, miR-1-3p was low expressed in LUAD tissues and was different in different genders. Studies have shown that miR-1-3p is significantly down-regulated in human LUAD tissues and acts as a suppressor in LUAD cells [23, 24]. Overexpression of CENPF has been reported to have poor prognosis and metastasis of breast cancer, lung adenocarcinoma and prostate cancer [15, 25, 26]. In the research, the expression of CENPF was higher in LUAD tissues and higher in late-stage (II+III+IV) compared with early-stage (I). Patients with higher CENPF expression had worse prognosis. Our study found that miR-126-5p was lower while UGT8 was higher in LUAD tissue. miR-126-5p plays an important role in regulating apoptosis, invasion, migration and EMT of NSCLC cells [27]. A previous study reported that UGT8 is a molecular marker associated with lung cancer metastasis [28].
The correlation analysis between ssGSEA and miRNA-mRNA regulation pairs indicated that these two miRNA-mRNA regulation pairs were related to the synthesis and processing of RNA and mRNA. MiR-1-3p targeting CENPF affects the tumor microenvironment through infiltrating interactions with tumor-associated inflammation, macrophages, mast cells, dendritic cells, and B cells. Therefore, CENPF has an important relationship with tumor immunity.
KRAS, ROS1, ALK, and EGFR are the main biomarkers affecting clinical practice of lung cancer [29–31]. KRAS mutations are present in 30% of lung adenocarcinomas and lead to activation of the Ras-Raf-MEK-ERK signaling pathway, making it an attractive target for small molecule inhibition in KRAS mutant NSCLC [32]. ROS-1 chromosomal rearrangement defines novel genomic driver in 1-2.5% of NSCLC patients [33]. The product of EML4-ALK is detected in 3–6% of unselected NSCLC [34, 35]. In this study, we discovered that miR-1-3p is down-regulated in KRAS, ROS1, and ALK mutation cases while CENPF is up-regulated in ROS1 and ALK mutation cases. EGFR may be involved in the progression of NSCLC by regulating various biological processes [36]. In the study, the expression of CENPF is down- regulated in EGFR mutation cases. Further study will continue to explore the potential role of miR-1-3p and CENPF in monitoring KRAS, ROS1, ALK and EGFR treatment effectiveness.
Although the regulation of miRNA-mRNA involved in LUAD was comprehensively analyzed and experimentally verified in this study, there are still some deficiencies in this study, such as lack of studies and insufficient sample size on the mechanism of DE-miRNAs and DE-mRNAs. More researches are needed to address these questions.
Conclusions
In summary, we have constructed two miRNA-mRNA regulatory pairs that may be involved in the pathogenesis of LUAD. In the future, it is possible to help the treatment and prognosis of LUAD by targeting the established miRNA-mRNA regulatory pairs.
Abbreviations
miRNA: microRNA; LUAD: Lung Adenocarcinoma; GEO: gene expression omnibus; TCGA: the cancer genome atlas; qRT-PCR: Quantitative Reverse Transcription-Polymerase Chain Reaction; ROC: receiver operating characteristic curve; DCA: decision curve analysis; DE-miRNAs: differential miRNAs; DE-mRNAs: differential mRNAs; dbDEMC: database of Differentially Expressed MiRNAs in human Cancers; GO: Gene Ontology; KEGG: Kyoto Encyclopedia of Genes Genomes; ssGSEA: Single sample gene set Enrichment analysis; ESTIMATE: Estimation of STromal and Immune cells in MAlignant Tumour tissues using Expression data; TMB: tumor mutation burden; AUC: Area Under Curve; CI: confidence interval; NSCLC: non-small cell lung cancer.
Author Contributions
Conception: Z.W, and Z.J; Interpretation or analysis of data: Z.J, F.X.C, and Z.X; Preparation of the manuscript: F.X.C, Z.X, and L.C; Experimental verification: F.X.C; Revision for important intellectual content: F.X.C, Z.X, and L.C; Supervision: P.S and Z.S.Y.
Conflicts of Interest
The authors report no conflicts of interest in this work.
Ethical Statement and Consent
The study was conducted in accordance with the guidelines of the Hospital Ethics Committee and approved by the Institutional Review Boards of the First Affiliated Hospital of Nanjing Medical University (ID: 2016-SRFA-148). This study was conducted in accordance with the Declaration of Helsinki. All specimens were collected with informed written consent of patients.
Funding
This work was supported by the Natural Science Foundation of China [Grant number: 81672400] and the Graduate Research and Practice innovation Plan of Graduate Education Innovation Project in Jiangsu Province [Grant number: JX10213729].
Editorial Note
This corresponding author has a verified history of publications using a personal email address for correspondence.
References
- 1. Bray F, Ferlay J, Soerjomataram I, Siegel RL, Torre LA, Jemal A. Global cancer statistics 2018: GLOBOCAN estimates of incidence and mortality worldwide for 36 cancers in 185 countries. CA Cancer J Clin. 2018; 68:394–424. https://doi.org/10.3322/caac.21492 [PubMed]
- 2. Fowler H, Minicozzi P, Luque-Fernandez MA, Rachet B. The Role of Comorbidities in the Social Gradient in Cancer Survival in Europe. In: Launoy G, Zadnik V and Coleman MP, eds. Social Environment and Cancer in Europe: Towards an Evidence-Based Public Health Policy. (Cham: Springer International Publishing). 2021; 261–86. https://doi.org/10.1007/978-3-030-69329-9_18
- 3. Shi J, Hua X, Zhu B, Ravichandran S, Wang M, Nguyen C, Brodie SA, Palleschi A, Alloisio M, Pariscenti G, Jones K, Zhou W, Bouk AJ, et al. Somatic Genomics and Clinical Features of Lung Adenocarcinoma: A Retrospective Study. PLoS Med. 2016; 13:e1002162. https://doi.org/10.1371/journal.pmed.1002162 [PubMed]
- 4. Du Y, Liu M, Gao J, Li Z. Aberrant microRNAs expression patterns in pancreatic cancer and their clinical translation. Cancer Biother Radiopharm. 2013; 28:361–9. https://doi.org/10.1089/cbr.2012.1389 [PubMed]
- 5. Ma MZ, Kong X, Weng MZ, Cheng K, Gong W, Quan ZW, Peng CH. Candidate microRNA biomarkers of pancreatic ductal adenocarcinoma: meta-analysis, experimental validation and clinical significance. J Exp Clin Cancer Res. 2013; 32:71. https://doi.org/10.1186/1756-9966-32-71 [PubMed]
- 6. Bartel DP. MicroRNAs: target recognition and regulatory functions. Cell. 2009; 136:215–33. https://doi.org/10.1016/j.cell.2009.01.002 [PubMed]
- 7. Fabian MR, Sonenberg N, Filipowicz W. Regulation of mRNA translation and stability by microRNAs. Annu Rev Biochem. 2010; 79:351–79. https://doi.org/10.1146/annurev-biochem-060308-103103 [PubMed]
- 8. Lou W, Liu J, Ding B, Chen D, Xu L, Ding J, Jiang D, Zhou L, Zheng S, Fan W. Identification of potential miRNA-mRNA regulatory network contributing to pathogenesis of HBV-related HCC. J Transl Med. 2019; 17:7. https://doi.org/10.1186/s12967-018-1761-7 [PubMed]
- 9. Pham VV, Zhang J, Liu L, Truong B, Xu T, Nguyen TT, Li J, Le TD. Identifying miRNA-mRNA regulatory relationships in breast cancer with invariant causal prediction. BMC Bioinformatics. 2019; 20:143. https://doi.org/10.1186/s12859-019-2668-x [PubMed]
- 10. Jevšinek Skok D, Hauptman N, Boštjančič E, Zidar N. The integrative knowledge base for miRNA-mRNA expression in colorectal cancer. Sci Rep. 2019; 9:18065. https://doi.org/10.1038/s41598-019-54358-w [PubMed]
- 11. Karagkouni D, Paraskevopoulou MD, Chatzopoulos S, Vlachos IS, Tastsoglou S, Kanellos I, Papadimitriou D, Kavakiotis I, Maniou S, Skoufos G, Vergoulis T, Dalamagas T, Hatzigeorgiou AG. DIANA-TarBase v8: a decade-long collection of experimentally supported miRNA-gene interactions. Nucleic Acids Res. 2018; 46:D239–45. https://doi.org/10.1093/nar/gkx1141 [PubMed]
- 12. Chou CH, Shrestha S, Yang CD, Chang NW, Lin YL, Liao KW, Huang WC, Sun TH, Tu SJ, Lee WH, Chiew MY, Tai CS, Wei TY, et al. miRTarBase update 2018: a resource for experimentally validated microRNA-target interactions. Nucleic Acids Res. 2018; 46:D296–302. https://doi.org/10.1093/nar/gkx1067 [PubMed]
- 13. Vlachos IS, Zagganas K, Paraskevopoulou MD, Georgakilas G, Karagkouni D, Vergoulis T, Dalamagas T, Hatzigeorgiou AG. DIANA-miRPath v3.0: deciphering microRNA function with experimental support. Nucleic Acids Res. 2015; 43:W460–6. https://doi.org/10.1093/nar/gkv403 [PubMed]
- 14. Livak KJ, Schmittgen TD. Analysis of relative gene expression data using real-time quantitative PCR and the 2(-Delta Delta C(T)) Method. Methods. 2001; 25:402–8. https://doi.org/10.1006/meth.2001.1262 [PubMed]
- 15. Xiao B, Liu L, Li A, Xiang C, Wang P, Li H, Xiao T. Identification and Verification of Immune-Related Gene Prognostic Signature Based on ssGSEA for Osteosarcoma. Front Oncol. 2020; 10:607622. https://doi.org/10.3389/fonc.2020.607622 [PubMed]
- 16. Hoadley KA, Yau C, Hinoue T, Wolf DM, Lazar AJ, Drill E, Shen R, Taylor AM, Cherniack AD, Thorsson V, Akbani R, Bowlby R, Wong CK, et al, and Cancer Genome Atlas Network. Cell-of-Origin Patterns Dominate the Molecular Classification of 10,000 Tumors from 33 Types of Cancer. Cell. 2018; 173:291–304.e6. https://doi.org/10.1016/j.cell.2018.03.022 [PubMed]
- 17. Chen B, Khodadoust MS, Liu CL, Newman AM, Alizadeh AA. Profiling Tumor Infiltrating Immune Cells with CIBERSORT. Methods Mol Biol. 2018; 1711:243–59. https://doi.org/10.1007/978-1-4939-7493-1_12 [PubMed]
- 18. Yoshihara K, Shahmoradgoli M, Martínez E, Vegesna R, Kim H, Torres-Garcia W, Treviño V, Shen H, Laird PW, Levine DA, Carter SL, Getz G, Stemke-Hale K, et al. Inferring tumour purity and stromal and immune cell admixture from expression data. Nat Commun. 2013; 4:2612. https://doi.org/10.1038/ncomms3612 [PubMed]
- 19. Shao C, Li G, Huang L, Pruitt S, Castellanos E, Frampton G, Carson KR, Snow T, Singal G, Fabrizio D, Alexander BM, Jin F, Zhou W. Prevalence of High Tumor Mutational Burden and Association With Survival in Patients With Less Common Solid Tumors. JAMA Netw Open. 2020; 3:e2025109. https://doi.org/10.1001/jamanetworkopen.2020.25109 [PubMed]
- 20. Jiang N, Zou C, Zhu Y, Luo Y, Chen L, Lei Y, Tang K, Sun Y, Zhang W, Li S, He Q, Zhou J, Chen Y, et al. HIF-1α-regulated miR-1275 maintains stem cell-like phenotypes and promotes the progression of LUAD by simultaneously activating Wnt/β-catenin and Notch signaling. Theranostics. 2020; 10:2553–70. https://doi.org/10.7150/thno.41120 [PubMed]
- 21. Wang X, Xiao H, Wu D, Zhang D, Zhang Z. miR-335-5p Regulates Cell Cycle and Metastasis in Lung Adenocarcinoma by Targeting CCNB2. Onco Targets Ther. 2020; 13:6255–63. https://doi.org/10.2147/OTT.S245136 [PubMed]
- 22. Li W, Pan T, Jiang W, Zhao H. HCG18/miR-34a-5p/HMMR axis accelerates the progression of lung adenocarcinoma. Biomed Pharmacother. 2020; 129:110217. https://doi.org/10.1016/j.biopha.2020.110217 [PubMed]
- 23. Li T, Wang X, Jing L, Li Y. MiR-1-3p Inhibits Lung Adenocarcinoma Cell Tumorigenesis via Targeting Protein Regulator of Cytokinesis 1. Front Oncol. 2019; 9:120. https://doi.org/10.3389/fonc.2019.00120 [PubMed]
- 24. Miao H, Zeng Q, Xu S, Chen Z. miR-1-3p/CELSR3 Participates in Regulating Malignant Phenotypes of Lung Adenocarcinoma Cells. Curr Gene Ther. 2021; 21:304–12. https://doi.org/10.2174/1566523221666210617160611 [PubMed]
- 25. Sun J, Huang J, Lan J, Zhou K, Gao Y, Song Z, Deng Y, Liu L, Dong Y, Liu X. Overexpression of CENPF correlates with poor prognosis and tumor bone metastasis in breast cancer. Cancer Cell Int. 2019; 19:264. https://doi.org/10.1186/s12935-019-0986-8 [PubMed]
- 26. Lin SC, Kao CY, Lee HJ, Creighton CJ, Ittmann MM, Tsai SJ, Tsai SY, Tsai MJ. Dysregulation of miRNAs-COUP-TFII-FOXM1-CENPF axis contributes to the metastasis of prostate cancer. Nat Commun. 2016; 7:11418. https://doi.org/10.1038/ncomms11418 [PubMed]
- 27. Guo R, Hu T, Liu Y, He Y, Cao Y. Long non-coding RNA PRNCR1 modulates non-small cell lung cancer cell proliferation, apoptosis, migration, invasion, and EMT through PRNCR1/miR-126-5p/MTDH axis. Biosci Rep. 2020; 40:BSR20193153. https://doi.org/10.1042/BSR20193153 [PubMed]
- 28. Dzięgiel P, Owczarek T, Plazuk E, Gomułkiewicz A, Majchrzak M, Podhorska-Okołów M, Driouch K, Lidereau R, Ugorski M. Ceramide galactosyltransferase (UGT8) is a molecular marker of breast cancer malignancy and lung metastases. Br J Cancer. 2010; 103:524–31. https://doi.org/10.1038/sj.bjc.6605750 [PubMed]
- 29. Sun W, Yuan X, Tian Y, Wu H, Xu H, Hu G, Wu K. Non-invasive approaches to monitor EGFR-TKI treatment in non-small-cell lung cancer. J Hematol Oncol. 2015; 8:95. https://doi.org/10.1186/s13045-015-0193-6 [PubMed]
- 30. Slebos RJ, Kibbelaar RE, Dalesio O, Kooistra A, Stam J, Meijer CJ, Wagenaar SS, Vanderschueren RG, van Zandwijk N, Mooi WJ. K-ras oncogene activation as a prognostic marker in adenocarcinoma of the lung. N Engl J Med. 1990; 323:561–5. https://doi.org/10.1056/NEJM199008303230902 [PubMed]
- 31. Bergethon K, Shaw AT, Ou SH, Katayama R, Lovly CM, McDonald NT, Massion PP, Siwak-Tapp C, Gonzalez A, Fang R, Mark EJ, Batten JM, Chen H, et al. ROS1 rearrangements define a unique molecular class of lung cancers. J Clin Oncol. 2012; 30:863–70. https://doi.org/10.1200/JCO.2011.35.6345 [PubMed]
- 32. Hoshino R, Chatani Y, Yamori T, Tsuruo T, Oka H, Yoshida O, Shimada Y, Ari-i S, Wada H, Fujimoto J, Kohno M. Constitutive activation of the 41-/43-kDa mitogen-activated protein kinase signaling pathway in human tumors. Oncogene. 1999; 18:813–22. https://doi.org/10.1038/sj.onc.1202367 [PubMed]
- 33. Kim HR, Lim SM, Kim HJ, Hwang SK, Park JK, Shin E, Bae MK, Ou SH, Wang J, Jewell SS, Kang DR, Soo RA, Haack H, et al. The frequency and impact of ROS1 rearrangement on clinical outcomes in never smokers with lung adenocarcinoma. Ann Oncol. 2013; 24:2364–70. https://doi.org/10.1093/annonc/mdt220 [PubMed]
- 34. Kwak EL, Bang YJ, Camidge DR, Shaw AT, Solomon B, Maki RG, Ou SH, Dezube BJ, Jänne PA, Costa DB, Varella-Garcia M, Kim WH, Lynch TJ, et al. Anaplastic lymphoma kinase inhibition in non-small-cell lung cancer. N Engl J Med. 2010; 363:1693–703. https://doi.org/10.1056/NEJMoa1006448 [PubMed]
- 35. Shaw AT, Yeap BY, Mino-Kenudson M, Digumarthy SR, Costa DB, Heist RS, Solomon B, Stubbs H, Admane S, McDermott U, Settleman J, Kobayashi S, Mark EJ, et al. Clinical features and outcome of patients with non-small-cell lung cancer who harbor EML4-ALK. J Clin Oncol. 2009; 27:4247–53. https://doi.org/10.1200/JCO.2009.22.6993 [PubMed]
- 36. Wang F, Chan LW, Law HK, Cho WC, Tang P, Yu J, Shyu CR, Wong SC, Yip SP, Yung BY. Exploring microRNA-mediated alteration of EGFR signaling pathway in non-small cell lung cancer using an mRNA:miRNA regression model supported by target prediction databases. Genomics. 2014; 104:504–11. https://doi.org/10.1016/j.ygeno.2014.09.004 [PubMed]