


This article has been corrected: The authors found that Figure 5 contains the same graph panel for “Cell apoptosis (%)” in Figures 5D and 5E. They replaced incorrect graph in Figure 5E with the panel corresponding to the wound healing assay graph measuring “Relative migration level (%)” from the original sets of experiments. This correction has no impact on the experimental outcome or conclusions.
Corrected Figure 5 is presented below.
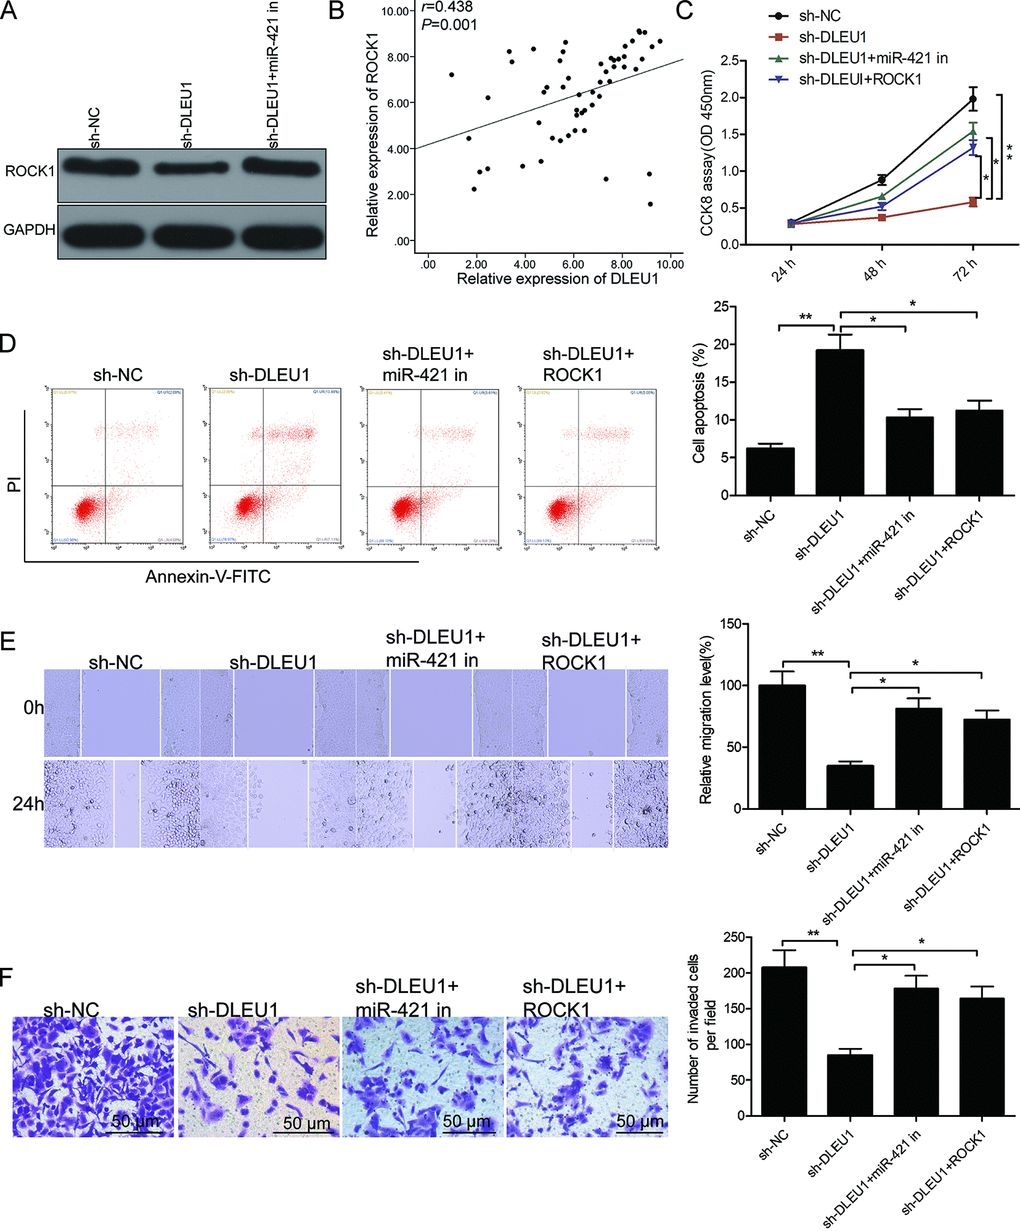
Figure 5. DLEU1 regulates PTC cell growth and progression through the miR-421/ROCK1 axis. (A) Western blot analysis shows ROCK1 protein levels in sh-NC-, sh-DLEU1- and sh-DLEU1 plus miR-421 inhibitor-transfected TPC-1 cells. (B) Spearman correlation analysis shows that ROCK1 mRNA expression is inversely related to DLEU1 expression in PTC tissues (n=54). (C) CCK-8 assay analysis shows proliferation rates of TPC-1 cells transfected with sh-NC, sh-DLEU1, sh-DLEU1 plus miR-421 inhibitor, and sh-DLEU1 plus ROCK1 overexpression plasmid. (D) Flow cytometry analysis shows percentage apoptosis (% Annexin-V+ cells) in TPC-1 cells transfected with sh-NC, sh-DLEU1, sh-DLEU1 plus miR-421 inhibitor, and sh-DLEU1 plus ROCK1 overexpression plasmid. (E) Wound healing assay results show the numbers of migrating cells in the TPC-1 cells transfected with sh-NC, sh-DLEU1, sh-DLEU1 plus miR-421 inhibitor, and sh-DLEU1 plus ROCK1 overexpression plasmid. (F) Transwell invasion assay results show the numbers of invading cells in the TPC-1 cells transfected with sh-NC, sh-DLEU1, sh-DLEU1 plus miR-421 inhibitor, and sh-DLEU1 plus ROCK1 overexpression plasmid. Note: The data is represented as the means ± SD of at least three independent experiments. *P< 0.05 and **P< 0.01.