


Introduction
Age-related macular degeneration (AMD), the most common cause of irreversible vision loss amongst people over 50 years old in developed countries [1, 2], is characterised by RPE degeneration and photoreceptor cell death. The RPE is critical to retinal homeostasis and some important roles include phagocytosis of photoreceptor outer segments, scavenging for damaged reactive oxygen species (ROS), and delivery of blood-derived nutrients to photoreceptors [3, 4]. Emerging evidence in recent years suggests that oxidative stress-induced mitochondrial damage in the RPE contributes to development of AMD [5–7].
Genome-wide association studies (GWAS) have contributed to our understanding of genetic associations to AMD and identified >60 single nucleotide polymorphisms (SNPs) implicated in AMD [8–10]. This included CFH and ARMS2/HTRA1 loci that confer major susceptibility [11–13], which may affect the metabolomics in RPE cells [14]. In addition, other genomic methods have been developed to complement GWAS in identifying and confirming variants associated with diseases, such as expression quantitative trait loci (eQTL), transcriptome-wide association study (TWAS), and eCAVIAR [10, 15–17]. These techniques integrate genomic and transcriptomic data sets to confirm whether causal genes found in GWAS studies are driving disease association (reviewed in [18]). In particular, using eQTL and TWAS, a recent study highlighted POLDIP2 at the TMEM97/VTN loci as a significant target gene associated with AMD [15]. However, the function of POLDIP2 in the retina remains poorly understood. Our previous study has shown that POLDIP2 is highly expressed in human RPE/choroid [19]. Unravelling the biological roles of POLDIP2 in RPE is critical to advance our understanding of AMD pathogenesis.
POLDIP2 encodes a multifunctional protein that localises in both the nucleus and the mitochondria [20]. Several studies have identified POLDIP2 as a significant gene for AMD susceptibility [10, 15, 17] and it has been associated with vascular and neurodegenerative diseases [21, 22]. POLDIP2 has been reported to play a role in a wide range of physiological and cellular processes [20]. Previous mouse studies showed that homozygous Poldip2 knockout was embryonic lethal, Poldip2-/- embryos were significantly smaller than WT, and mouse embryonic fibroblasts (MEFs) exhibited reduced growth [23]. In addition, heterozygous knockout mice displayed lower levels of H2O2 production, which increased aortic extracellular matrix, increased vascular stiffness and impaired contractility, thus demonstrating that Poldip2 expression is necessary for vascular structure and function [24]. Poldip2 has also been shown to be an oxygen-sensitive protein and regulates cell metabolism and mitochondrial function [25]. Poldip2 expression is downregulated by hypoxia and in cancer cells, leading to repression of lipoylation of the pyruvate and α-ketoglutarate dehydrogenase complexes and mitochondrial dysfunction. Interestingly, POLDIP2 dysfunction has been implicated in Alzheimer’s disease, including metabolic and oxidative stress, neuroinflammation, as well as abnormal microvasculature and extracellular deposits [26, 27]. Overexpression of POLDIP2 resulted in defective autophagy leading to increased Tau aggregation, whereas POLDIP2 downregulation decreased ROS-induced Tau aggregation [22]. However, there is no previous study on the function of POLDIP2 in the retina and its role in the development of AMD.
Recent advances in CRISPR technology offer exciting opportunities to manipulate genes and accelerate functional studies of AMD-associated genes. The combined use of Cas9 endonuclease and a single-stranded guide RNA (sgRNA) can target and cleave specific DNA sequences, thereby creating a double-stranded break and deletions (indels) to knockout genes [28]. Alternatively, a catalytically inactive Cas9 (dead Cas9, dCas9) can be coupled with a transcriptional repressor domain, such as Krupper-associate box (KRAB), to repress the expression of a target gene, termed CRISPR interference (CRISPRi) [29]. Together, these CRISPR/Cas9 systems provide useful tools to perform loss-of-function studies of AMD-associated genes in the RPE.
Using CRISPR/Cas9, here we report the generation of a human RPE cell line ARPE-19 with POLDIP2 knockout. We showed that POLDIP2 knockout resulted in upregulation in SOD2 levels and decreased levels of mitochondrial superoxide. Also, our results highlighted the effect of POLDIP2 loss on the transcriptome profile of RPE, and discovered upregulation of genetic signals related to immune response, oxidative damage and vascular development.
Results
Evaluation of CRISPRi and CRISPR knockout of POLDIP2 in ARPE-19
We first tested the use of CRISPRi to knockdown POLDIP2 in ARPE-19, using an ARPE-19 cell line with stable expression of dCas9-KRAB we reported previously (ARPE-19-KRAB) [19]. To induce knockdown of POLDIP2 expression, we designed 2 sgRNAs that target the proximity of the transcription start site (TSS) of the POLDIP2 gene (Supplementary Figure 1, Supplementary Table 1). We transfected 2 different doses of sgRNAs, 360ng and 1000ng, into ARPE-19-KRAB. The efficiency of the 2 sgRNAs in knocking down POLDIP2 expression was assessed using RT-qPCR. The results showed that sgRNA1 could not knockdown POLDIP2 (360ng: 1.15±0.12 fold compared to mock; 1000ng: 1.15 fold compared to mock, Supplementary Figure 2), whereas sgRNA2 could repress POLDIP2 expression level by ~24% (360ng: 0.77±0.05 fold compared to 1000ng: 0.76±0.15 fold compared to mock, Supplementary Figure 2). Since the CRISPRi-mediated knockdown levels observed were mild and likely insufficient for functional studies, next we tested the use of CRISPR/Cas9 to knockout POLDIP2 in ARPE-19.
To induce POLDIP2 knockout, we transduced ARPE-19 with lentiviruses carrying sgRNA targeting the coding sequence of POLDIP2 (Supplementary Figure 1). Following antibiotic selection, we generated a stable ARPE-19 cell line with POLDIP2 knockout (POLDIP2 KO). POLDIP2 KO cells retained similar morphology to ARPE-19 wild type (WT) (Supplementary Figure 4). Critically, Sanger sequencing confirmed the presence of indels at the target site in POLDIP2 CDS (Figure 1A), with a 70% indel percentage in POLDIP2 KO compared to WT (Figure 1B). We analysed the levels of POLDIP2 gene expression using RT-qPCR and found a ~80% reduction of POLDIP2 levels in POLDIP2 KO (0.22±0.01 compared to WT, Figure 1C). Also, western blot analysis showed an absence of POLDIP2 protein expression in POLDIP2 KO samples (Figure 1D). Finally, we performed a short tandem repeat (STR) analysis and confirmed that the knockout cell line originated from the parental ARPE-19 cell line (Supplementary Figure 3) [19]. Collectively, these results showed that we have successfully generated an ARPE-19 cell line with POLDIP2 knockout.
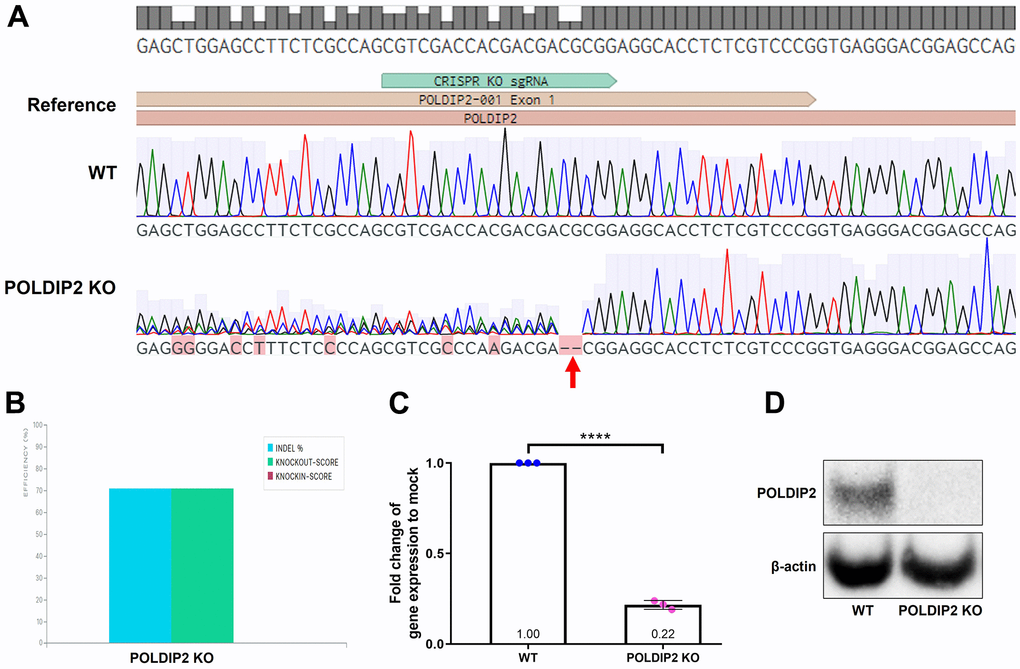
Figure 1. Generation of POLDIP2 KO cell line. (A) Sanger sequencing showed small indels in the coding sequence of POLDIP2 in the POLDIP2 KO cell line, as indicated by the red arrow. (B) Quantification of indel percentage in knockout cell line compared to WT. (C) RT-qPCR analysis of POLDIP2 repression using CRISPR KO. Values expressed as mean ± SEM, n=3. **** p<0.0001. (D) Western blot analysis of POLDIP2 protein repression.
Functional studies of POLDIP2 on ARPE-19 cells
Phagocytosis is an important function of RPE to degrade ROS and maintain retinal homeostasis. Using POLDIP2 KO, we assessed the effect of POLDIP2 on RPE phagocytosis. WT and POLDIP2 KO cells were incubated with FITC fluospheres and their phagocytosis ability was analysed by quantification of FITC+ cells using flow cytometry. Our results showed that the POLDIP2 KO cell line retained the ability to phagocytose FluoSpheres (Figure 2A). The proportion of FITC+ in POLDIP2 KO cells was 34.53±3.19%, compared to 34.27±1.12% in WT, which suggested the levels of phagocytosis between WT and POLDIP2 KO cells were similar (Figure 2B). Our results demonstrated that POLDIP2 knockout did not affect the phagocytic ability of ARPE-19 cells.
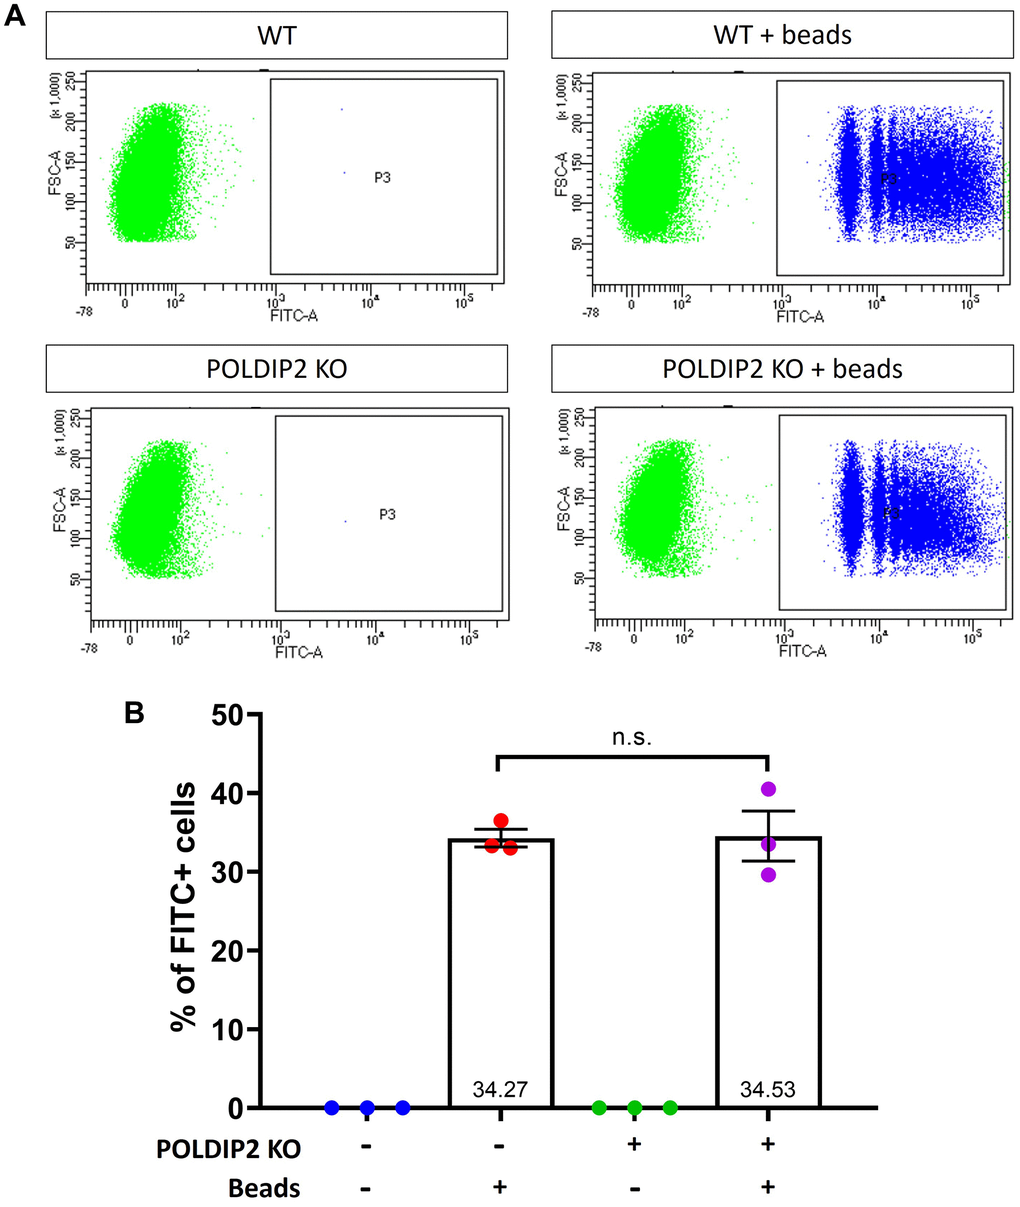
Figure 2. POLDIP2 KO cells show normal levels of phagocytosis. (A) Flow cytometry analysis of phagocytosis in WT and POLDIP2 KO treated with or without FITC+ fluospheres. (B) Pooled quantification results of n=3 biological repeats. Error bars represent SEM. n.s. not significant.
Next, we investigated whether loss of POLDIP2 would affect proliferation of ARPE-19. We showed that the POLDIP2 KO cell line showed a comparable growth rate to WT (POLDIP2 KO: R2=0.87; slope=3.47; WT: R2=0.87; slope=2.89, Figure 3A). Overall, our results showed that the effect of POLDIP2 loss on cell proliferation is negligible in ARPE19.
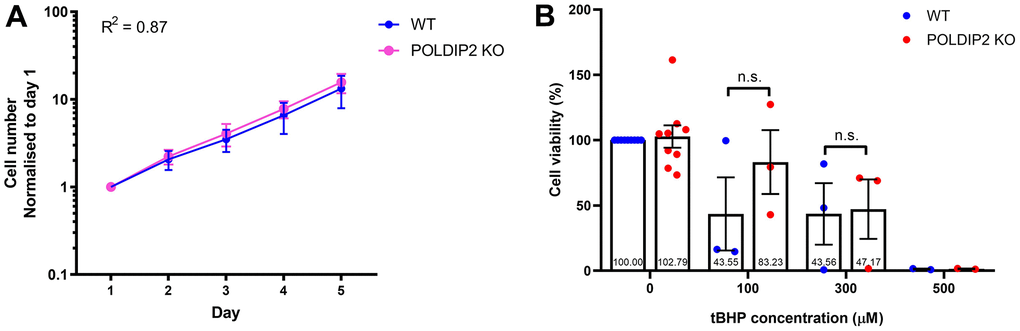
Figure 3. Knockout of POLDIP2 in ARPE-19 shows normal levels of cell proliferation and viability. (A) Cell proliferation of WT and POLDIP2 KO cell lines. Normalised cell numbers expressed as mean ± SEM, n=3. (B) Cell viability analysis of WT and POLDIP2 KO cell lines in the presence or absence of tBHP. Results are presented as mean ± SEM of 2-9 biological repeats, each with 8 technical repeats.
Oxidative stress plays an important role in AMD pathogenesis and progression [30]. RPE has a high metabolic demand and thus mitochondria are a major source of ROS in the RPE. As a result, age-related mitochondrial dysfunction can induce oxidative stress in the RPE and contributes to AMD [31]. We assessed if POLDIP2 knockout would affect cell viability of ARPE-19 in the presence of oxidative stress. To induce oxidative stress, we exposed the cells to tert-Butyl hydroperoxide (tBHP), a potent ROS-inducer commonly used to induce oxidative stress in cells and tissues. We then assessed cell viability of ARPE-19 treated with varying concentrations of tBHP. Our results showed that in the absence of tBHP, POLDIP2 KO cells showed a high level of cell viability and this level was comparable to WT (KO: 102.79±8.60% compared to WT, Figure 3B), which indicates that the loss of POLDIP2 did not affect cell viability. Following treatment with 100μM of tBHP, POLDIP2 KO cells exhibited higher cell viability compared to WT (83.23±24.42% and 43.55±28.04% viability, respectively), albeit this difference is not statistically significant. 300μM of tBHP caused similar levels of cell death in POLDIP2 KO and WT cells (47.17±22,76% and 43.56±23.51% viability, respectively), while 500μM of tBHP killed most of the cells in POLDIP2 KO and WT (1.48±0.31% and 1.23±0.40% viability, respectively). Overall, our results showed that POLDIP2 knockout did not significantly affect cell viability in the presence of oxidative stresses.
Induction of RPE autophagy has been considered as a therapeutic approach for AMD [32]. In this regard, a previous study showed that POLDIP2 knockout increased autophagy in mouse embryonic fibroblasts [23]. Thus, we also investigated the role of POLDIP2 in autophagy in ARPE-19 cells. We analysed LC3B levels as an indicator of autophagic flux [33] (Figure 4A). In the presence of lysosomal protease inhibitors pepstatin and E64d controls, which partially inhibit degradation of LC3B-II, LC3B-II levels increased in both WT (4.22±0.83 fold compared to mock, Figure 4B) and POLDIP2 KO samples (2.70±0.82 fold compared to mock). In basal condition, our results showed that LC3B-II levels in POLDIP2 KO cells were slightly higher than in WT (1.40±0.31 compared to WT, Figure 4B), albeit this difference is statistically insignificant. Similarly, LC3B-II/total LC3B ratio in POLDIP2 KO cells was slightly lower than in WT (0.80±0.07 compared to WT, Figure 4C), however this difference is also not statistically significant. Altogether, our results indicated that POLDIP2 knockout did not significantly alter autophagic flux in ARPE-19.
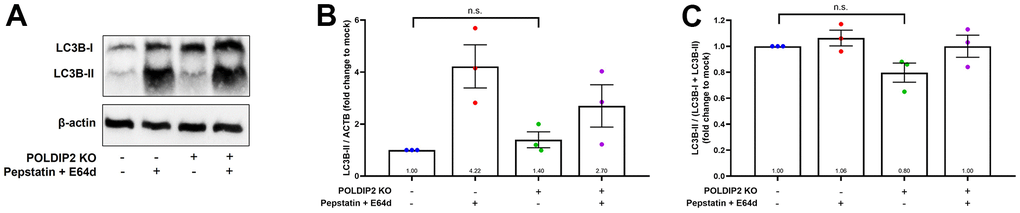
Figure 4. Knockout of POLDIP2 did not significantly alter autophagy in ARPE-19. (A) Western blot analysis of LC3B protein levels in WT and POLDIP2 KO samples. E64d and pepstatin A protease inhibitors (10 mg/ml each) were added where indicated. β-actin served as a loading control. (B) Quantification of the ratio of LC3B-II to β-actin. Values expressed as mean ± SEM, n=3 biological repeats. n.s. not significant. (C) Quantification of the ratio of LC3B-II/(LC3B-I + LC3B+II). Values expressed as mean ± SEM, n=3 biological repeats. n.s. not significant.
Transcriptome profiling of WT versus POLDIP2 KO cell lines
To investigate the impact of POLDIP2 knockout on the RPE transcriptome profile, we performed RNA-seq on WT and POLDIP2 KO cell lines. Our results showed 93 upregulated genes and 203 downregulated genes in POLDIP2 KO compared to WT (Supplementary Data 1). Figure 5A illustrated the top 50 differentially expressed (DE) genes between POLDIP2 KO and WT. We compared the expression levels of four RPE markers BEST1, PMEL, RDH5, and RDH10 between the two cell lines (Figure 5B). Notably, the expression levels of all four RPE markers between POLDIP2 KO and WT were similar, indicating that the ARPE-19 retained RPE identity following the loss of POLDIP2.
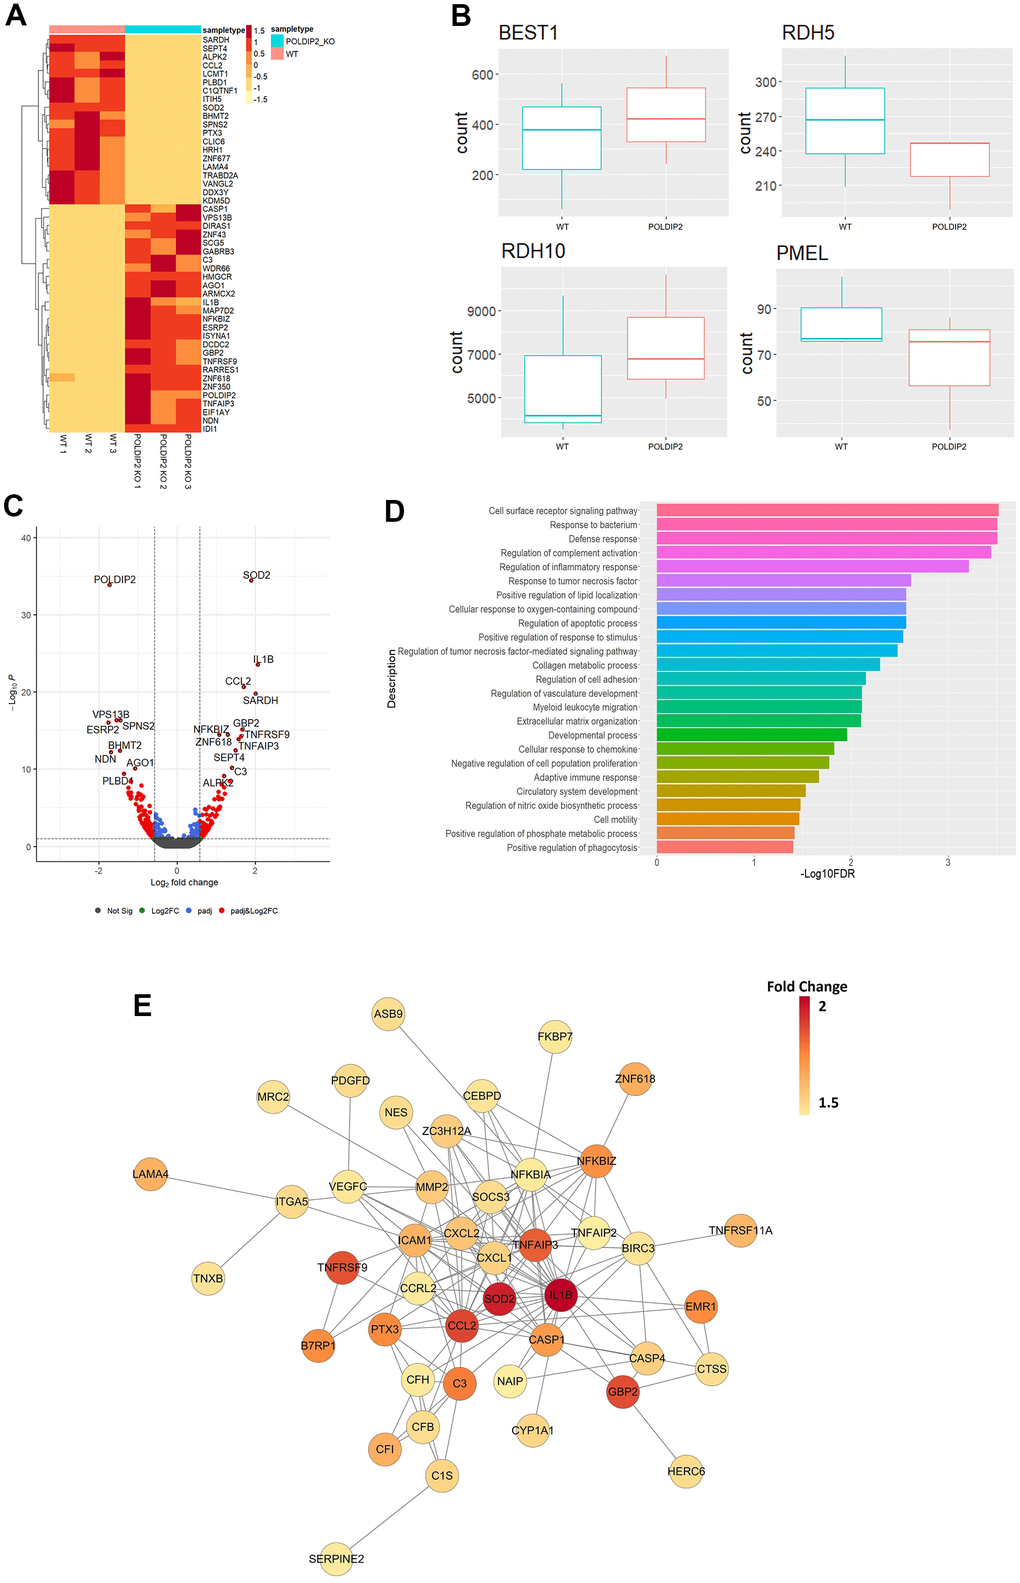
Figure 5. Transcriptome profiling of POLDIP2 knockout in ARPE-19. (A) Heatmap of top 50 DE genes detected in WT (n=3) and POLDIP2 KO (n=3) cell lines. (B) Boxplot of the expression levels of RPE markers BEST1, RDH5, RDH10, and PMEL in different samples. (C) Volcano plot of the top 20 DE genes labelled in POLDIP2 KO cell lines (n=3). (D) GO annotation of the top 50 up-regulated DE genes in POLDIP2 KO samples (n=3). (E) Network topology of the top up-regulated DE genes in POLDIP2 KO samples (n=3).
As expected, we observed that the most down-regulated gene was POLDIP2, which confirms the quality of the knockout cell line (Figure 5C). Interestingly, the most upregulated gene was SOD2 (Figure 5C). SOD2 encodes for a manganese superoxide dismutase (MnSOD), an antioxidant enzyme in the mitochondrial matrix that converts superoxide anion to hydrogen peroxide and protects mitochondria from oxidative stress [34]. Knockdown of SOD2 in RPE of mice induced oxidative damage, which led to morphological abnormalities in RPE and Bruch’s membrane, as well as other changes associated with AMD such as increase in autofluorescence levels and bis-retinoid pigments located in RPE and drusen, and accumulation of oxidatively modified proteins [34]. Other top upregulated genes in POLDIP2 KO included IL-1β, CCL2, SARDH, GBP2, NFKBIZ, TNFRSF9, TNFAIP3, and C3 (Figure 5C), many of them are involved in the immune defense system.
To elucidate the biological roles of the DE genes, we performed gene ontology analysis using the top 50 upregulated DE genes in POLDIP2 KO samples (Figure 5D). Interestingly, loss of POLDIP2 also upregulated several genes involved in the complement system, including C3, IL1B, CFI, CFH, CFB and C1S. Critically, C3, IL1B, CFI, CFH, and CFB have been identified as genes implicated in AMD development [11, 35–38]. In addition, our results highlighted that many upregulated DE genes are involved in the immune response, including chemokines (CCL2, CXCL1, CXCL2), cytokines (IL1B), and genes associated with cytokine-mediated signalling (MMP2, ICAM1, GBP2, SOD2, NFKBIZ), tumour necrosis factor-induced genes (TNFRSF9, TNFAIP3), and caspase cascade in apoptosis (CASP1, CASP4) (Figure 5E). Also, genes involved in vasculature development and homeostasis were upregulated following POLDIP2 loss (LAMA4, VEGFC, SOCS3, and ZC3H12A), as well as those involved in oxidative stress (MMP2, ZC3H12A, SOD2, and TNFAIP3). Furthermore, network topology analysis revealed the inter-connectivity between these DE genes, such as complement system genes (CFB, CFH, C3, C1S, CFI), and caspase cascade genes (CASP1, CASP4) (Figure 5E). Collectively, our results suggested that loss of POLDIP2 affected genes involved in a wide range of biological processes, including various aspects of the immune response such as complement activation, and AMD-related processes such as vasculature development and oxidative damage.
POLDIP2 knockout reduced mitochondrial superoxide in RPE cells
Given the mitochondrial gene SOD2 was the most-upregulated gene in POLDIP2 KO, we further studied the role of POLDIP2 in regulating mitochondrial oxidative stresses and activity. We performed a MitoSox assay to compare the levels of mitochondrial superoxide between WT and POLDIP2 KO cell lines. In the presence of the control N-acetyl-L-cysteine (NAC), which inhibited oxidation, MitoSox fluorescence decreased in WT samples as expected (0.70±0.04 compared to WT, Figure 6A). Interestingly, our analysis showed a significant reduction in mitochondrial superoxide levels in POLDIP2 KO (0.85±0.04 compared to WT, Figure 6A), which is consistent with the elevated expression of SOD2 in POLDIP2 KO cells. In addition, we assessed the mitochondrial membrane potential using tetramethylrhodamine methyl ester (TMRM). Carbonyl cyanide 3-chlorophenylhydrazone (CCCP) was used as a control and reduced mitochondrial membrane potential in WT as expected (0.65±0.06 compared to WT, Figure 6B). Importantly, we observed similar levels of mitochondrial transmembrane potential between WT and POLDIP2 KO cells (POLDIP2 KO: 1.07±0.03 compared to WT, Figure 6B). These results indicate that mitochondrial membrane potential was not affected by the loss of POLDIP2. Altogether, our results identified a novel link of POLDIP2 and SOD2 in regulation of mitochondrial superoxide in RPE cells.
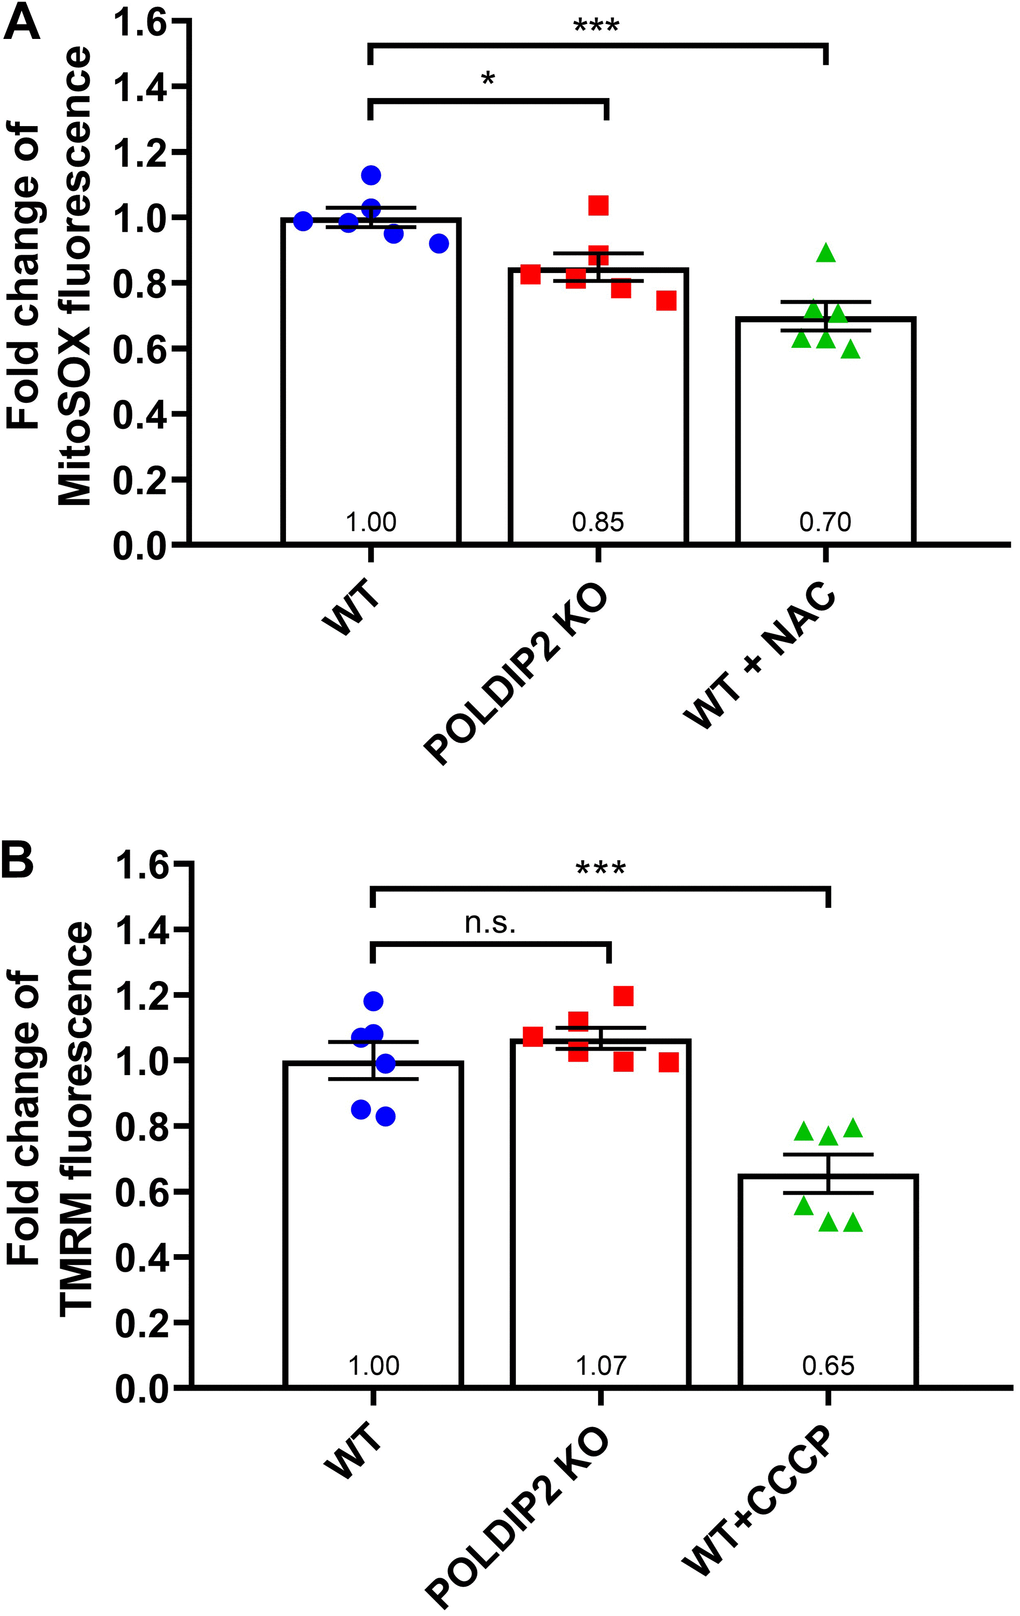
Figure 6. POLDIP2 KO reduced mitochondrial superoxide. (A) Analysis of mitochondrial superoxide levels in WT and POLDIP2 KO samples. MitoSox fluorescence is presented as fold change compared to WT control. N-acetyl-L-cysteine (NAC) was used as a positive control. (B) Analysis of mitochondrial membrane potential in WT and POLDIP2 KO samples. TMRM fluorescence is presented as fold change compared to WT control. Carbonyl cyanide 3-chlorophenylhydrazone (CCCP) was used as a positive control. Results are presented as mean ± SEM of 2 biological repeats, each with 3 technical repeats. n.s. not significant, * p<0.05 and *** p<0.001.
Discussion
Considerable effort has been made to understand the genetic factors that contribute to AMD using retinal cell models. However, there are significant limitations in studying AMD in animal models. For example, many disease-associated signs only develop in aged rodents, which increases the length of research time and subsequently the cost needed to house animals. Moreover, rats and mice do not have a macula and do not develop drusen or drusen-like deposits beneath the RPE [39]. In this sense, non-human primates are more appropriate animal models to study AMD, but are a lot more costly and require rigorous experiment setup [40]. In contrast, in vitro models offer a cheaper and easier alternative to facilitate studies of gene function in the retina. ARPE-19 is commonly used to study retinal cell biology and shows similar features to native RPE cells, such as expression of transporters, barrier formation, and phagocytic ability [41–43]. The present study reports the use of CRISPR for gene knockout in an in vitro human RPE model, as a model to study the function of an AMD-associated gene POLDIP2. Our first attempt to repress POLDIP2 with a CRISPRi system yielded a low knockdown level; further optimisation of sgRNA would be important to improve this knockdown efficiency. Subsequently we moved to a CRISPR KO system and generated a stable ARPE-19 cell line with POLDIP2 knockout, providing an important tool to study the effect of POLDIP2 on biological processes relevant to RPE cells and to AMD pathophysiology.
A previous study showed that Poldip2 affects growth rate and autophagy in MEFs [23]. Poldip2 knockdown markedly reduced growth in MEFs. Further investigations revealed that Poldip2-/- MEFs were arrested or delayed in both G1 and G2/M phases of the cell cycle, and the protein levels of key cell cycle regulators also decreased following Poldip2 knockdown. This study also reported an increase in autophagy following Poldip2 knockout as indicated by higher levels of LC3B-II. However, we observed that loss of POLDIP2 did not affect the growth rate and autophagic flux of ARPE-19 cells, suggesting that POLDIP2 may have specific functions in different cell types.
To further study the roles of POLDIP2, we employed RNA-seq analysis to reveal gene expression changes caused by POLDIP2 loss. We showed that a number of genes related to the immune system were upregulated in the POLDIP2 KO group. For instances, IL-1β was the second most upregulated gene in POLDIP2 KO samples. IL-1β is transcribed following pro-inflammatory stimuli [44] and its expression is increased in the central nervous system in acute and chronic neurodegenerative diseases [45]. In light-challenged mice, a model of dry AMD, subretinal mononuclear phagocytes expressed IL-1β, which induced rod death and cone segment loss [36, 46]. CCL2 is another gene that was highly upregulated in POLDIP2 KO cells. CCL2 is a chemokine that directs leukocyte migration and its expression in RPE and the retina is very low in healthy young adult animals [47], but is elevated with ageing [47], following acute inflammation [48, 49], and oxidative insult in the RPE [50]. GBP2 is a member of the large GTPase superfamily that is strongly induced by interferon-γ (IFN-γ) and its expression in the retina was found to be significantly increased in aged and adult rats compared to young rats [51]. Tumour necrosis factors TNFRSF9 and TNFAIP3 were also upregulated following POLDIP2 knockout. These genes are associated with dendritic cell maturation, among which reduced levels of TNFAIP3 was found to enhance dendritic cell function in patients with AMD [52, 53]. Our analysis also showed increased expression of the complement component C3, which is strongly associated with AMD [35, 54] and has been shown to be interconnected with the expression of VEGF, RPE deterioration, geographic atrophy, and development of choroidal neovascularization [55–57].
Our findings revealed that following tBHP-induced oxidative stress, POLDIP2 knockout did not lead to any remarkable changes to ARPE-19 viability. It has been reported that Poldip2 silencing in MEFs increases cell sensitivity to oxidative stress, as indicated by cell viability assay after H2O2 treatment [58]. While we observed normal cell viability in POLDIP2 KO cells following tBHP-induced oxidative stress in this present study, future studies could look at the effect of POLDIP2 using other oxidative stress assays. Interestingly, we identified a link between POLDIP2 KO and the reduced levels of mitochondrial superoxide. Our results supported that the loss of POLDIP2 upregulated SOD2, which enhanced the conversion of superoxide anion to hydrogen peroxide and resulted in lower superoxide levels in the mitochondria. Previous studies have also demonstrated that POLDIP2 is involved in oxidative signalling through cellular oxidases. Poldip2 has been reported to be an upstream regulator of the NADPH oxidase Nox4 [59, 60], an enzyme functionally linked to proinflammatory responses, oxygen sensing, and senescence. In vascular smooth muscle cells, Poldip2 upregulates endogenous reactive oxygen species via Nox4 and positively regulates basal ROS production [59]. In addition, Poldip2 also mediates oxidative stress and inflammation via interaction with Nox4 in lung epithelial cells and downregulation of Poldip2 leads to decreased production of ROS [60]. It was demonstrated that Poldip2 deficiency protects against lung edema and vascular inflammation through suppressing mitochondrial ROS in a mouse model of acute respiratory distress syndrome [61]. Furthermore, deletion of Sod2 in mice has been shown to disrupt RPE morphology, reduce RPE function, and elevate oxidative stress in RPE [6]. Another study showed that treatment with citicoline can reduce oxidative stress in AMD RPE cybrid cells [62]. These studies support the notion that oxidative stresses regulated by POLDIP2 and SOD2 play a role in RPE dysfunction and progression of AMD.
There are limitations to this study. The current study identified a link between POLDIP2 and SOD2 in one human RPE model only - the ARPE-19. Although ARPE-19 has morphological and functional features of human RPE, there are limitations to its use as a RPE model, including reduced levels of some RPE markers and low transepithelial resistance compared to native RPE [63]. The loss of RPE melanin has been reported in AMD [64], and since ARPE-19 cells do not retain the original pigmented phenotype of the RPE, this hinders an opportunity to study changes in melanin pigment in RPE. Other in vitro RPE models have been reported, including human primary RPE cells, pluripotent stem cells-derived RPE cells (reviewed in [18] and [65]). Future studies using primary RPE cells or pluripotent stem cells-derived RPE would provide a suitable model to further validate the functions of POLDIP2 in human RPE cells. The use of 3D in vitro models, such as retinal organoids derived from pluripotent stem cells, would also provide an interesting opportunity to study the functional role of POLDIP2 in relation to the cellular interaction within the retinal macroenvironment. Moreover, a recent study has generated an improved Poldip2 knockout mouse model [66], further research focusing on the retina of these knockout mice would provide valuable knowledge to understand the role of Poldip2 in retinal development and functions.
In summary, we have generated a POLDIP2 knockout ARPE-19 cell line using CRISPR/Cas9 and studied the biological functions of POLDIP2. To our knowledge, this is the first functional study of POLDIP2 in retinal cells to understand its potential role in AMD. The POLDIP2 KO cell line possesses normal proliferation, phagocytosis, autophagy, sensitivity to oxidative stress-induced cell death and mitochondrial activity. Interestingly, we identified a novel link between POLDIP2 and mitochondrial oxidative stress modulation via SOD2, supporting a potential role for POLDIP2 in AMD pathogenesis. Future studies to investigate the precise mechanism by which POLDIP2 regulates oxidative stress signalling pathways would be important to advance our understanding of AMD genetics.
Materials and Methods
Cell culture
HEK293FT, ARPE-19, ARPE-19-KRAB, and POLDIP2 KO cells were maintained at 37° C and 5% CO2 in a culture medium containing DMEM (Thermo Fisher) supplemented with 10% [v/v] Fetal Bovine Serum (FBS), 2mM GlutaMAX, and 0.5% Penicillin-Streptomycin (all from Thermo Fisher). Cells were passaged before they reached confluency using 0.25% Trypsin-EDTA (Thermo Fisher).
Generation of POLDIP2 knockout ARPE-19 cell line
For construction of a lentiviral vector co-expressing SpCas9 and target sgRNA, the complementary DNA oligos of the sgRNAs targeting POLDIP2 were commercially synthesised (Supplementary Table 1), then phosphorylated and annealed using T4 Ligation Buffer and T4 PNK (NEB) to form the double-stranded DNA using the following thermal parameters: at 37° C for 30 min, and at 95° C for 5 min, followed by decreasing at 5° C/min to 25° C. The lentiviral vector lentiCRISPRv2 (Addgene, #52961) was linearised by BsmBI and dephosphorylated using CIP (NEB). The product was purified by gel electrophoresis and gel extract. The annealed DNA oligos of the sgRNA was ligated to the linearised lentiCRISPRv2 vector by T4 DNA ligase (NEB).
For lentivirus generation, 7x10⁶ HEK293FT cells were seeded in a 10 cm2 dish one day prior to transfection, cultured in Opti-MEM supplemented with 5% FBS and 200 μM sodium pyruvate (all from Thermo Fisher). Lentivirus was generated using the 3rd generation packaging system. The transfer plasmid and three packaging vectors pMDLg/pRRE (Addgene, #12251), pRSV-Rev (Addgene, #12253), and pMD2.G (Addgene, #12259) were transfected into HEK293FT cells using Lipofectamine 3000 (Thermo Fisher). 6 hours after transfection, the medium containing Lipofectamine 3000 was replaced with fresh media. The supernatant containing the virus was collected 48 and 72 hours after transfection, and subsequently filtered (0.45 μm filter, Sartorius) and concentrated using PEG-it precipitation solution (SBI Integrated Sciences) according to the manufacturer's instructions. The viral titre was determined using Lenti-X p24 Rapid Titre Kit (Takara Bio) according to manufacturer’s instructions.
ARPE-19 cells were transduced with the POLDIP2 knockout lentiviruses (MOI=10) overnight, followed by selection with 2μg/ml puromycin 3 days after transduction. Transduced ARPE-19 cells were further expanded to obtain the POLDIP2 KO cell line.
RT-qPCR analysis
RNA extraction was performed using the illustra RNAspin Mini Kit (GE Healthcare Life Sciences) according to manufacturer’s instructions. RNA concentration and quality were measured using NanoDrop. cDNA was synthesised using the High-capacity cDNA reverse transcription kit with RNase inhibitor (Thermo Fisher). RT-qPCR reaction mixture was set up using TaqMan Fast Advanced Master Mix (Thermo Fisher) and Taqman probes for POLDIP2 (Hs00210257_m1) and the housekeeping gene β-actin (Hs99999903_m1) (Thermo Fisher). RT-qPCR was performed on the 7500 Fast or StepOnePlus Real-Time PCR System (Thermo Fisher), following manufacturer’s instructions. The Delta-Delta Ct method was used to calculate and compare relative mRNA levels to control.
Cell proliferation assay
Cell proliferation was analysed by cell count over 5 days. On day 0, 1.2x10⁴ ARPE-19 WT and POLDIP2 KO cells were seeded in a well of a 24-well plate. Cells from three wells per cell line were harvested daily for the next five days using 0.25% Trypsin-EDTA, stained with trypan blue (Thermo Fisher), and counted using the Countess Automated Cell Counter (Thermo Fisher). The average number of live cells was calculated for each day and normalised to day 1 cell number.
Cell viability assay
Cell viability assay was performed using a CellTiter-Glo Luminescent Cell Viability Assay (Promega) following the manufacturer's instructions. On day 0, 104 ARPE-19 and POLDIP2 KO cells were seeded in a well of a 96-well plate. On day 2, the cells were treated with various concentrations of tert-butyl hydroperoxide (tBHP) (Sigma). On Day 3, the media was replaced with 25μl of fresh media and 25μl of CellTiter-Glo Reagent was added to each well. The plate was incubated at room temperature for 10 minutes to generate a luminescent signal. 40μl of cell lysate from each well was loaded to an opaque white luminometer plate and luminescence was recorded using a Spark 20M microplate reader (Tecan). The OD reading was normalised to the control condition (WT without tBHP).
Immunoblotting
Protein levels were assessed by western blot analysis. Cells were lysed using RIPA Buffer (Thermo Fisher) and sonicated. Protein concentrations were determined using Pierce BCA Protein Assay Kit (Thermo Fisher). Protein lysates were mixed with 4X Laemmli Sample Buffer (Biorad, #1610747) and 2-Mercaptoethanol (1:40, Sigma) and heated at 95° C for 5 minutes. Proteins were separated via 15% SDS-PAGE gels and transferred to PVDF membranes. Following blocking, the immunoblots were incubated overnight with primary antibodies: anti-beta actin (1:2500, Abcam), anti-LC3B (1:1000, Cell Signaling), and anti-POLDIP2 (1:1000, Abcam). Membranes were then incubated with secondary antibodies: goat anti-rabbit IgG HRP or goat anti-mouse IgG HRP (1:2500, all from Abcam). Bands were visualised using Pierce ECL Western Blotting Substrate (Thermo Fisher) using a BioRad Chemidoc MP Imaging System.
Phagocytosis assay
Phagocytosis analysis was performed using fluorescent microspheres. 4x10⁵ cells were seeded in a well of a 6-well plate. Cells were incubated with 1μm diameter, yellow-green (505/515 nm) carboxylate-modified microspheres (FluoSpheres, Thermo Fisher) at a quantity of 160 beads per cell for 4 hours. Cells were dissociated with 0.25% Trypsin-EDTA, washed with DPBS + 1% FBS 5 times, and resuspended in 400μl of DPBS + 1% FBS. The cell samples were added with 0.1 μg/ml of DAPI (Sigma) and passed through a strainer (In Vitro Technologies). Quantification of FITC+ cells was performed using a BD LSRFortessa Cell Analyzer (BD Biosciences). Gating was set with a negative control using WT cells without FluoSpheres.
Mitochondrial membrane potential assay
Mitochondrial membrane potential was assessed using tetra-methyl rhodamine methyl ester (TMRM), which selectively accumulates in the mitochondria according to the mitochondrial membrane potential. Cells were incubated with a non-quenching dose of TMRM at 10 nM in culture media. The mitochondrial respiratory uncoupler Carbonyl cyanide 3-chlorophenylhydrazone (CCCP, 50 mM), was used as a positive control to dissipate the mitochondrial membrane potential. Images were captured at 200x magnification with a fluorescence microscope (Olympus IX71) and the total corrected cell fluorescence was assessed using ImageJ. At least 600 cells from 3 random fields were counted per group.
Mitochondrial superoxide production assay
Mitochondrial production of reactive oxygen species (ROS) was assessed using MitoSOX Red (Thermo Fisher). Cells treated with 5 mM of the antioxidant N-acetyl-L-cysteine (Sigma-Aldrich) were used as a positive control. Images were captured at 200x magnification with a fluorescence microscope (Olympus IX71) and the total corrected cell fluorescence was assessed using ImageJ. At least 600 cells from 3 random fields were counted per group.
RNA sequencing
Total RNA of the ARPE-19 cell lines was extracted using the Illustra RNAspin Mini Kit (GE Healthcare Life Sciences) according to manufacturer’s instructions. RNA quality was checked by bioanalyzer and the TruSeq Stranded mRNA kit (Illumina) was used to prepare transcriptome libraries. The libraries were sequenced using Illumina Novaseq 6000 100bp single-end sequencing, at a depth of 38-50 million reads per sample (Australian Genome Research Facility).
Following the abundance estimates of transcripts generated by Salmon v1.8, the pseudocounts were mapped to the GRCh38 genome assembly using the tximport v1.22.0 package [67]. The gene count matrix was inputted as an DESeq2Dataset object using the DESeqDataSetFromTximport () function, then the DESeq2Dataset object was normalised using the counts() function to make fair gene expression comparisons between samples [68]. The normalised dataset was analysed with the DESeq2 v1.34.0 package using rlog transformation. The sample-level QC was performed using principal components analysis while the gene-level QC was performed using hierarchical clustering. For differential expression analysis, the significant differentially expressed genes were determined using the filter () function with adjusted p value of < 0.05 and fold change > 1.5. The expression data of significant differentially expressed genes was visualised using the ggplot2 v3.3.6, pheatmap v1.0.12 and EnhancedVolcano v1.12.0 R package [69–71]. The upregulated DE genes were used for network topology analysis using Cytoscape v3.8 [72], with default setting of full STRING network, a confidence score cutoff of 0.4 and no additional interactor, resulting in a network with 44 DE genes. Gene ontology analysis was performed for the upregulated DE genes using functional enrichment analysis in Cytoscape with default settings.
Short tandem repeat analysis
Genomic DNA of ARPE-19 cell lines was extracted using the Wizard SV Genomic DNA Purification System (Promega), following manufacturer’s instructions. Short tandem repeat analysis was performed using the GenePrint 10 system (Promega) by the Australian Genome Research Facility.
Statistical analysis
RT-qPCR for POLDIP2 expression, phagocytosis, cell viability, and autophagy assays were assessed using unpaired t-test, mitochondrial assays were analysed using one-way ANOVA (GraphPad Prism). p<0.05 is used to establish statistical significance.
Data availability
The transcriptome data generated in this study are available in the NCBI Gene Expression Omnibus database (GSE207158), including raw data, processed data, information of the experimental design, sequencing and processing pipeline.
Author Contributions
Conceptual design: TN, CL, RG, SYL, SSCH, AWH, SM and RCBW; Conduct experiments: TN, DU, LW, JGL, JW, SSCH; Data analysis: TN, DUC, LW, JGL, SSCH, SYL, CL, RG, SM, RCBW; Funding: CL, RG, TE, SYL, FC, RCBW; Manuscript writing: TN, CL, RG, RCBW. All authors approved the manuscript.
Conflicts of Interest
The authors declare that they have no conflicts of interest.
Funding
This work was funded by the University of Melbourne (RCBW), the Centre for Eye Research Australia (RCBW), and the Stafford Fox Medical Research Foundation (SYL). TN and DU are supported by the Melbourne Research Scholarship from the University of Melbourne. RG is supported by the National Health and Medical Research Council Fellowship. The Centre for Eye Research Australia and St Vincent’s Institute of Medical Research receive operational infrastructure support from the Victorian Government.
References
- 1. Klein BE, Klein R, Linton KL. Intraocular pressure in an American community. The Beaver Dam Eye Study. Invest Ophthalmol Vis Sci. 1992; 33:2224–8. https://doi.org/10.1016/S0161-6420(92)32011-1 [PubMed]
- 2. Mitchell P, Smith W, Attebo K, Wang JJ. Prevalence of age-related maculopathy in Australia. The Blue Mountains Eye Study. Ophthalmology. 1995; 102:1450–60. https://doi.org/10.1016/s0161-6420(95)30846-9 [PubMed]
- 3. Strauss O. The retinal pigment epithelium in visual function. Physiol Rev. 2005; 85:845–81. https://doi.org/10.1152/physrev.00021.2004 [PubMed]
- 4. Kozlowski MR. RPE cell senescence: a key contributor to age-related macular degeneration. Med Hypotheses. 2012; 78:505–10. https://doi.org/10.1016/j.mehy.2012.01.018 [PubMed]
- 5. Terluk MR, Kapphahn RJ, Soukup LM, Gong H, Gallardo C, Montezuma SR, Ferrington DA. Investigating mitochondria as a target for treating age-related macular degeneration. J Neurosci. 2015; 35:7304–11. https://doi.org/10.1523/JNEUROSCI.0190-15.2015 [PubMed]
- 6. Brown EE, DeWeerd AJ, Ildefonso CJ, Lewin AS, Ash JD. Mitochondrial oxidative stress in the retinal pigment epithelium (RPE) led to metabolic dysfunction in both the RPE and retinal photoreceptors. Redox Biol. 2019; 24:101201. https://doi.org/10.1016/j.redox.2019.101201 [PubMed]
- 7. Fisher CR, Ferrington DA. Perspective on AMD Pathobiology: A Bioenergetic Crisis in the RPE. Invest Ophthalmol Vis Sci. 2018; 59:AMD41–7. https://doi.org/10.1167/iovs.18-24289 [PubMed]
- 8. Fritsche LG, Chen W, Schu M, Yaspan BL, Yu Y, Thorleifsson G, Zack DJ, Arakawa S, Cipriani V, Ripke S, Igo RP
Jr , Buitendijk GHS, Sim X, et al, and AMD Gene Consortium. Seven new loci associated with age-related macular degeneration. Nat Genet. 2013; 45:433–9. https://doi.org/10.1038/ng.2578 [PubMed] - 9. Fritsche LG, Igl W, Bailey JNC, Grassmann F, Sengupta S, Bragg-Gresham JL, Burdon KP, Hebbring SJ, Wen C, Gorski M, Kim IK, Cho D, Zack D, et al. A large genome-wide association study of age-related macular degeneration highlights contributions of rare and common variants. Nat Genet. 2016; 48:134–43. https://doi.org/10.1038/ng.3448 [PubMed]
- 10. Han X, Gharahkhani P, Mitchell P, Liew G, Hewitt AW, MacGregor S. Genome-wide meta-analysis identifies novel loci associated with age-related macular degeneration. J Hum Genet. 2020; 65:657–65. https://doi.org/10.1038/s10038-020-0750-x [PubMed]
- 11. Klein RJ, Zeiss C, Chew EY, Tsai JY, Sackler RS, Haynes C, Henning AK, SanGiovanni JP, Mane SM, Mayne ST, Bracken MB, Ferris FL, Ott J, et al. Complement factor H polymorphism in age-related macular degeneration. Science. 2005; 308:385–9. https://doi.org/10.1126/science.1109557 [PubMed]
- 12. Rivera A, Fisher SA, Fritsche LG, Keilhauer CN, Lichtner P, Meitinger T, Weber BHF. Hypothetical LOC387715 is a second major susceptibility gene for age-related macular degeneration, contributing independently of complement factor H to disease risk. Hum Mol Genet. 2005; 14:3227–36. https://doi.org/10.1093/hmg/ddi353 [PubMed]
- 13. Hageman GS, Anderson DH, Johnson LV, Hancox LS, Taiber AJ, Hardisty LI, Hageman JL, Stockman HA, Borchardt JD, Gehrs KM, Smith RJH, Silvestri G, Russell SR, et al. A common haplotype in the complement regulatory gene factor H (HF1/CFH) predisposes individuals to age-related macular degeneration. Proc Natl Acad Sci USA. 2005; 102:7227–32. https://doi.org/10.1073/pnas.0501536102 [PubMed]
- 14. Deng Y, Shuai P, Wang H, Zhang S, Li J, Du M, Huang P, Qu C, Huang L. Untargeted metabolomics for uncovering plasma biological markers of wet age-related macular degeneration. Aging (Albany NY). 2021; 13:13968–4000. https://doi.org/10.18632/aging.203006 [PubMed]
- 15. Ratnapriya R, Sosina OA, Starostik MR, Kwicklis M, Kapphahn RJ, Fritsche LG, Walton A, Arvanitis M, Gieser L, Pietraszkiewicz A, Montezuma SR, Chew EY, Battle A, et al. Retinal transcriptome and eQTL analyses identify genes associated with age-related macular degeneration. Nat Genet. 2019; 51:606–10. https://doi.org/10.1038/s41588-019-0351-9 [PubMed]
- 16. Orozco LD, Chen HH, Cox C, Katschke KJ
Jr , Arceo R, Espiritu C, Caplazi P, Nghiem SS, Chen YJ, Modrusan Z, Dressen A, Goldstein LD, Clarke C, et al. Integration of eQTL and a Single-Cell Atlas in the Human Eye Identifies Causal Genes for Age-Related Macular Degeneration. Cell Rep. 2020; 30:1246–59.e6. https://doi.org/10.1016/j.celrep.2019.12.082 [PubMed] - 17. Strunz T, Lauwen S, Kiel C, Hollander AD, Weber BH, and International AMD Genomics Consortium (IAMDGC). A transcriptome-wide association study based on 27 tissues identifies 106 genes potentially relevant for disease pathology in age-related macular degeneration. Sci Rep. 2020; 10:1584. https://doi.org/10.1038/s41598-020-58510-9 [PubMed]
- 18. Nguyen T, Urrutia-Cabrera D, Liou RHC, Luu CD, Guymer R, Wong RC. New Technologies to Study Functional Genomics of Age-Related Macular Degeneration. Front Cell Dev Biol. 2021; 8:604220. https://doi.org/10.3389/fcell.2020.604220 [PubMed]
- 19. Wang J, Urrutia-Cabrera D, Lees J, Mora S, Nguyen T, Hung S, Hewitt A, Lim S, Edwards T, Wong RCB. Development of a CRISPRi human retinal pigmented epithelium model for functional study of age-related macular degeneration genes. Int J Mol Sci. 2023; in press. https://doi.org/10.3390/ijms24043417
- 20. Hernandes MS, Lassègue B, Griendling KK. Polymerase δ-interacting Protein 2: A Multifunctional Protein. J Cardiovasc Pharmacol. 2017; 69:335–42. https://doi.org/10.1097/FJC.0000000000000465 [PubMed]
- 21. Datla SR, McGrail DJ, Vukelic S, Huff LP, Lyle AN, Pounkova L, Lee M, Seidel-Rogol B, Khalil MK, Hilenski LL, Terada LS, Dawson MR, Lassègue B, Griendling KK. Poldip2 controls vascular smooth muscle cell migration by regulating focal adhesion turnover and force polarization. Am J Physiol Heart Circ Physiol. 2014; 307:H945–57. https://doi.org/10.1152/ajpheart.00918.2013 [PubMed]
- 22. Kim Y, Park H, Nah J, Moon S, Lee W, Hong SH, Kam TI, Jung YK. Essential role of POLDIP2 in Tau aggregation and neurotoxicity via autophagy/proteasome inhibition. Biochem Biophys Res Commun. 2015; 462:112–8. https://doi.org/10.1016/j.bbrc.2015.04.084 [PubMed]
- 23. Brown DI, Lassègue B, Lee M, Zafari R, Long JS, Saavedra HI, Griendling KK. Poldip2 knockout results in perinatal lethality, reduced cellular growth and increased autophagy of mouse embryonic fibroblasts. PLoS One. 2014; 9:e96657. https://doi.org/10.1371/journal.pone.0096657 [PubMed]
- 24. Sutliff RL, Hilenski LL, Amanso AM, Parastatidis I, Dikalova AE, Hansen L, Datla SR, Long JS, El-Ali AM, Joseph G, Gleason RL
Jr , Taylor WR, Hart CM, et al. Polymerase delta interacting protein 2 sustains vascular structure and function. Arterioscler Thromb Vasc Biol. 2013; 33:2154–61. https://doi.org/10.1161/ATVBAHA.113.301913 [PubMed] - 25. Paredes F, Sheldon K, Lassègue B, Williams HC, Faidley EA, Benavides GA, Torres G, Sanhueza-Olivares F, Yeligar SM, Griendling KK, Darley-Usmar V, San Martin A. Poldip2 is an oxygen-sensitive protein that controls PDH and αKGDH lipoylation and activation to support metabolic adaptation in hypoxia and cancer. Proc Natl Acad Sci USA. 2018; 115:1789–94. https://doi.org/10.1073/pnas.1720693115 [PubMed]
- 26. Frost S, Guymer R, Aung KZ, Macaulay SL, Sohrabi HR, Bourgeat P, Salvado O, Rowe CC, Ames D, Masters CL, Martins RN, Kanagasingam Y, and AIBL Research Group. Alzheimer’s Disease and the Early Signs of Age-Related Macular Degeneration. Curr Alzheimer Res. 2016; 13:1259–66. https://doi.org/10.2174/1567205013666160603003800 [PubMed]
- 27. Wen LY, Wan L, Lai JN, Chen CS, Chen JJY, Wu MY, Hu KC, Chiu LT, Tien PT, Lin HJ. Increased risk of Alzheimer’s disease among patients with age-related macular degeneration: A nationwide population-based study. PLoS One. 2021; 16:e0250440. https://doi.org/10.1371/journal.pone.0250440 [PubMed]
- 28. Ran FA, Hsu PD, Wright J, Agarwala V, Scott DA, Zhang F. Genome engineering using the CRISPR-Cas9 system. Nat Protoc. 2013; 8:2281–308. https://doi.org/10.1038/nprot.2013.143 [PubMed]
- 29. Gilbert LA, Larson MH, Morsut L, Liu Z, Brar GA, Torres SE, Stern-Ginossar N, Brandman O, Whitehead EH, Doudna JA, Lim WA, Weissman JS, Qi LS. CRISPR-mediated modular RNA-guided regulation of transcription in eukaryotes. Cell. 2013; 154:442–51. https://doi.org/10.1016/j.cell.2013.06.044 [PubMed]
- 30. Beatty S, Koh H, Phil M, Henson D, Boulton M. The role of oxidative stress in the pathogenesis of age-related macular degeneration. Surv Ophthalmol. 2000. https://doi.org/10.1016/s0039-6257(00)00140-5 [PubMed]
- 31. Golestaneh N, Chu Y, Cheng SK, Cao H, Poliakov E, Berinstein DM. Repressed SIRT1/PGC-1α pathway and mitochondrial disintegration in iPSC-derived RPE disease model of age-related macular degeneration. J Transl Med. 2016; 14:344. https://doi.org/10.1186/s12967-016-1101-8 [PubMed]
- 32. Zhang Q, Presswalla F, Ali RR, Zacks DN, Thompson DA, Miller JML. Pharmacologic activation of autophagy without direct mTOR inhibition as a therapeutic strategy for treating dry macular degeneration. Aging (Albany NY). 2021; 13:10866–90. https://doi.org/10.18632/aging.202974 [PubMed]
- 33. Klionsky DJ, et al. Guidelines for the use and interpretation of assays for monitoring autophagy (3rd edition). Autophagy. 2016; 12:1–222. https://doi.org/10.1080/15548627.2015.1100356 [PubMed]
- 34. Justilien V, Pang JJ, Renganathan K, Zhan X, Crabb JW, Kim SR, Sparrow JR, Hauswirth WW, Lewin AS. SOD2 knockdown mouse model of early AMD. Invest Ophthalmol Vis Sci. 2007; 48:4407–20. https://doi.org/10.1167/iovs.07-0432 [PubMed]
- 35. Yates JRW, Sepp T, Matharu BK, Khan JC, Thurlby DA, Shahid H, Clayton DG, Hayward C, Morgan J, Wright AF, Armbrecht AM, Dhillon B, Deary IJ, et al, and Genetic Factors in AMD Study Group. Complement C3 variant and the risk of age-related macular degeneration. N Engl J Med. 2007; 357:553–61. https://doi.org/10.1056/NEJMoa072618 [PubMed]
- 36. Hu SJ, Calippe B, Lavalette S, Roubeix C, Montassar F, Housset M, Levy O, Delarasse C, Paques M, Sahel JA, Sennlaub F, Guillonneau X. Upregulation of P2RX7 in Cx3cr1-Deficient Mononuclear Phagocytes Leads to Increased Interleukin-1β Secretion and Photoreceptor Neurodegeneration. J Neurosci. 2015; 35:6987–96. https://doi.org/10.1523/JNEUROSCI.3955-14.2015 [PubMed]
- 37. Yu Q, Zhu J, Yao Y, Sun C. Complement family member CFI polymorphisms and AMD susceptibility from a comprehensive analysis. Biosci Rep. 2020; 40:BSR20200406. https://doi.org/10.1042/BSR20200406 [PubMed]
- 38. Sun C, Zhao M, Li X. CFB/C2 gene polymorphisms and risk of age-related macular degeneration: a systematic review and meta-analysis. Curr Eye Res. 2012; 37:259–71. https://doi.org/10.3109/02713683.2011.635401 [PubMed]
- 39. Fletcher EL, Jobling AI, Greferath U, Mills SA, Waugh M, Ho T, de Iongh RU, Phipps JA, Vessey KA. Studying age-related macular degeneration using animal models. Optom Vis Sci. 2014; 91:878–86. https://doi.org/10.1097/OPX.0000000000000322 [PubMed]
- 40. Huberman AD, Niell CM. What can mice tell us about how vision works? Trends Neurosci. 2011; 34:464–73. https://doi.org/10.1016/j.tins.2011.07.002 [PubMed]
- 41. Finnemann SC, Bonilha VL, Marmorstein AD, Rodriguez-Boulan E. Phagocytosis of rod outer segments by retinal pigment epithelial cells requires alpha(v)beta5 integrin for binding but not for internalization. Proc Natl Acad Sci USA. 1997; 94:12932–37. https://doi.org/10.1073/pnas.94.24.12932 [PubMed]
- 42. Dunn KC, Aotaki-Keen AE, Putkey FR, Hjelmeland LM. ARPE-19, a human retinal pigment epithelial cell line with differentiated properties. Exp Eye Res. 1996; 62:155–69. https://doi.org/10.1006/exer.1996.0020 [PubMed]
- 43. Mannermaa E, Reinisalo M, Ranta VP, Vellonen KS, Kokki H, Saarikko A, Kaarniranta K, Urtti A. Filter-cultured ARPE-19 cells as outer blood-retinal barrier model. Eur J Pharm Sci. 2010; 40:289–96. https://doi.org/10.1016/j.ejps.2010.04.001 [PubMed]
- 44. Allan SM, Tyrrell PJ, Rothwell NJ. Interleukin-1 and neuronal injury. Nat Rev Immunol. 2005; 5:629–40. https://doi.org/10.1038/nri1664 [PubMed]
- 45. Shaftel SS, Griffin WST, O’Banion MK. The role of interleukin-1 in neuroinflammation and Alzheimer disease: an evolving perspective. J Neuroinflammation. 2008; 5:7. https://doi.org/10.1186/1742-2094-5-7 [PubMed]
- 46. Eandi CM, Charles Messance H, Augustin S, Dominguez E, Lavalette S, Forster V, Hu SJ, Siquieros L, Craft CM, Sahel JA, Tadayoni R, Paques M, Guillonneau X, Sennlaub F. Subretinal mononuclear phagocytes induce cone segment loss via IL-1β. Elife. 2016; 5:e16490. https://doi.org/10.7554/eLife.16490 [PubMed]
- 47. Chen H, Liu B, Lukas TJ, Neufeld AH. The aged retinal pigment epithelium/choroid: a potential substratum for the pathogenesis of age-related macular degeneration. PLoS One. 2008; 3:e2339. https://doi.org/10.1371/journal.pone.0002339 [PubMed]
- 48. Yamada K, Sakurai E, Itaya M, Yamasaki S, Ogura Y. Inhibition of laser-induced choroidal neovascularization by atorvastatin by downregulation of monocyte chemotactic protein-1 synthesis in mice. Invest Ophthalmol Vis Sci. 2007; 48:1839–43. https://doi.org/10.1167/iovs.06-1085 [PubMed]
- 49. Nakazawa T, Hisatomi T, Nakazawa C, Noda K, Maruyama K, She H, Matsubara A, Miyahara S, Nakao S, Yin Y, Benowitz L, Hafezi-Moghadam A, Miller JW. Monocyte chemoattractant protein 1 mediates retinal detachment-induced photoreceptor apoptosis. Proc Natl Acad Sci USA. 2007; 104:2425–30. https://doi.org/10.1073/pnas.0608167104 [PubMed]
- 50. Higgins GT, Wang JH, Dockery P, Cleary PE, Redmond HP. Induction of angiogenic cytokine expression in cultured RPE by ingestion of oxidized photoreceptor outer segments. Invest Ophthalmol Vis Sci. 2003; 44:1775–82. https://doi.org/10.1167/iovs.02-0742 [PubMed]
- 51. Van Kirk CA, VanGuilder HD, Young M, Farley JA, Sonntag WE, Freeman WM. Age-related alterations in retinal neurovascular and inflammatory transcripts. Mol Vis. 2011; 17:1261–74. [PubMed]
- 52. He Y, Zhang Z, Huang L, Yao T, Yang W, Chen J. Low expression of TNFAIP3 enhances the function of dendritic cells in AMD via MAPK signaling pathway. Research Square. 2022. Available from: https://www.researchsquare.com/article/rs-1508180/latest.pdf https://doi.org/10.21203/rs.3.rs-1508180/v1
- 53. Lagali NS, Badian RA, Liu X, Feldreich TR, Ärnlöv J, Utheim TP, Dahlin LB, Rolandsson O. Dendritic cell maturation in the corneal epithelium with onset of type 2 diabetes is associated with tumor necrosis factor receptor superfamily member 9. Sci Rep. 2018; 8:14248. https://doi.org/10.1038/s41598-018-32410-5 [PubMed]
- 54. Zhang J, Li S, Hu S, Yu J, Xiang Y. Association between genetic variation of complement C3 and the susceptibility to advanced age-related macular degeneration: a meta-analysis. BMC Ophthalmol. 2018; 18:274. https://doi.org/10.1186/s12886-018-0945-5 [PubMed]
- 55. Nozaki M, Raisler BJ, Sakurai E, Sarma JV, Barnum SR, Lambris JD, Chen Y, Zhang K, Ambati BK, Baffi JZ, Ambati J. Drusen complement components C3a and C5a promote choroidal neovascularization. Proc Natl Acad Sci USA. 2006; 103:2328–33. https://doi.org/10.1073/pnas.0408835103 [PubMed]
- 56. Hageman GS, Luthert PJ, Victor Chong NH, Johnson LV, Anderson DH, Mullins RF. An integrated hypothesis that considers drusen as biomarkers of immune-mediated processes at the RPE-Bruch’s membrane interface in aging and age-related macular degeneration. Prog Retin Eye Res. 2001; 20:705–32. https://doi.org/10.1016/s1350-9462(01)00010-6 [PubMed]
- 57. Johnson LV, Leitner WP, Staples MK, Anderson DH. Complement activation and inflammatory processes in Drusen formation and age related macular degeneration. Exp Eye Res. 2001; 73:887–96. https://doi.org/10.1006/exer.2001.1094 [PubMed]
- 58. Maga G, Crespan E, Markkanen E, Imhof R, Furrer A, Villani G, Hübscher U, van Loon B. DNA polymerase δ-interacting protein 2 is a processivity factor for DNA polymerase λ during 8-oxo-7,8-dihydroguanine bypass. Proc Natl Acad Sci USA. 2013; 110:18850–5. https://doi.org/10.1073/pnas.1308760110 [PubMed]
- 59. Lyle AN, Deshpande NN, Taniyama Y, Seidel-Rogol B, Pounkova L, Du P, Papaharalambus C, Lassègue B, Griendling KK. Poldip2, a novel regulator of Nox4 and cytoskeletal integrity in vascular smooth muscle cells. Circ Res. 2009; 105:249–59. https://doi.org/10.1161/CIRCRESAHA.109.193722 [PubMed]
- 60. Wang Y, Ding Z, Tu Y, Wu X, Zhang W, Ji S, Shen J, Zhang L, Wu H, Fei G. Poldip2/Nox4 Mediates Lipopolysaccharide-Induced Oxidative Stress and Inflammation in Human Lung Epithelial Cells. Mediators Inflamm. 2022; 2022:6666022. https://doi.org/10.1155/2022/6666022 [PubMed]
- 61. Forrester SJ, Xu Q, Kikuchi DS, Okwan-Duodu D, Campos AC, Faidley EA, Zhang G, Lassègue B, Sadikot RT, Griendling KK, Hernandes MS. Poldip2 deficiency protects against lung edema and vascular inflammation in a model of acute respiratory distress syndrome. Clin Sci (Lond). 2019; 133:321–34. https://doi.org/10.1042/CS20180944 [PubMed]
- 62. Nashine S, Kenney MC. Role of Citicoline in an in vitro AMD model. Aging (Albany NY). 2020; 12:9031–40. https://doi.org/10.18632/aging.103164 [PubMed]
- 63. Ablonczy Z, Dahrouj M, Tang PH, Liu Y, Sambamurti K, Marmorstein AD, Crosson CE. Human retinal pigment epithelium cells as functional models for the RPE in vivo. Invest Ophthalmol Vis Sci. 2011; 52:8614–20. https://doi.org/10.1167/iovs.11-8021 [PubMed]
- 64. Lapierre-Landry M, Carroll J, Skala MC. Imaging retinal melanin: a review of current technologies. J Biol Eng. 2018; 12:29. https://doi.org/10.1186/s13036-018-0124-5 [PubMed]
- 65. Alfonsetti M, Castelli V, d’Angelo M, Benedetti E, Allegretti M, Barboni B, Cimini A. Looking for In Vitro Models for Retinal Diseases. Int J Mol Sci. 2021; 22:10334. https://doi.org/10.3390/ijms221910334 [PubMed]
- 66. Lassègue B, Kumar S, Mandavilli R, Wang K, Tsai M, Kang DW, Demos C, Hernandes MS, San Martín A, Taylor WR, Jo H, Griendling KK. Characterization of Poldip2 knockout mice: Avoiding incorrect gene targeting. PLoS One. 2021; 16:e0247261. https://doi.org/10.1371/journal.pone.0247261 [PubMed]
- 67. Patro R, Duggal G, Love MI, Irizarry RA, Kingsford C. Salmon provides fast and bias-aware quantification of transcript expression. Nat Methods. 2017; 14:417–9. https://doi.org/10.1038/nmeth.4197 [PubMed]
- 68. Love MI, Huber W, Anders S. Moderated estimation of fold change and dispersion for RNA-seq data with DESeq2. Genome Biol. 2014; 15:550. https://doi.org/10.1186/s13059-014-0550-8 [PubMed]
- 69. Wickham H. ggplot2: elegant graphics for data analysis Springer-Verlag New York. 2009. Book; 2016. https://doi.org/10.1007/978-0-387-98141-3
- 70. Blighe K, Rana S, Lewis M. EnhancedVolcano: Publication-ready volcano plots with enhanced colouring and labeling. Github. 2018.
- 71. Kolde. pheatmap: Pretty Heatmaps. R package version 1.0. 12. CRAN R-project org/package= pheatmap.
- 72. Shannon P, Markiel A, Ozier O, Baliga NS, Wang JT, Ramage D, Amin N, Schwikowski B, Ideker T. Cytoscape: a software environment for integrated models of biomolecular interaction networks. Genome Res. 2003; 13:2498–504. https://doi.org/10.1101/gr.1239303 [PubMed]