


Introduction
Ovarian cancer and renal cancer can occur at any age, its incidence is increasing [1, 2]. It initially manifests with very little symptoms and is difficult to detect at first. When a patient presents their symptoms to a hospital for examination, it is often in late stages, and treatment has already been delayed [3]. Ovarian and renal cancers pose a major health threat to women. Ovarian cancer and renal cancer can seriously affect the life of patients, and even threaten their lives. Surgical treatment is the main treatment, supplemented by chemotherapy, radiotherapy, immunotherapy, etc., [4, 5]. However, pathogenesis of ovarian cancer and renal cancer is unknown, and more researches are needed.
Bioinformatics is the intersection of biology and computer science. It is also an important content of proteome research [6]. Today bioinformatics technology is advancing, it has been used to analyze known or new gene products [7].
TTK (TTK Protein Kinase) is a Protein coding gene located in chromosome 6q13-6q21. Its related pathways include DNA damage and cell cycle, encodes phosphorylated Protein kinases on serine [8]. TTK protein kinase is a mitotic kinase that participates in control of cell progression through mitosis, and affects cell division [9].
Akt/mTOR pathway has multiple initiation mechanisms, and it manifests in some cancer subtypes [10]. Akt/mTOR pathway affects protein translation, survival, metabolism, its abnormalities can cause cancer [11]. But, how TTK and AKT-mTOR pathways affect ovarian cancer and renal cancer is uncertain.
This research with aid of bioinformatics, digging at core genes of ovarian cancer and renal cancer, through some experiments to determine whether TTK and AKT-mTOR pathway can affect ovarian cancer and renal cancer.
Methods
Ovarian cancer data set
Profiles of ovarian cancer GSE36668 and GSE69428 were generated using GPL570, at the same time we also use GSE140082 data set as a survival data validation from GEO database (http://www.ncbi.nlm.nih.gov/geo/). Among them, GSE36668 included 8 ovarian cancer and 4 normal tissue samples, GSE69428 included 10 ovarian cancer and 10 normal tissue samples to get DEGs in ovarian cancer.
Batch processing
For combination of multiple data sets, we firstly combined data sets GSE36668 and GSE69428 with R software package inSilicoMerging (https://doi.org/10.1186/1471-2105-13-335) to obtain merge matrix. Further, we used remove Batch Effect function of the R software package limma (version 3.42.2) to remove batch effect, finally obtained matrix after removing batch effect, which was applied to subsequent analysis.
Screening of DEGs
R package “limma” was used for probe summary and background correction of batched-effect post-matrix for GSE36668 and GSE69428. Used Benjamini-Hochberg method to set raw P values. Used fold change (FC) to get false discovery rate (FDR). Cut-off criterion for DEG was FDR < 0.05. And make a volcano diagram.
Weighted gene co-expression network analysis (WGCNA)
Top 50% genes with smallest median absolute deviation were acquired and excluded. For all genes in pairs perform Pearson correlation matrix and average chain method, using power function a|mn=| C|mn |^β build weighted adjacency matrix. After choose soft threshold parameter, converts adjacency matrix to topological overlap matrix. Average linkage hierarchical clustering was performed, minimum size (genome) was 30. Sensitivity was set to 3. We calculated the phase divergence of module feature genes, incorporating modules with distances less than 0.25. At the same time, we also predicted the inter-relationship of genes in the module to obtain core genes.
PPI network
Intersect the core genes of WGCNA with the genes selected in the volcano map. The list of genes was input into the STRING (http://string-db.org/) database to build a PPI network (confidence >0.4) for predicting core genes. PPI network was imported into cytoscape software. Three algorithms (MCC, MNC, DMNC) were used to calculate ten best correlation genes and take intersection, and core gene list was exported after visualization.
Functional enrichment analysis
Gene Ontology analysis (GO) and Kyoto Encyclopedia of Genes and Genomes (KEGG) analysis are computational methods for assessing gene function and biological pathways. The core of this research will figure out Venn diagram list input KEGG rest API (https://www.kegg.jp/kegg/rest/keggapi.html), to obtain the latest KEGG Pathway gene annotation. As the background, the genes were mapped to the background set, and the R software package clusterProfiler (version 3.14.3) was used for enrichment analysis to obtain the results of gene set enrichment. Also use R software package org.Hs.eg.db (version 3.1.0) gene in the GO annotation, as the background, to map genes to background in the collection, set the minimum gene sets 5, biggest gene sets, 5000, P value of < 0.05 and a FDR of < 0.25 were considered as measures of statistical significance.
This study will Wayne figure out the difference of gene list input KEGG rest API (https://www.kegg.jp/kegg/rest/keggapi.html) to get latest KEGG Pathway gene annotation, Used R package clusterProfiler (version 3.14.3) for enrichment analysis to get results of gene set enrichment. GO annotation of genes in R software package org.Hs.eg.db (version 3.1.0) was used as background, genes were mapped to background set. The minimum gene set was 5, maximum gene set was 5000. P value of < 0.05, FDR of < 0.25 were measures of statistical significance.
In addition, we use Metascape database (http://metascape.org/gp/index.html), for above differences in gene enrichment of function analysis and export list.
GSEA analysis
GSEA, computational method that can perform GO and KEGG analyses on complete genomes. In our study, we grouped the samples by tumor tissue and normal tissue, performed GO and KEGG analyses on the whole genome. Developed by GSEA.
Heat map of gene expression
By R package heatmap to make a heatmap of expression degree of core genes found by three algorithms in PPI network to visually displayed expression differences of core genes between cancer and normal tissue.
Survival analysis
We selected the ovarian cancer survival data from the dataset GSE140082, used R software package maxstat (version:0.7–25) to calculate optimal cut-off value of RiskScore of ten core genes, best cut-off value is calculated, Survfit function of the R package survival was further used to find prognostic differences. We also used R package forest to make a forest map of 10 core genes to observe whether each independent core gene had a significant effect on prognosis of renal cancer.
Establishment of animal models
Measure weight of C57BL/6J mice (Female, 8 ± 1 Weeks) and recorded. They were then randomly numbered and grouped. Divide rats into 4 groups of 6 rats each. Group A: Con; Group B: OV; Group C: OV/TTK-OE; Group D: OV/TTK-KO. The oncogene of human ovarian cancer tumor was directly transferred into mice for expression. The target gene (genome fragment) was injected into the fertilized egg of the mouse by microinjection method, and the fertilized egg was implanted into the fallopian tube (or uterus) of the recipient animal to develop transgenic mice carrying foreign gene.
Western blot
Extracting total protein from tissue, after concentration was determined by UV method, 1/4 of protein sample volume of 5× protein loading buffer (reduced) was added to tissue, boiled at 100°C for 10 min, cooled, packed and frozen in −80°C refrigerator until use. Protein samples were subjected to 12% SDS-PAGE gel electrophoresis, membrane transformation, other operations. Block 5% skim milk at room temperature for 1 h. Added primary antibody, incubated samples overnight at 4°C. After shaking TBST for 3 times (5 min/time), rabbit secondary antibody was added. After incubation for 1 h at room temperature, TBST was shaken 3 times (5 min/time). Analyzed results after chemiluminescence solution was developed.
GEPIA for the TTK and renal cancer
Through the GEPIA, the expression of TTK in the renal cancer was analyzed, and the relationship between relative expression of TTK and pathological stage was also explored. Furthermore, the overall survival of renal cancer was analyzed.
Data availability
The datasets generated during and/or analyzed during the current study are available from the corresponding author on reasonable request.
Results
Differentially expressed genes (DEGs)
1052 DEGs were found based on DEGs identified in debatching merge matrix of GSE36668 and GSE69428 (Figure 1).
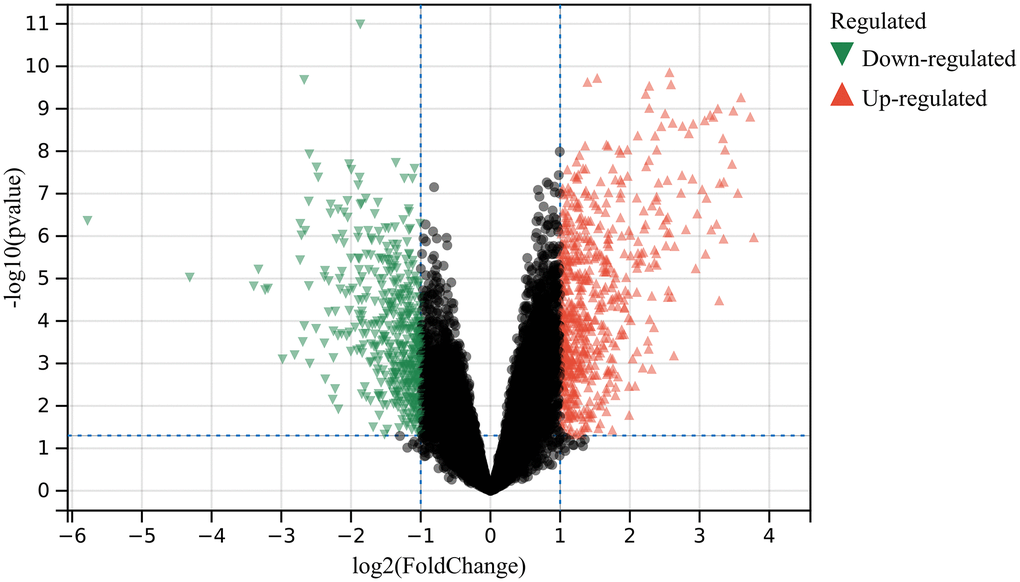
Figure 1. DEGs were identified. 602 up-regulated (Red) and 450 down-regulated genes (Green).
WGCNA analysis
Soft threshold power in WGCNA analysis was set to 7, which is lowest power for scale-free topological fit index of 0.9 (Figure 2A, 2B). Hierarchical clustering trees were constructed for all genes and yielded 14 significant modules (Figure 2C). Interactions between these modules were then analyzed (Figure 2D). Relationship between modules and clinical manifestations of ovarian cancer is shown in Figure 3A. Highly correlated modules were then plotted against a column scatter plot of clinical characteristics (Figure 3B–3G). We take as standard | MM | > 0.8, a total of 1909 in clinical important modules with high connectivity genes have been identified as core.
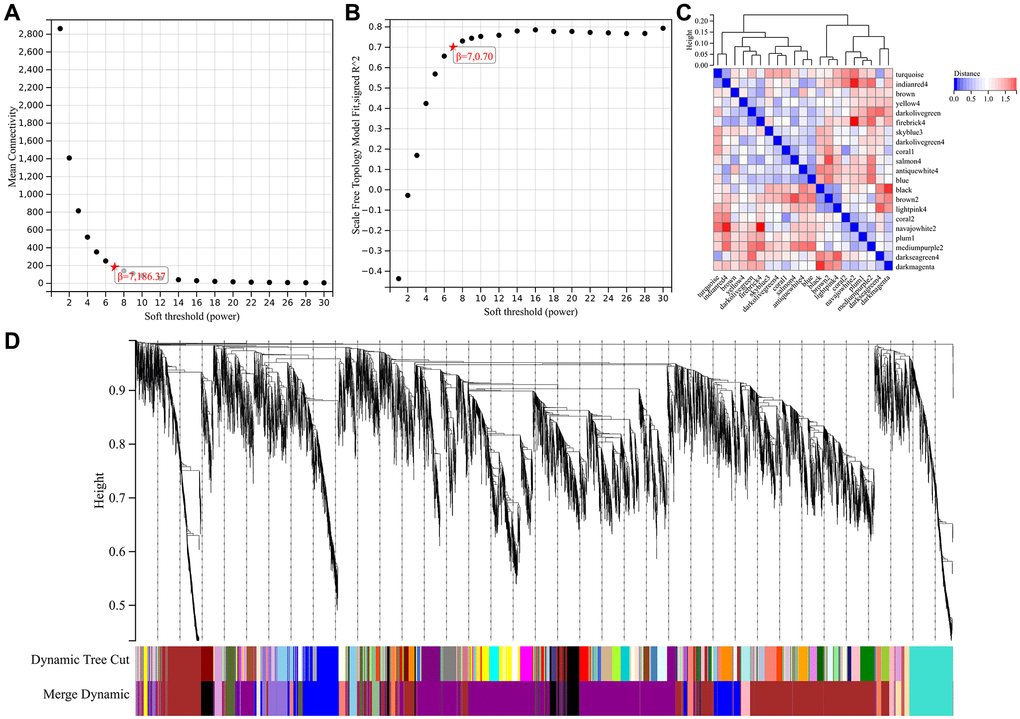
Figure 2. WGCNA analysis. (A) β = 7,186.37; (B) β = 7,0.707; (C) 14 important modules; (D) A high degree of independence between modules.
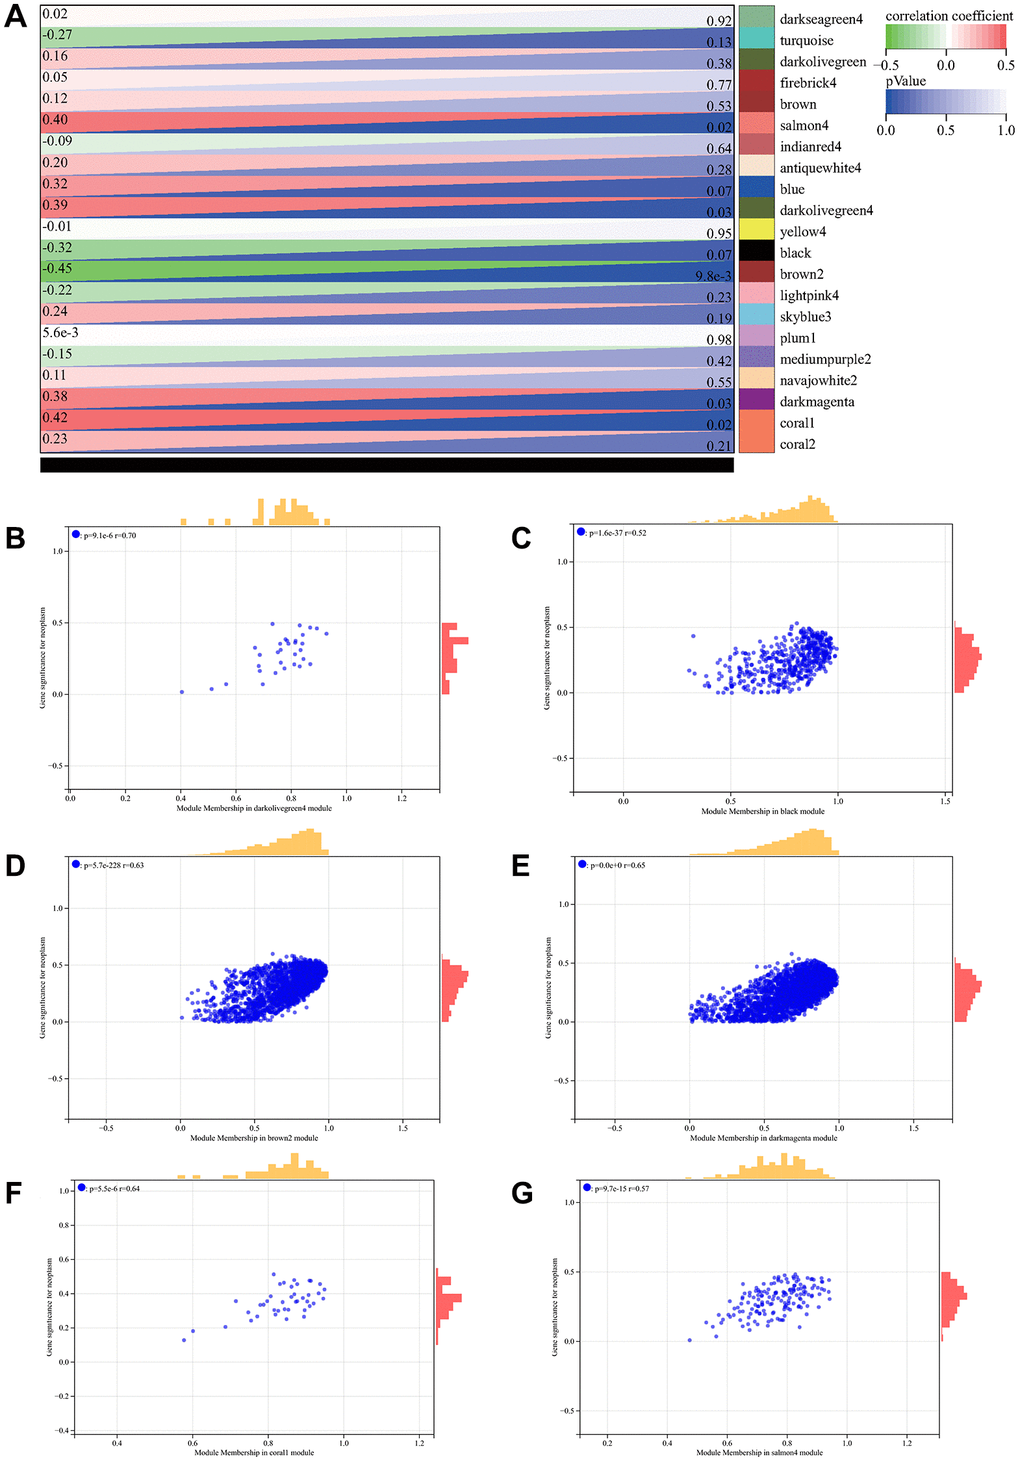
Figure 3. WGCNA analysis. (A) relationship between module and clinical manifestations of ovarian cancer; (B) Module Membership in darkolivegreen4 module: p = 9.1e-6, r = 0.70; (C) Module Membership in black module: p = 1.6e-37, r = 0.52; (D) Module Membership in brown2 module: p = 5.7e-228, r = 0.63; (E) Module Membership in darkmagenta module: p = 0.0e + 0, r = 0.65; (F) Membership in coral1 module: p = 5.5e-6, r = 0.64; (G) Membership in salmon4 module: p = 9.7e-15, r = 0.57.
PPI network
Selected DEGs in tumor group, analyzed by Cytoscape software (Figure 4A), a total of 3 core modules were obtained using MCODE algorithm (Figure 4B–4D), and 22 common hub genes were obtained using MCC algorithm to identify the core genes (Figure 4E–4G).
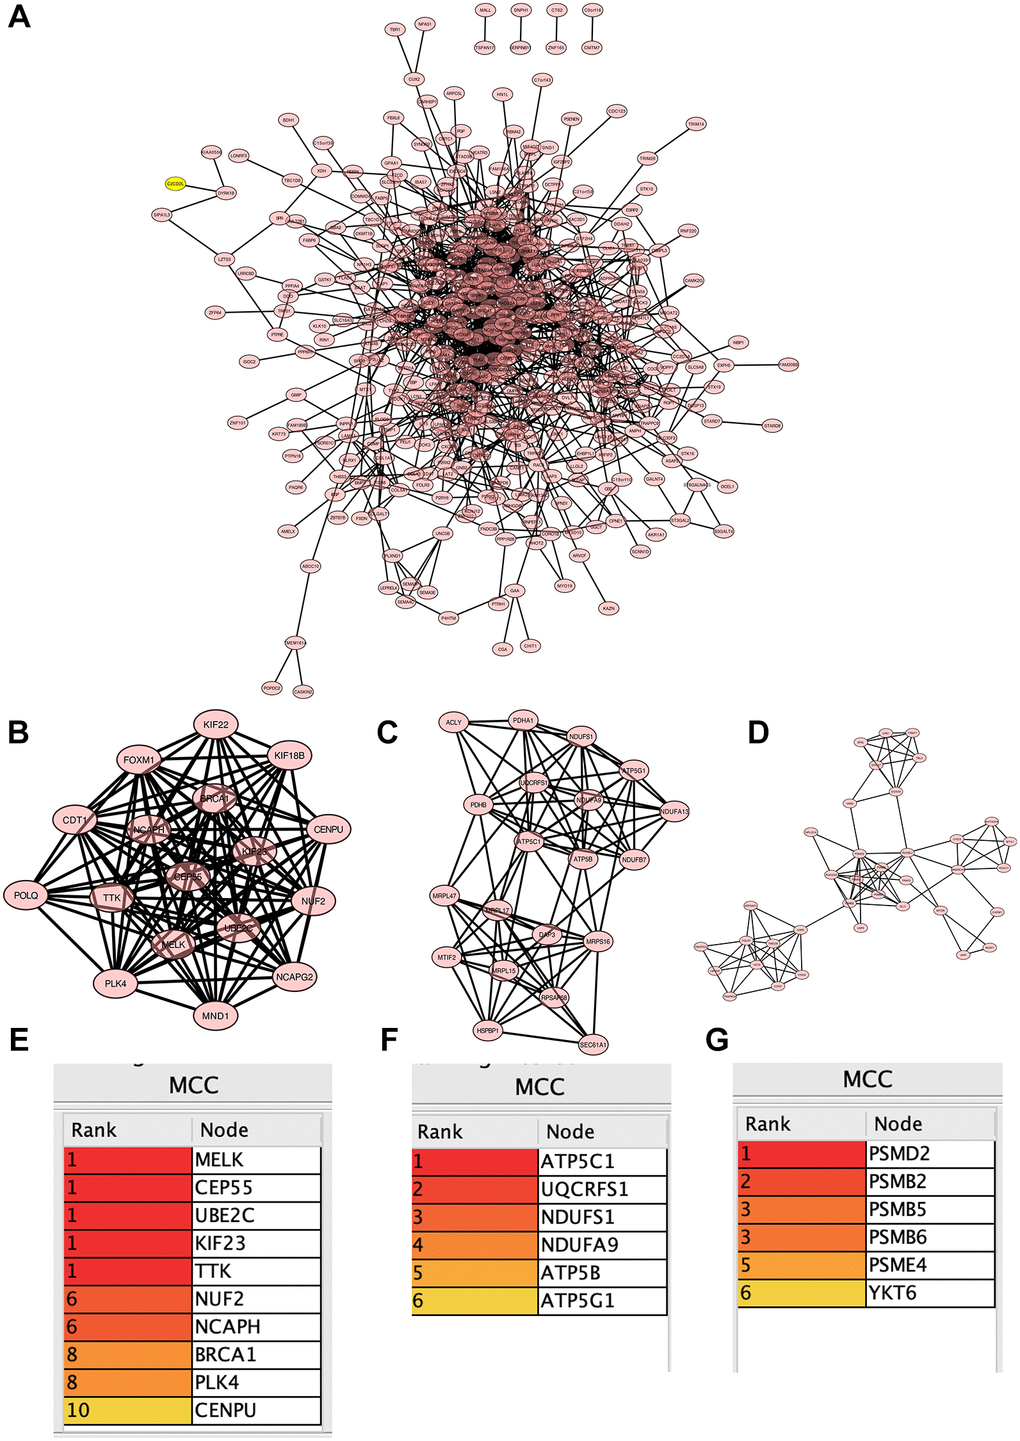
Figure 4. Construction of protein-protein interaction (PPI) network. (A) PPI network; (B–D) 3 core modules; (E–G) 22 common central genes.
Functional enrichment analysis
Used GSE10540 gene matrix for enrichment analysis, and it can be seen that the GSEA enrichment project was validated with the GO and KEGG enrichment projects among differentially expressed genes, which were mainly enriched in the endoplasmic reticulum, organelle subcompartment, purine ribonucleotide transmembrane transporter (Figure 5A, 5B).
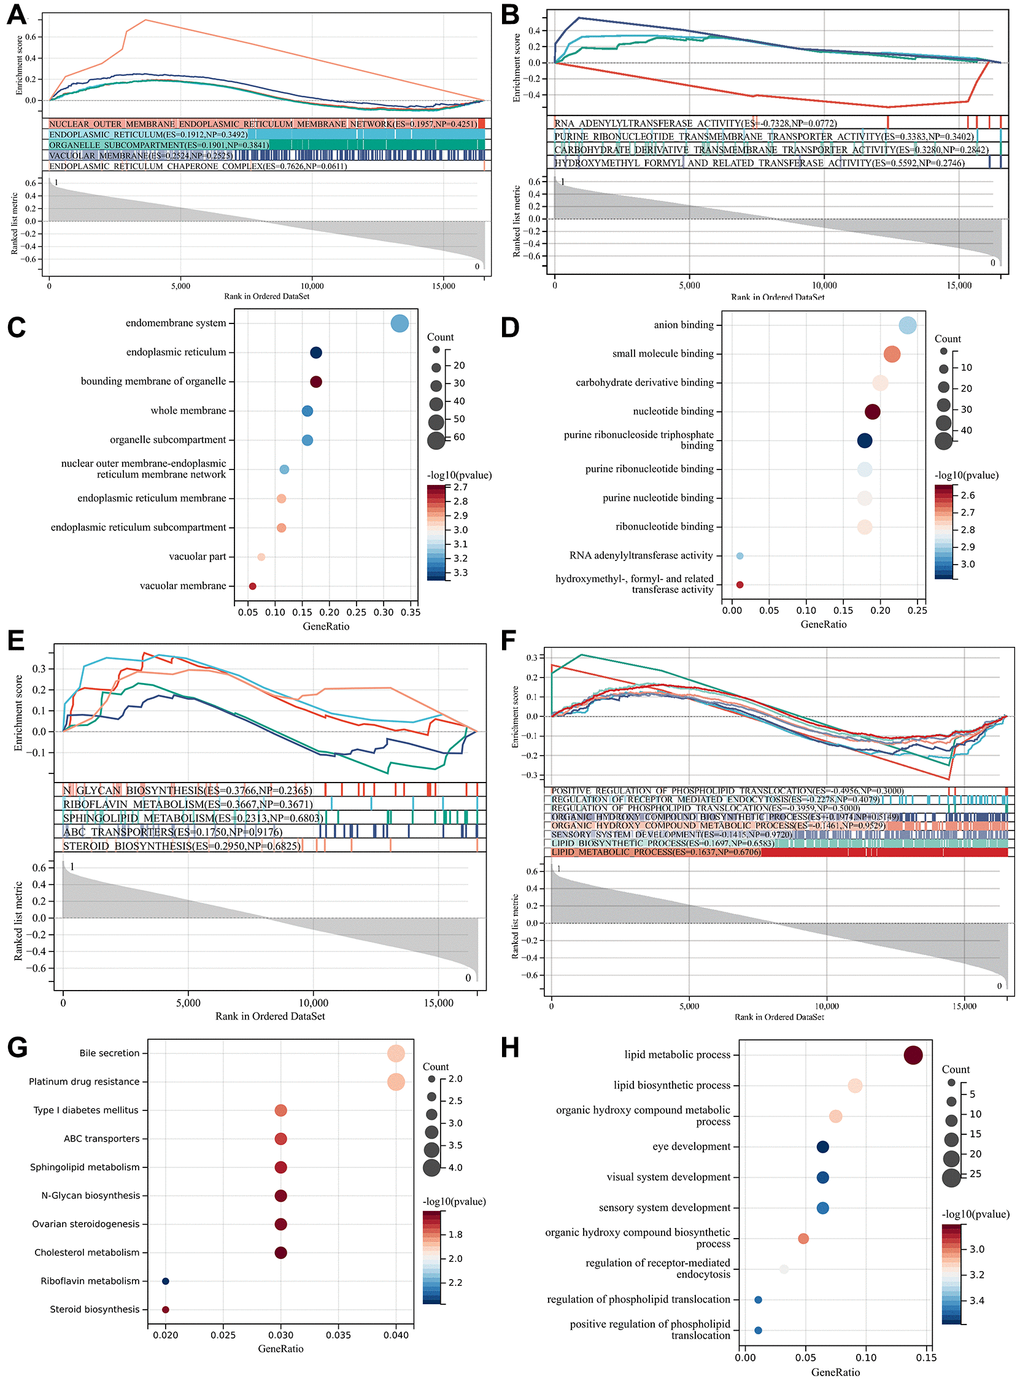
Figure 5. Functional enrichment analysis and GSEA analysis. (A) GO and KEGG enrichment projects were verified; (B) GO and KEGG enrichment projects were verified; (C) GO enrichment term; (D) GO enrichment term; (E) GO enrichment terms under GSEA analysis; (F) KEGG enrichment terms under GSEA analysis; (G) GO enrichment term; (H) KEGG enrichment item.
In GO analysis, they were mostly concentrated in anion and small molecule binding, eye development, visual system formation, lipid biosynthesis, sensory system formation, DNA methylation. In KEGG analysis, target genes were mostly concentrated in cholesterol metabolism, type 1 diabetes, sphingolipid metabolism, ABC transporters, etc. Figure 5C, 5D are bubble plot P-values of GO-enriched terms. GO enrichment terms under GSEA analysis are shown in Figure 5E, 5F are KEGG enrichment terms. At the aspect of biological process, the DEGs were mainly enriched in the bile secretion, ovarian steroidogenesis, steroid biosynthesis (Figure 5G, 5H). Are bubble plot P-values of KEGG-enriched terms.
Metascape enrichment analysis
Content enriched by Metascape includes GO enrichment terms (Figure 6A), enrichment networks colored by enrichment terms and P values (Figure 6B, 6C), and PPI networks and core modules formed in the Metascape website based on core genes (Figure 7A, 7B).
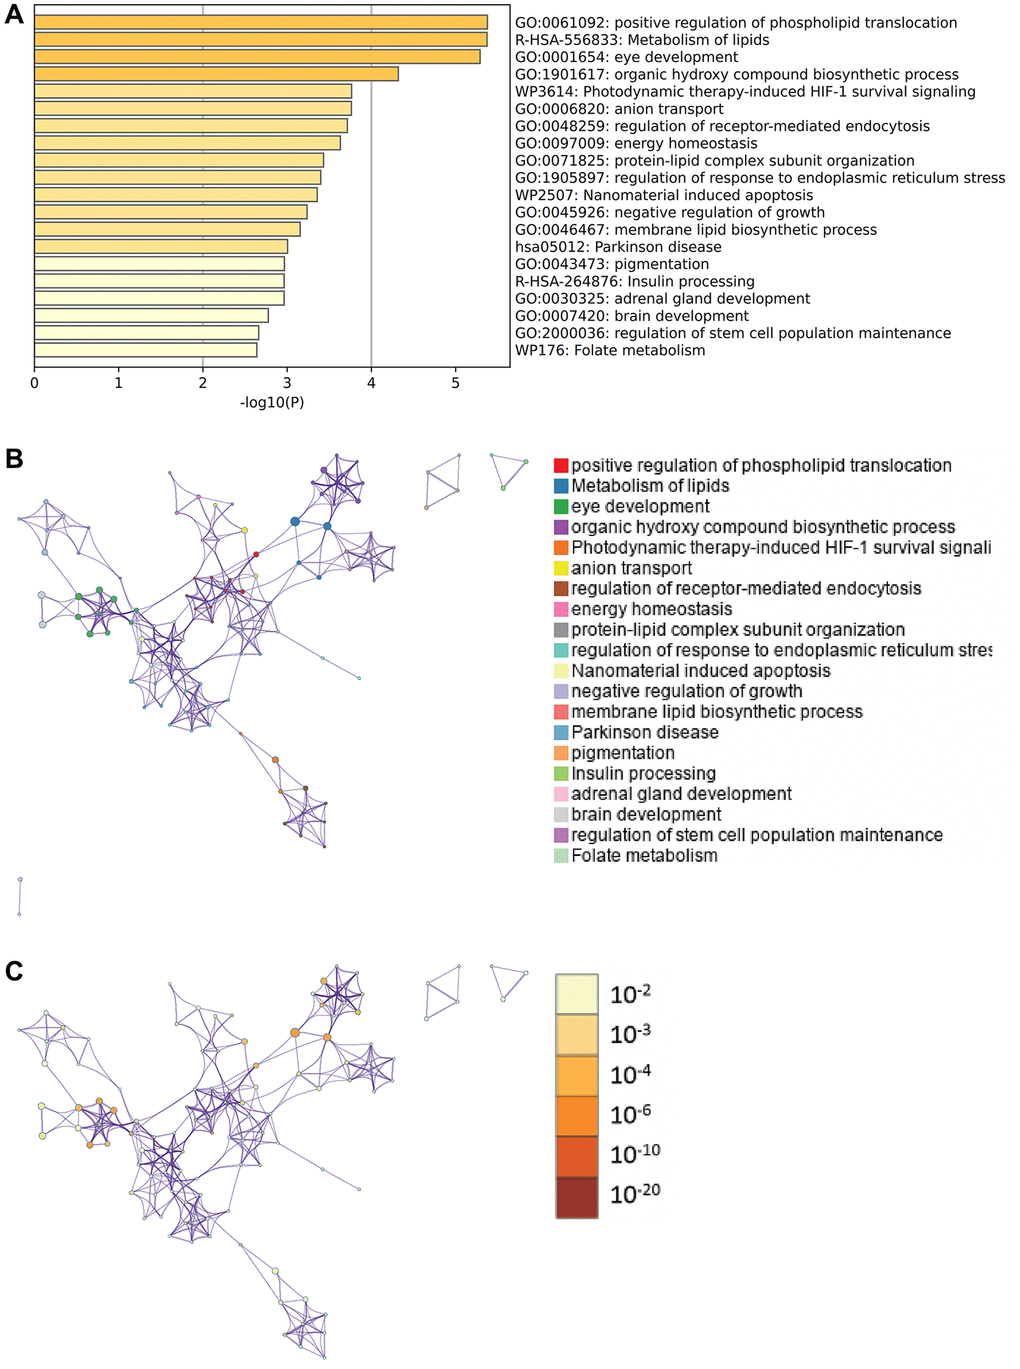
Figure 6. Metascape enrichment analysis. (A) Enrichment of GO; (B) Enrichment networks colored by enrichment terms; (C) Enrichment networks colored by P-value.
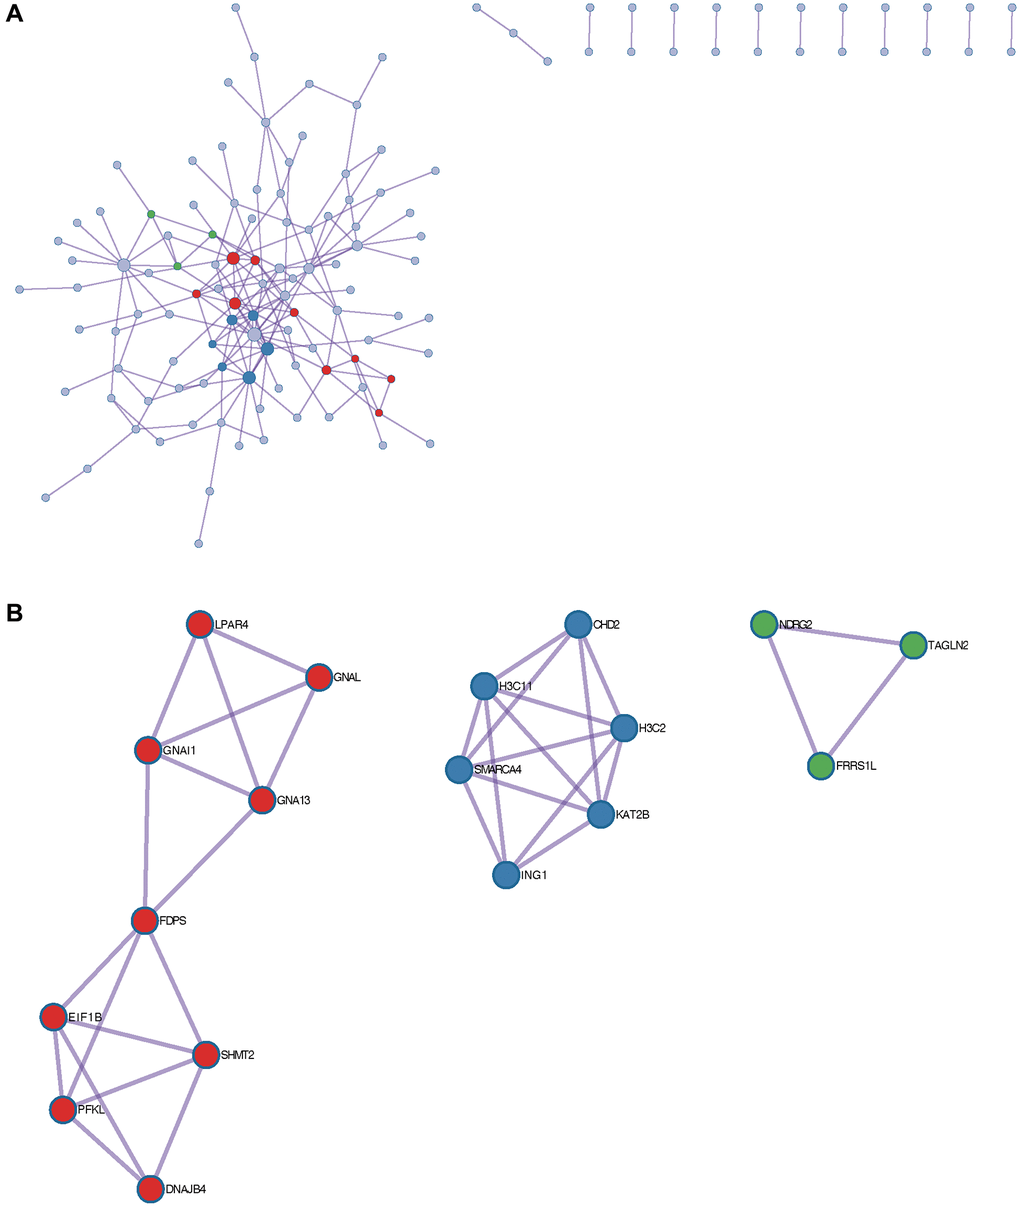
Figure 7. Metascape enrichment analysis. (A) PPI network. (B) 3 core modules.
Survival analysis
We selected 14 core genes with large expression differences to combine KM survival curve and forest plot with the survival data of GSE140082, and MELK and TTK genes had significant prognostic differences (P < 0.05. Figures 8, 9).
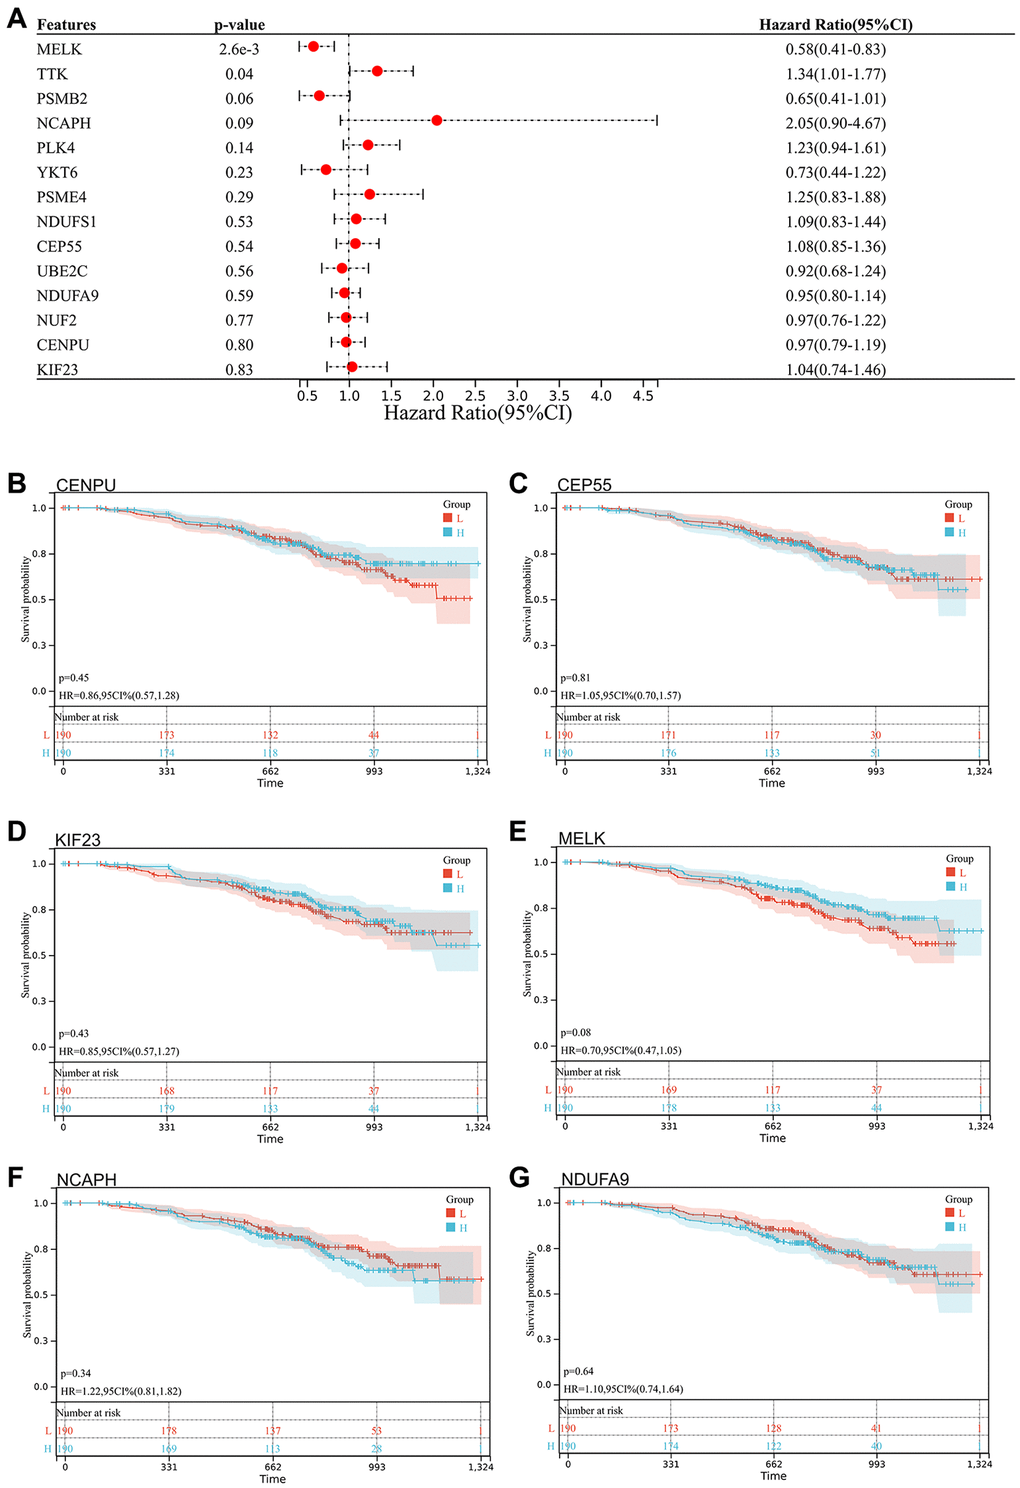
Figure 8. Survival analysis, survivorship curve. (A) Survival data of 14 core genes with significantly different expression and GSE140082; (B) CENPU: p = 0.45, HR = 0.86, 95% CI (0.57, 1.28); (C) CEP55: p = 0.81, HR = 1.05, 95% CI (0.70, 1.57); (D) KIF23: p = 0.43, HR = 0.85, 95% CI (0.57, 1.27); (E) MELK: p = 0.08, HR = 0.70, 95% CI (0.47, 1.05); (F) NCAPH: p = 0.34, HR = 1.22, 95% CI (0.81, 1.82); (G) NDUFA9: p = 0.64, HR = 1.10, 95% CI (0.74, 1.64).
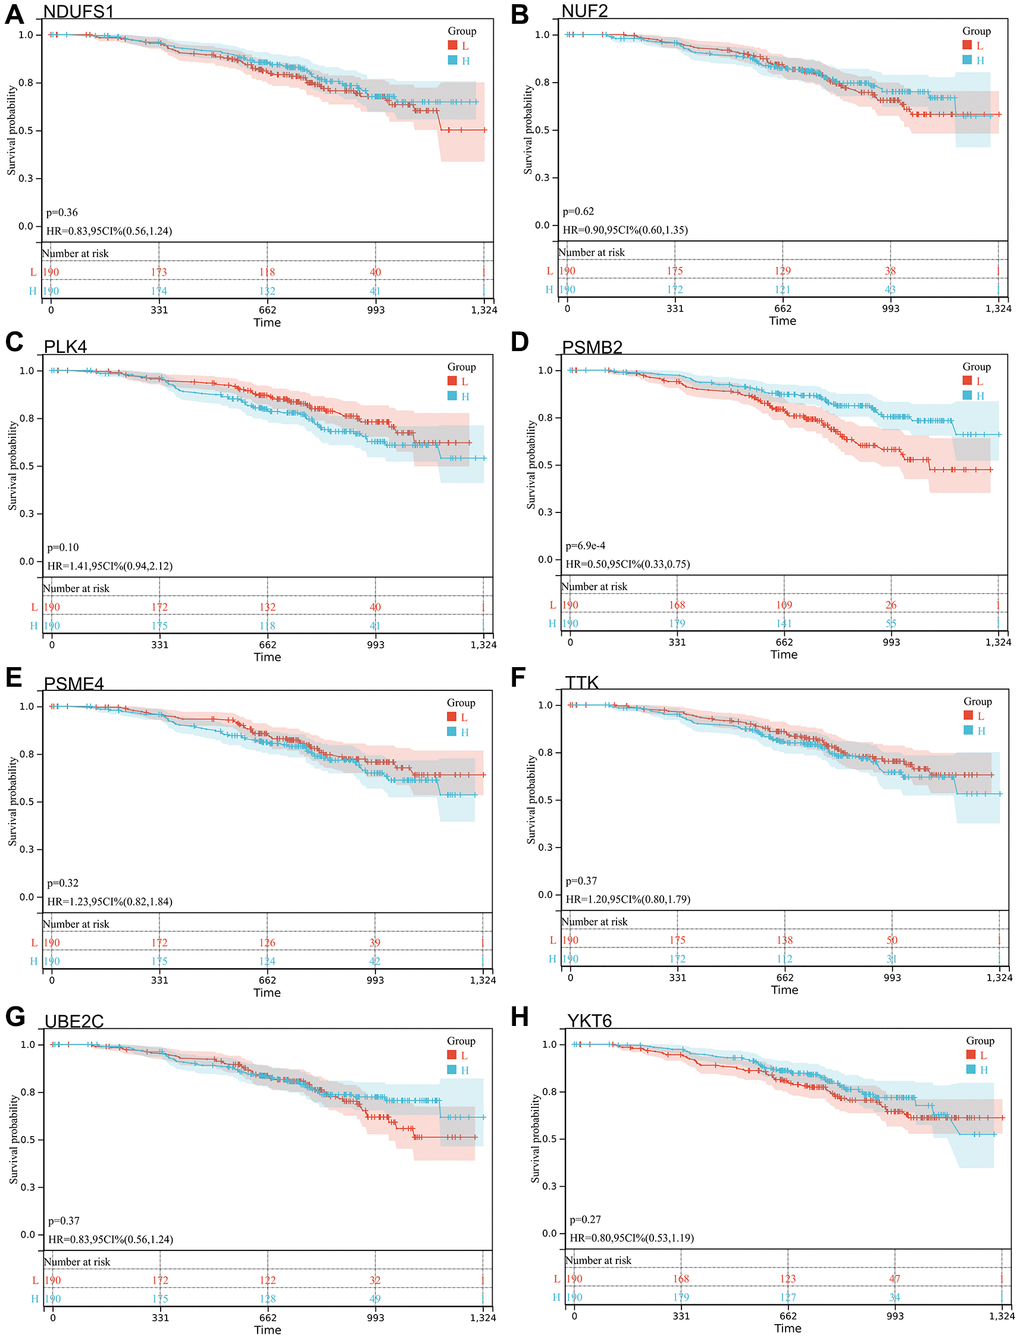
Figure 9. Survival analysis, forest map. (A) NDUFS1: p = 0.36, HR = 0.83, 95% CI (0.56, 1.24); (B) NUF2: p = 0.62, HR = 0.90, 95% CI (0.60, 1.35); (C) PLK4: p = 0.10, HR = 1.41, 95% CI (0.94, 2.12); (D) PSMB2: p = 6.9e-4, HR = 0.50, 95% CI (0.33, 0.75); (E) PSME4: p = 0.32, HR = 1.23, 95% CI (0.82, 1.84); (F) TTK: p = 0.37, HR = 1.20, 95% CI (0.80, 1.79); (G) UBE2C: p = 0.37, HR = 0.83, 95% CI (0.56, 1.24); (H) YKT6: p = 0.27, HR = 0.80, 95% CI (0.53, 1.19).
CTD analysis
In this study, we input the core gene list into the CTD website to search for diseases associated with core genes and improve the understanding of gene-disease association (Figures 10, 11).
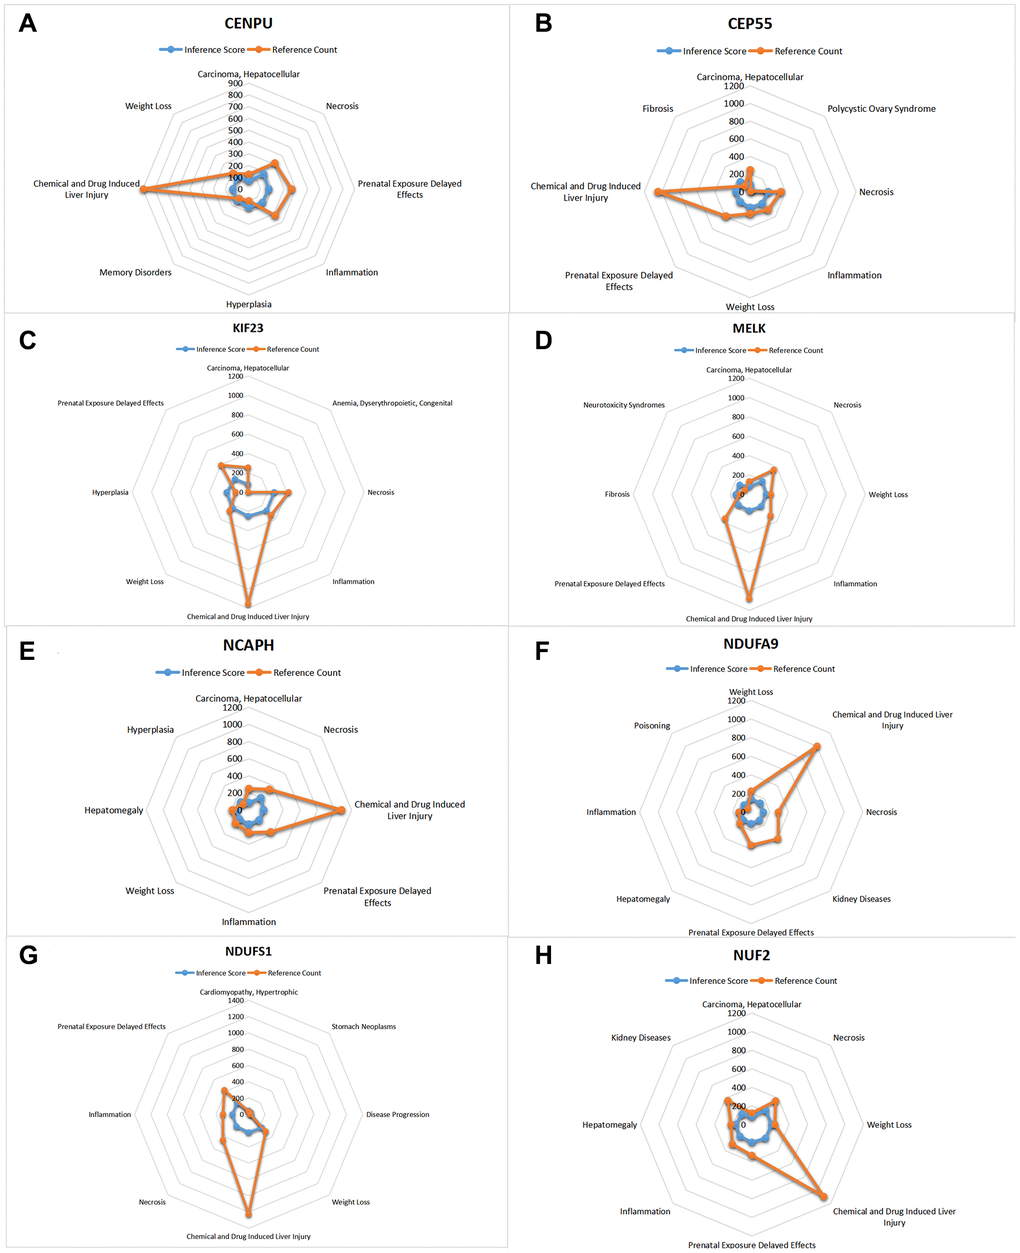
Figure 10. CTD analysis. The list of core genes was entered into the CTD website. (A) CENPU; (B) CEP55; (C) KIF23; (D) MELK; (E) NCAPH; (F) NDUFA9; (G) NDUFS1; (H) NUFE.
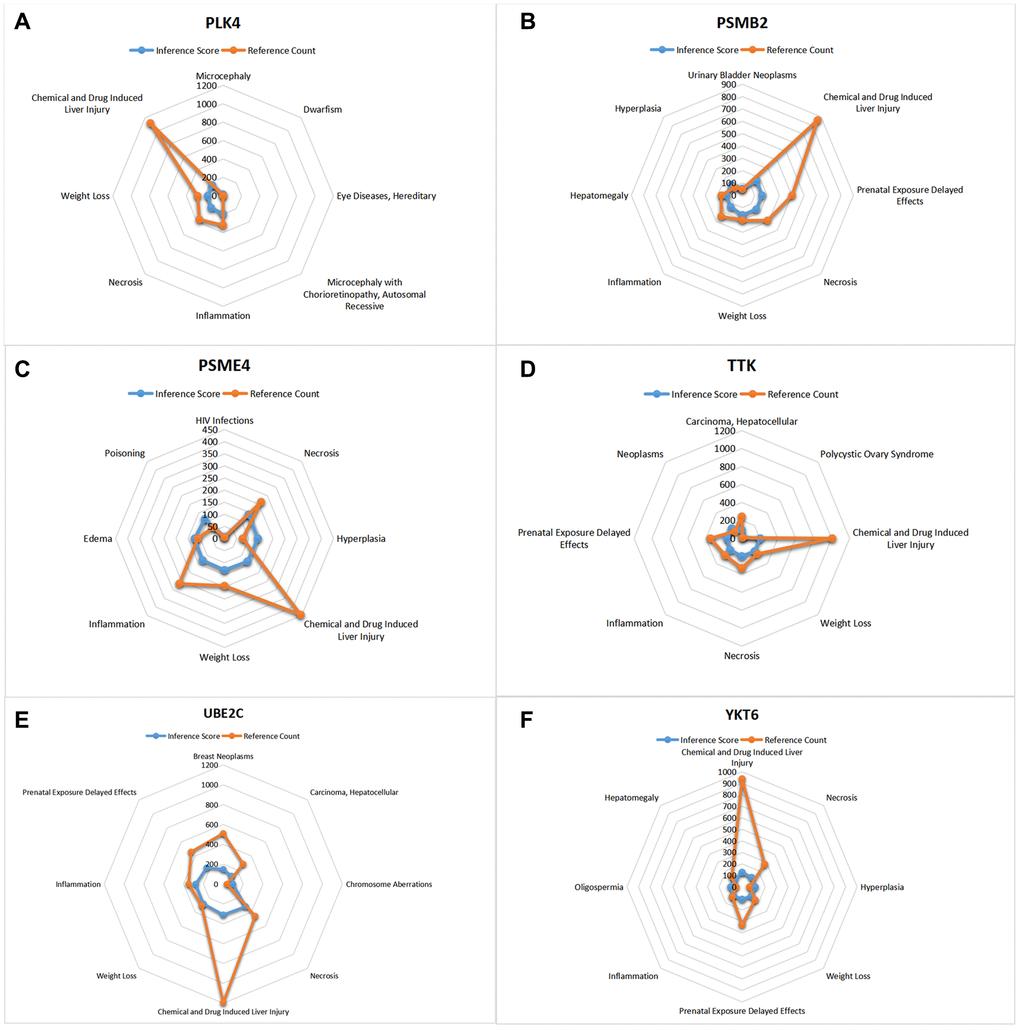
Figure 11. CTD analysis. (A) PLK4; (B) PSMB2; (C) PSME4; (D) TTK; (E) UBE2C; (F) YKT6.
microRNAs analysis
In this study, we input the hub gene list into TargetScan to find relevant miRNA and improve the understanding of gene expression regulation (Table 1).
Table 1. A summary of miRNAs that regulate hub genes.
| Gene | MIRNA | |||
| 1 | PSMB2 | hsa-miR-31-5p | ||
| 2 | PSME4 | hsa-miR-6088 | hsa-miR-143-3p | hsa-miR-4770 |
| 3 | YKT6 | hsa-miR-129-1-3p | hsa-miR-129-2-3p | |
| 4 | NCAPH | hsa-miR-493-5p | ||
| 5 | NDUFS1 | hsa-miR-599 | hsa-miR-320d | hsa-miR-320a |
| 6 | KIF23 | hsa-miR-103a-3p | hsa-miR-107 | |
| 7 | MELK | hsa-miR-802 | ||
| 8 | TTK | hsa-miR-455-3p.1 | ||
| 9 | CEP55 | hsa-miR-144-3p | ||
| 10 | NUF2 | hsa-miR-599 | ||
| 11 | NDUFA9 | none | ||
| 12 | PLK4 | none | ||
| 13 | CENPU | none | ||
| 14 | UBE2C | none | ||
Heat map
Expression of core genes in de-batched matrix was subjected to heat map processing, expression of all genes was up-regulated in tumor group (Figure 12).
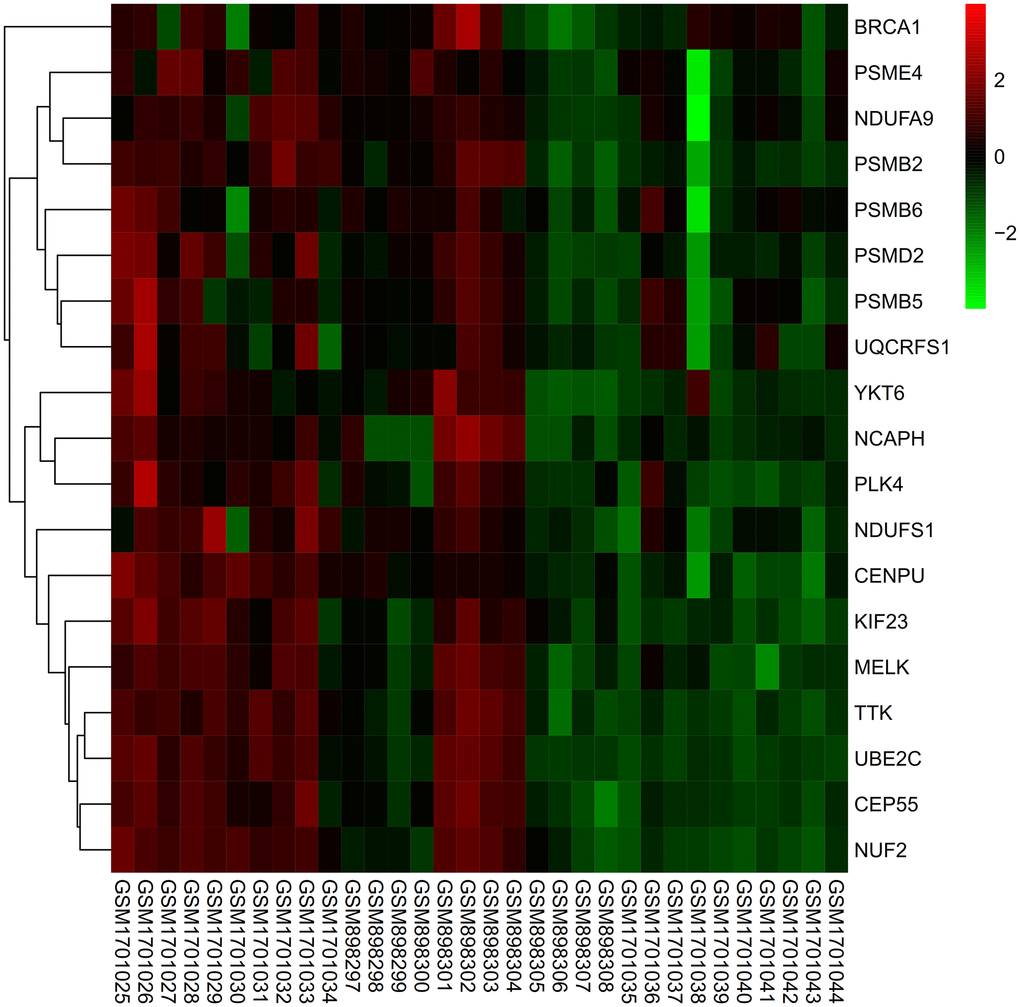
Figure 12. Heat map. The expression levels of all genes were up-regulated in the tumor group.
Western blot (WB)
Western blotting analysis showed that TTK, mTOR, AKT were highly expressed in ovarian cancer (P < 0.05). TTK, mTOR, p-mTOR, AKT, p-AKT, 4EBP1, p-4EBP1, Bcl-2 are highly expressed in ovarian cancer, Bax, Caspase3 are lowly expressed in ovarian cancer, and cell apoptosis is inhibited, leading to the deterioration of ovarian cancer. When TTK, mTOR and AKT were overexpressed, main molecules of apoptotic pathway were more inhibited. Conversely, main molecules of the apoptotic pathway are activated to induce apoptosis in ovarian cancer cells (Figure 13).
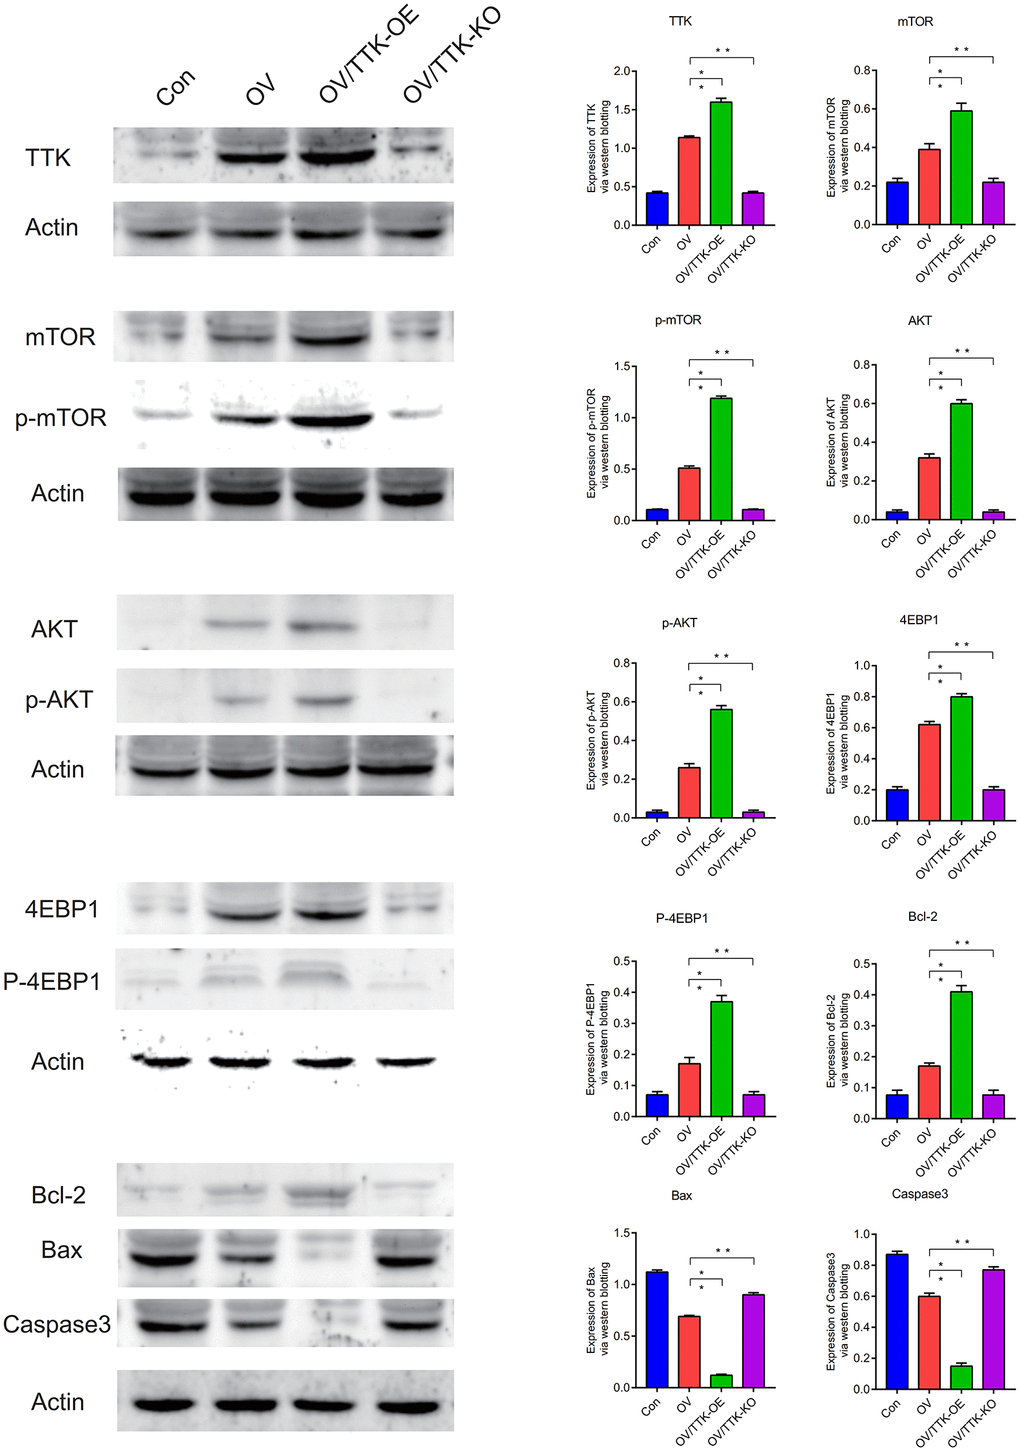
Figure 13. Western blotting. TTK, mTOR, p-mTOR, AKT, p-AKT, 4EBP1, P-4EBP1, Bcl-2, Bax, Caspase3. P < 0.05.
Role of TTK on the renal cancer
Compared with the normal tissues, the expression of TTK in the renal cancer was higher (Figure 14A). There is a positive correlation between expression of TTK and the pathological stage of renal cancer (P < 0.05, Figure 14B). Compared with the renal cancer patients with low expression of TTK, the patients with high expression of TTK have the poor overall survival (P = 0.0021, Figure 14C).
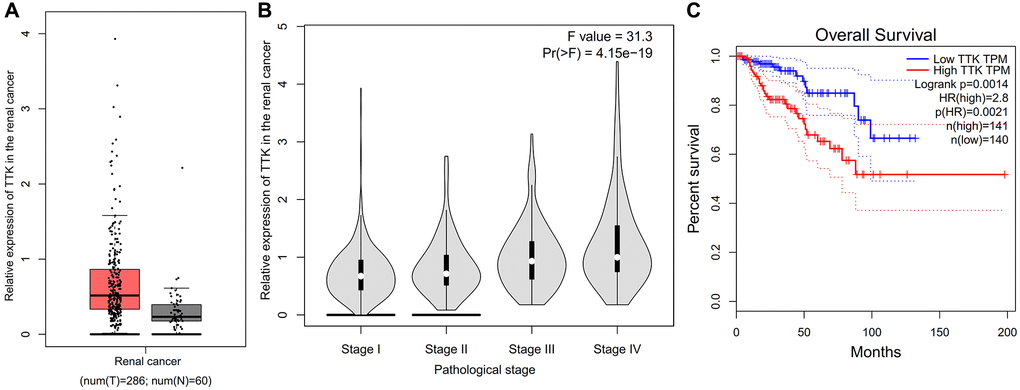
Figure 14. Role of TTK on the renal cancer. (A) Comparison of expression of TTK between normal and renal cancer. (B) Correlation between expression of TTK and the pathological stage of renal cancer. (C) Overall survival of renal cancer.
Discussion
Patients with high expression of TTK in ovarian cancer have unsatisfactory results. KEGG signaling pathway was enriched into multiple metabolic pathways, and these biological processes were related to AKT-mTOR signaling pathway. High expression of TTK inhibited cell apoptosis, thereby leading to tumor enlargement. Furthermore, the TTK was not only the hub biomarker of ovarian cancer, but also one significant hub gene of renal cancer, and its expression was up-regulated in the renal cancer. Compared with the renal cancer patients with low expression of TTK, the patients with high expression of TTK have the poor overall survival (P = 0.0021).
Ovarian cancer and renal cancer are prone to invasive growth and metastasis [12]. Nowadays, ovarian cancer and renal cancer group in China are gradually younger, urban women are more susceptible to disease. Ovarian cancer and renal cancer are of great harm, which not only has a great impact on the patient's physiology and psychology, but also has a high treatment cost, which causes a heavy burden on the patient's family economy.
TTK is a bispecific protein kinase [13, 14]. When it makes too many centrosomes, it has potential to trigger tumors, affecting mitotic spindles [15]. TTK functions in relation to cell proliferation and enhances Aurora kinase B activity [16]. TTK is a regulator of cell cycle, [17], and is linked to tumorigenesis [18]. TTK can help bladder cancer cells activity and mediate epithelial-mesenchymal transition [19]. There is evidence that TTK linked to glioblastoma [20]. Elevated TTK levels lead to centrosome enlargement and chromosomal instability, which leads to tumorigenesis [21, 22]. Therefore, it is possible that TTK has a certain effect on ovarian cancer and renal cancer.
AKT belongs to AGC family of protein kinases [23]. Activity of AKT affects cell function [24], activate protein translation and enhance cell growth, phosphorylates target proteins in cytoplasm and nucleus [25, 26], stimulates cell reproduction [27]. It has been shown that inhibition of Akt can affect tumor cells [28]. Other studies have shown that, AKT is a therapeutic target for cancer [29]. AKT can directly phosphorylate mTOR and act indirectly on mTOR.
The mTOR is the serine/threonine protein kinase [30]. And it acts on signaling pathway of cell reproduction [31], and is influenced by cell signaling [32]. In cells, it exists in form of two different multiprotein complexes. One is mTORC1, it stimulates cell development and is activated primarily via PI3P/AKT pathway [33]. One is mTORC2, it promotes AKT activation through direct phosphorylation of its hydrophobic motif (Ser473) [34]. mTOR kinases are involved in key events that integrate external and internal signals, coordinating cell growth and proliferation. Multiple components of the signaling pathway that signals through mTOR are dysregulated in many cancer types. Therefore, mTOR can be a good entry point for tumor treatment [35].
Akt/mTOR is important signaling pathway of cellular activity, which can regulate cell size, metabolism, motility, so on [36]. PI3K/AKT/mTOR pathway affects normal cellular processes, also have abnormal manifestations in many cancers [37]. It is evidence that, PI3K/Akt/mTOR pathway targets non-small cell lung cancer [38], also affects breast and gastric cancer [37, 39]. Akt/mTOR pathway may be influenced by many factors, its activation has been implicated in pathogenesis of a variety of tumors [40]. Thus, we hypothesized, AKT-mTOR pathway can affect cancer. TTK can affect cancer cells through AKT-mTOR pathway [41]. This supports our point, TTK inhibits apoptosis through AKT-mTOR pathway, which in turn leads to worsening of cancer.
Our investigation also has some shortcomings, we have not conducted clinical validation to solidify this view. We should explore this more next.
In summary, TTK and AKT-mTOR pathways affect ovarian cancer. High TTK expression means poor outcomes for ovarian cancer patients. And TTK was also one significant hub biomarker of renal cancer.
Abbreviations
GEO: gene expression omnibus; WGCNA: weighted gene co-expression network analysis; PPI: protein-protein interaction; GO: Gene Ontology analysis; KEGG: Kyoto Encyclopedia of Genes and Genomes; GSEA: Gene Set Enrichment Analysis; DEGs: differentially expressed Genes; MCODE: Molecular Complex Detection; TTK: TTK Protein Kinase; FC: Fold change; FDR: false discovery rate; MAD: Median Absolute Deviation; TOM: topological overlap matrix; STRING: Search Tool for the Retrieval of Interacting Genes; WB: Western Blot; mTOR: Mammalian Target of Rapamycin.
Author Contributions
Hongrun Chen and Taozhu Fu performed the experiment and significantly contributed to writing and critically revising manuscripts for important intellectual content. Hongrun Chen, Taozhu Fu and Lianfeng Zhang made substantial contributions to research conception. Hongrun Chen, Taozhu Fu and Meini Zuo analyzed the data, and Xiaowen Lou contributed significantly to submitting the manuscript. Bin Liu made contributions to the software and visualization. Hongrun Chen and Taozhu Fu made contributions to the paper equally. All authors read and approved the final manuscript.
Conflicts of Interest
The authors declare no conflicts of interest related to this study.
Ethical Statement
We followed all institutional and national guidelines for the care and use of laboratory animals. And the research complied with Animal Ethics Committee of the Fourth Hospital of Hebei Medical University.
Funding
This research was funded by Youth Fund of China Aerospace Science and Industry Corporation 731 Hospital (2022-QSYN-17).
References
- 1. Penny SM. Ovarian Cancer: An Overview. Radiol Technol. 2020; 91:561–75. [PubMed]
- 2. Rosiello G, Larcher A, Montorsi F, Capitanio U. Renal cancer: overdiagnosis and overtreatment. World J Urol. 2021; 39:2821–3. https://doi.org/10.1007/s00345-021-03798-z [PubMed]
- 3. Stewart C, Ralyea C, Lockwood S. Ovarian Cancer: An Integrated Review. Semin Oncol Nurs. 2019; 35:151–6. https://doi.org/10.1016/j.soncn.2019.02.001 [PubMed]
- 4. Yang C, Xia BR, Zhang ZC, Zhang YJ, Lou G, Jin WL. Immunotherapy for Ovarian Cancer: Adjuvant, Combination, and Neoadjuvant. Front Immunol. 2020; 11:577869. https://doi.org/10.3389/fimmu.2020.577869 [PubMed]
- 5. Morand S, Devanaboyina M, Staats H, Stanbery L, Nemunaitis J. Ovarian Cancer Immunotherapy and Personalized Medicine. Int J Mol Sci. 2021; 22:6532. https://doi.org/10.3390/ijms22126532 [PubMed]
- 6. Tao Z, Shi A, Li R, Wang Y, Wang X, Zhao J. Microarray bioinformatics in cancer- a review. J BUON. 2017; 22:838–43. [PubMed]
- 7. Ibrahim B, McMahon DP, Hufsky F, Beer M, Deng L, Mercier PL, Palmarini M, Thiel V, Marz M. A new era of virus bioinformatics. Virus Res. 2018; 251:86–90. https://doi.org/10.1016/j.virusres.2018.05.009 [PubMed]
- 8. Jelluma N, Brenkman AB, van den Broek NJ, Cruijsen CW, van Osch MH, Lens SM, Medema RH, Kops GJ. Mps1 phosphorylates Borealin to control Aurora B activity and chromosome alignment. Cell. 2008; 132:233–46. https://doi.org/10.1016/j.cell.2007.11.046 [PubMed]
- 9. Lu N, Ren L. TTK (threonine tyrosine kinase) regulates the malignant behaviors of cancer cells and is regulated by microRNA-582-5p in ovarian cancer. Bioengineered. 2021; 12:5759–68. https://doi.org/10.1080/21655979.2021.1968778 [PubMed]
- 10. Zeng Z, Liang J, Wu L, Zhang H, Lv J, Chen N. Exercise-Induced Autophagy Suppresses Sarcopenia Through Akt/mTOR and Akt/FoxO3a Signal Pathways and AMPK-Mediated Mitochondrial Quality Control. Front Physiol. 2020; 11:583478. https://doi.org/10.3389/fphys.2020.583478 [PubMed]
- 11. Xu J, Deng Y, Wang Y, Sun X, Chen S, Fu G. SPAG5-AS1 inhibited autophagy and aggravated apoptosis of podocytes via SPAG5/AKT/mTOR pathway. Cell Prolif. 2020; 53:e12738. https://doi.org/10.1111/cpr.12738 [PubMed]
- 12. Kossaï M, Leary A, Scoazec JY, Genestie C. Ovarian Cancer: A Heterogeneous Disease. Pathobiology. 2018; 85:41–9. https://doi.org/10.1159/000479006 [PubMed]
- 13. Lan W, Cleveland DW. A chemical tool box defines mitotic and interphase roles for Mps1 kinase. J Cell Biol. 2010; 190:21–4. https://doi.org/10.1083/jcb.201006080 [PubMed]
- 14. Combes G, Barysz H, Garand C, Gama Braga L, Alharbi I, Thebault P, Murakami L, Bryne DP, Stankovic S, Eyers PA, Bolanos-Garcia VM, Earnshaw WC, Maciejowski J, et al. Mps1 Phosphorylates Its N-Terminal Extension to Relieve Autoinhibition and Activate the Spindle Assembly Checkpoint. Curr Biol. 2018; 28:872–83.e5. https://doi.org/10.1016/j.cub.2018.02.002 [PubMed]
- 15. Lim G, Huh WK. Rad52 phosphorylation by Ipl1 and Mps1 contributes to Mps1 kinetochore localization and spindle assembly checkpoint regulation. Proc Natl Acad Sci U S A. 2017; 114:E9261–70. https://doi.org/10.1073/pnas.1705261114 [PubMed]
- 16. Kuijt TEF, Lambers MLA, Weterings S, Ponsioen B, Bolhaqueiro ACF, Staijen DHM, Kops GJP. A Biosensor for the Mitotic Kinase MPS1 Reveals Spatiotemporal Activity Dynamics and Regulation. Curr Biol. 2020; 30:3862–70.e6. https://doi.org/10.1016/j.cub.2020.07.062 [PubMed]
- 17. Liu X, Winey M. The MPS1 family of protein kinases. Annu Rev Biochem. 2012; 81:561–85. https://doi.org/10.1146/annurev-biochem-061611-090435 [PubMed]
- 18. Qi G, Ma H, Li Y, Peng J, Chen J, Kong B. TTK inhibition increases cisplatin sensitivity in high-grade serous ovarian carcinoma through the mTOR/autophagy pathway. Cell Death Dis. 2021; 12:1135. https://doi.org/10.1038/s41419-021-04429-6 [PubMed]
- 19. Chen F, Wu P, Hu H, Tian D, Jiang N, Wu C. Protein kinase TTK promotes proliferation and migration and mediates epithelial-mesenchymal transition in human bladder cancer cells. Int J Clin Exp Pathol. 2018; 11:4854–61. [PubMed]
- 20. Wang J, Xie Y, Bai X, Wang N, Yu H, Deng Z, Lian M, Yu S, Liu H, Xie W, Wang M. Targeting dual specificity protein kinase TTK attenuates tumorigenesis of glioblastoma. Oncotarget. 2018; 9:3081–8. https://doi.org/10.18632/oncotarget.23152 [PubMed]
- 21. Silva RD, Mirkovic M, Guilgur LG, Rathore OS, Martinho RG, Oliveira RA. Absence of the Spindle Assembly Checkpoint Restores Mitotic Fidelity upon Loss of Sister Chromatid Cohesion. Curr Biol. 2018; 28:2837–44.e3. https://doi.org/10.1016/j.cub.2018.06.062 [PubMed]
- 22. Benzi G, Camasses A, Atsunori Y, Katou Y, Shirahige K, Piatti S. A common molecular mechanism underlies the role of Mps1 in chromosome biorientation and the spindle assembly checkpoint. EMBO Rep. 2020; 21:e50257. https://doi.org/10.15252/embr.202050257 [PubMed]
- 23. Xie Y, Shi X, Sheng K, Han G, Li W, Zhao Q, Jiang B, Feng J, Li J, Gu Y. PI3K/Akt signaling transduction pathway, erythropoiesis and glycolysis in hypoxia (Review). Mol Med Rep. 2019; 19:783–91. https://doi.org/10.3892/mmr.2018.9713 [PubMed]
- 24. Hua H, Zhang H, Chen J, Wang J, Liu J, Jiang Y. Targeting Akt in cancer for precision therapy. J Hematol Oncol. 2021; 14:128. https://doi.org/10.1186/s13045-021-01137-8 [PubMed]
- 25. Linton MF, Moslehi JJ, Babaev VR. Akt Signaling in Macrophage Polarization, Survival, and Atherosclerosis. Int J Mol Sci. 2019; 20:2703. https://doi.org/10.3390/ijms20112703 [PubMed]
- 26. Zhang M, Zhang X. The role of PI3K/AKT/FOXO signaling in psoriasis. Arch Dermatol Res. 2019; 311:83–91. https://doi.org/10.1007/s00403-018-1879-8 [PubMed]
- 27. Risso G, Blaustein M, Pozzi B, Mammi P, Srebrow A. Akt/PKB: one kinase, many modifications. Biochem J. 2015; 468:203–14. https://doi.org/10.1042/BJ20150041 [PubMed]
- 28. Uko NE, Güner OF, Matesic DF, Bowen JP. Akt Pathway Inhibitors. Curr Top Med Chem. 2020; 20:883–900. https://doi.org/10.2174/1568026620666200224101808 [PubMed]
- 29. Song M, Bode AM, Dong Z, Lee MH. AKT as a Therapeutic Target for Cancer. Cancer Res. 2019; 79:1019–31. https://doi.org/10.1158/0008-5472.CAN-18-2738 [PubMed]
- 30. Yoon MS. mTOR as a Key Regulator in Maintaining Skeletal Muscle Mass. Front Physiol. 2017; 8:788. https://doi.org/10.3389/fphys.2017.00788 [PubMed]
- 31. Deleyto-Seldas N, Efeyan A. The mTOR-Autophagy Axis and the Control of Metabolism. Front Cell Dev Biol. 2021; 9:655731. https://doi.org/10.3389/fcell.2021.655731 [PubMed]
- 32. Suto T, Karonitsch T. The immunobiology of mTOR in autoimmunity. J Autoimmun. 2020; 110:102373. https://doi.org/10.1016/j.jaut.2019.102373 [PubMed]
- 33. Rabanal-Ruiz Y, Otten EG, Korolchuk VI. mTORC1 as the main gateway to autophagy. Essays Biochem. 2017; 61:565–84. https://doi.org/10.1042/EBC20170027 [PubMed]
- 34. Szwed A, Kim E, Jacinto E. Regulation and metabolic functions of mTORC1 and mTORC2. Physiol Rev. 2021; 101:1371–426. https://doi.org/10.1152/physrev.00026.2020 [PubMed]
- 35. Murugan AK. mTOR: Role in cancer, metastasis and drug resistance. Semin Cancer Biol. 2019; 59:92–111. https://doi.org/10.1016/j.semcancer.2019.07.003 [PubMed]
- 36. Alzahrani AS. PI3K/Akt/mTOR inhibitors in cancer: At the bench and bedside. Semin Cancer Biol. 2019; 59:125–32. https://doi.org/10.1016/j.semcancer.2019.07.009 [PubMed]
- 37. Fattahi S, Amjadi-Moheb F, Tabaripour R, Ashrafi GH, Akhavan-Niaki H. PI3K/AKT/mTOR signaling in gastric cancer: Epigenetics and beyond. Life Sci. 2020; 262:118513. https://doi.org/10.1016/j.lfs.2020.118513 [PubMed]
- 38. Tan AC. Targeting the PI3K/Akt/mTOR pathway in non-small cell lung cancer (NSCLC). Thorac Cancer. 2020; 11:511–8. https://doi.org/10.1111/1759-7714.13328 [PubMed]
- 39. Miricescu D, Totan A, Stanescu-Spinu II, Badoiu SC, Stefani C, Greabu M. PI3K/AKT/mTOR Signaling Pathway in Breast Cancer: From Molecular Landscape to Clinical Aspects. Int J Mol Sci. 2020; 22:173. https://doi.org/10.3390/ijms22010173 [PubMed]
- 40. Akbarzadeh M, Mihanfar A, Akbarzadeh S, Yousefi B, Majidinia M. Crosstalk between miRNA and PI3K/AKT/mTOR signaling pathway in cancer. Life Sci. 2021; 285:119984. https://doi.org/10.1016/j.lfs.2021.119984 [PubMed]
- 41. Huang H, Yang Y, Zhang W, Liu X, Yang G. TTK regulates proliferation and apoptosis of gastric cancer cells through the Akt-mTOR pathway. FEBS Open Bio. 2020; 10:1542–9. https://doi.org/10.1002/2211-5463.12909 [PubMed]