


Introduction
During the progression of advanced tumors, the body is often in a hypercoagulable state for various reasons. Cancer-related thrombosis is the leading cause of non-cancer mortality in malignancies [1]. In addition, coagulation-related factors also seem to influence the occurrence and development of tumors and the remodeling of microenvironment. Studies have confirmed that platelets can promote the distant metastasis of tumor cells by promoting epithelial-mesenchymal transformation of tumor cells [2]. In a research of colorectal cancer, the researchers found that an increase in fibrinogen levels was positively correlated with colorectal cancer as an independent risk factor [3]. Thrombin-related factors are closely related to tumor angiogenesis and tumor migration [4]. However, the current evidence mainly focuses on basic experiments and animal experiments, and has not been studied in clinical cohorts. In addition, the important role of coagulation-related factors in bladder cancer has not been reported yet.
It has been proved feasible to construct a risk signature with the expression of key genes to monitor the tumor and its microenvironment state [5–7]. We divided bladder cancer into two states of hypercoagulability and low coagulation by clustering coagulation-related genes, and we found that hypercoagulability presaged a poor prognosis of bladder tumors. Through further screening for coagulation-related differentially expressed genes and constructing risk signature, we found that hypercoagulable state is closely related to tumor angiogenesis, cancer cell proliferation, EMT transformation, and immune microenvironment remodeling.
Materials and Methods
Patients and cohorts
The bladder cancer cohort from the Cancer Genome Atlas (TCGA) and GSE13057 database included information from 406 and 165 bladder cancer patients, respectively [8, 9]. The bladder cancer data set treated with PD1/PDL1 was derived from the Imvigor 210 data set and the GSE176307 data set for 298 and 88 patients, respectively [10, 11]. TCGA, GEO and Imvigor 210 are public databases in which patients have been ethically approved. Our research is based on open source data, so there are no ethical issues or other conflicts of interest. In our data screening process, cases with clinical information including survival state, survival time, clinical grade and stage, and complete information on genomic RNA sequence data met the inclusion criteria. Patients with incomplete information were removed. Data of the patients were downloaded through the Gene Expression Omnibus (GEO) database (https://www.ncbi.nlm.nih.gov/geo/) and TCGA database (https://portal.gdc.cancer.gov/repository). The data of Imvigor 210 was down were downloaded from (http://research-pub.gene.com/IMvigor210CoreBiologies). All genomic RNA sequence data were converted to transcripts per kilobase of exon model per million mapped reads (TPM), and standardize it by log2 [12].
Analysis of lymphocyte infiltration in tumor immune microenvironment
We calculated the infiltrating abundance of lymphocytes in each tumor sample using the cibersort deconvolution algorithm (CIBERSORT (https://cibersort.stanford.edu/) and its own LM22 lymphocyte genetic characteristics [20]. The obtained results are filtered (p < 0.05). The difference of infiltration between subgroups was evaluated by rank sum test, and the correlation between infiltration degree and risk score was evaluated by Pearson correlation.
Functional and pathway enrichment analysis
Coagulation-related signature was analyzed using the Cluster Profiler software package for gene annotation enrichment analysis [21]. The Kyoto Encyclopedia of Genes and Genomes (KEGG) and the Gene Ontology (GO) functional enrichment analyses were carried out to clarify the biological function and behavior of coagulation-related signature. The GSEA was used to show the potential pathways and mechanisms between high-risk and low-risk subgroups.
Statistical analysis
R software (R version 4.0.2 (2020-06-22)) was used for all analyses and graphics generated in this study. Inter-group comparisons were performed using the Kruskal-Wallis and t tests. If the normal distribution is satisfied, t-test is used. If the distribution is non-normal, Kruskal-Wallis test is used. Correlations were analyzed using the and Spearman correlation coefficient. Log-rank test, Cox regression and Kaplan-Meier curve were used to evaluate the prognostic value. All statistical analyses were bilateral, P-values < 0.05 were considered statistically significant.
Results
Coagulation status of bladder cancer is closely related to survival prognosis and tumor microenvironment changes
We divided bladder tumors into two subcategories according to the coagulation state by K-means clustering (Figure 1A–1D). At the same time, we analyzed the differences in survival outcomes between two different subclasses. The results suggest that hypercoagulable state of bladder cancer (cluster 2) is significantly associated with poor prognosis (p = 0.02) (Figure 1E). A total of 1792 significantly differentially expressed genes were screened, including 561 downregulated and 1231 upregulated (|log2FC| > 1, FDR < 0.05; Figure 1F). The results of GO and KEGG suggested that biological function was mainly enriched in the extracellular matrix, immune-related pathways, and complement and coagulation cascade pathways (Figure 1G, 1H). In addition, there were significant differences in the matrix, immune, and Estimate scores between the two subgroups (p < 0.001). In addition, the abundance of B cell and T cell infiltration in the immune microenvironment with low coagulation state was higher, while the abundance of macrophage infiltration in the high coagulation state was relatively higher (p < 0.001) (Figure 1H–1J). For immune-related pathways, the hypercoagulable state was also significantly different from the hypocoagulable state (p < 0.001) (Figure 1K). These results suggest that the coagulation state of the tumor plays an important role in various biological behaviors of the tumor and the composition of the tumor immune microenvironment.
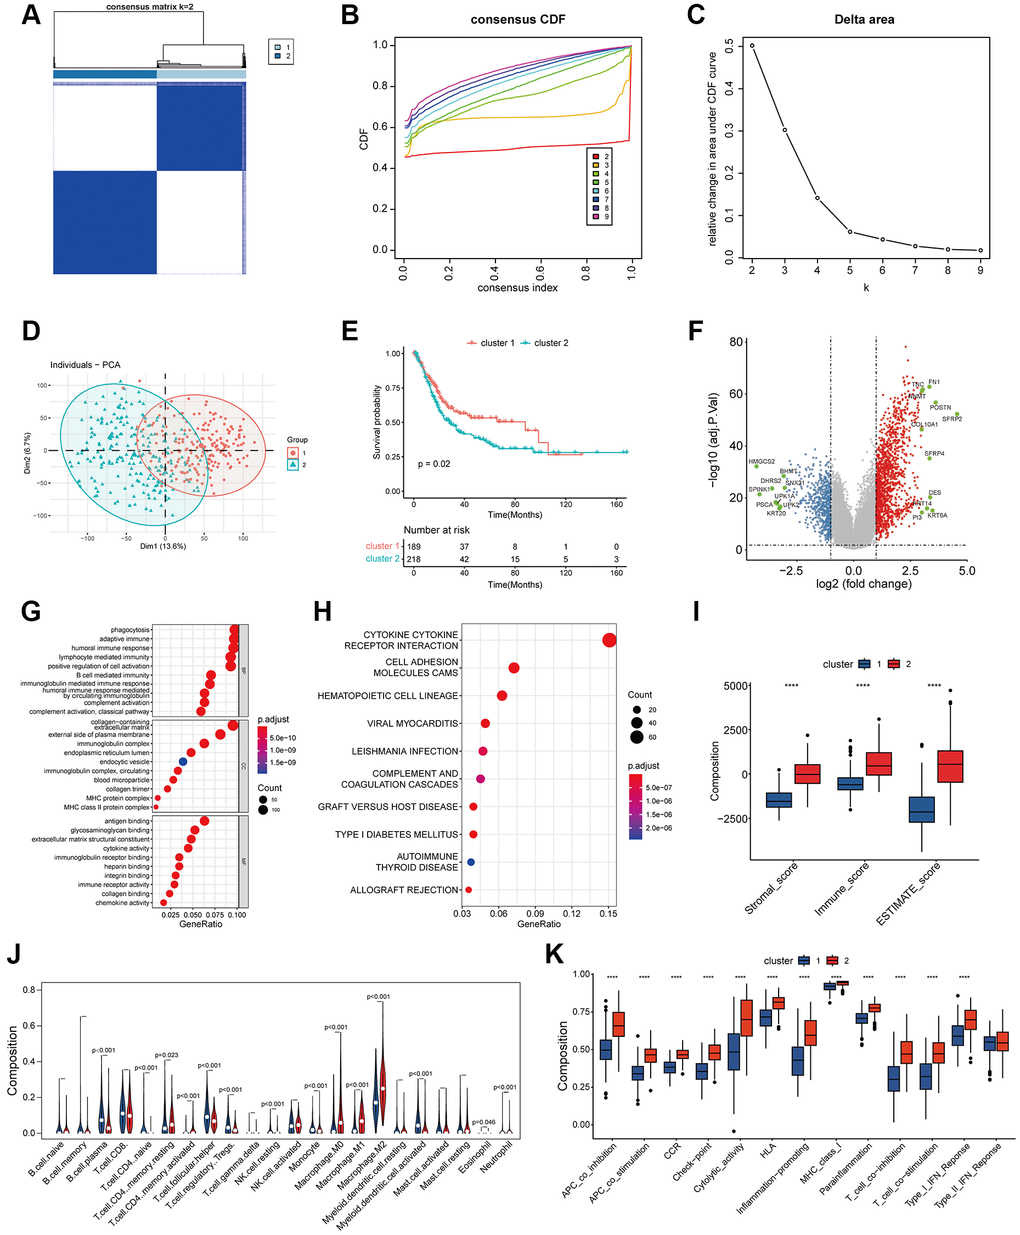
Figure 1. Classification of coagulation subgroups in bladder cancer. (A–C) The result of consensus matrix (A), consensus CDF (B) and delta area plot (C) suggested that the optimal value of K should be 2, which means it was most appropriate to divide all patients into two subtypes. (D) PCA classification of coagulation subtypes in bladder cancer. (E) K-M survival curve of coagulation subtypes in bladder cancer. The results suggest that hypercoagulable state of bladder cancer is significantly associated with poor prognosis. (F) Differentially expressed genes of coagulation subtypes in bladder cancer. Statistically significant genes were considered to meet the inter-group |log2-fold change (FC)|> 1 and error detection rate (FDR) < 0.05. (G) GO analysis suggested that biological function between coagulation subtypes was mainly enriched in the extracellular matrix, immune-related pathways, and complement and coagulation cascade pathways. (H) KEGG suggested that biological function between coagulation subtypes was mainly enriched in the extracellular matrix, immune-related pathways, and complement and coagulation cascade pathways. (I) The results of Estimate analysis suggest that hypercoagulable state has higher stromal score and estimate score. (J) Lymphocyte infiltration analysis of coagulation subtypes. The abundance of B cell and T cell infiltration with low coagulation state was higher, while the abundance of macrophage infiltration in the high coagulation state was relatively higher. (K) ssGSEA analysis of coagulation subtypes. APC-co-inhibition, check-point, HLA, MHC, T_cell and IFN displayed higher expression in the high coagulation state.
Establishment and verification of coagulation risk signature
We simultaneously constructed a coagulation-related risk signature by screening differentially expressed genes in different coagulation subtypes of bladder cancer and using the lasso-cox method (Figure 2A–2C). We split the TCGA data set into a training set and an internal verification set, and preliminarily verified the obtained risk signature. Our risk signature provides good predictability in both data sets. The area under the curve (AUC) in the training set was 0.76, and the KM curve suggested that the prognosis of patients in the high-risk and low-risk groups was significantly distinguished (HR = 3.28, p < 0.001). The AUC of the internal validation set was 0.74, and the prognosis of patients in the high-risk and low-risk groups was also well distinguished (HR = 3.5, p < 0.001). (Figure 2D, 2E). In order to further verify the sensitivity of our classifier, we made an in-depth analysis of the data of 165 bladder cancer patients in GSE13507 as an external validation set. In the overall data set of TCGA, the prognosis of patients in high and low risk groups is well differentiated (HR = 3.43, p < 0.001), and the AUC of one year, three years and five years are 0.75, 0.79 and 0.75 respectively (Figure 3A–3C). In the external validation set, the difference of prognosis between high and low risk groups was also statistically significant (HR = 1.67, p = 0.031), and the AUC of one year, three years and five years were 0.77, 0.64 and 0.6 respectively (Figure 3D–3F). Multivariate regression results suggested that our risk signature was an independent prognostic factor, whether in the TCGA dataset or in the external validation set (Figure 3G, 3H).
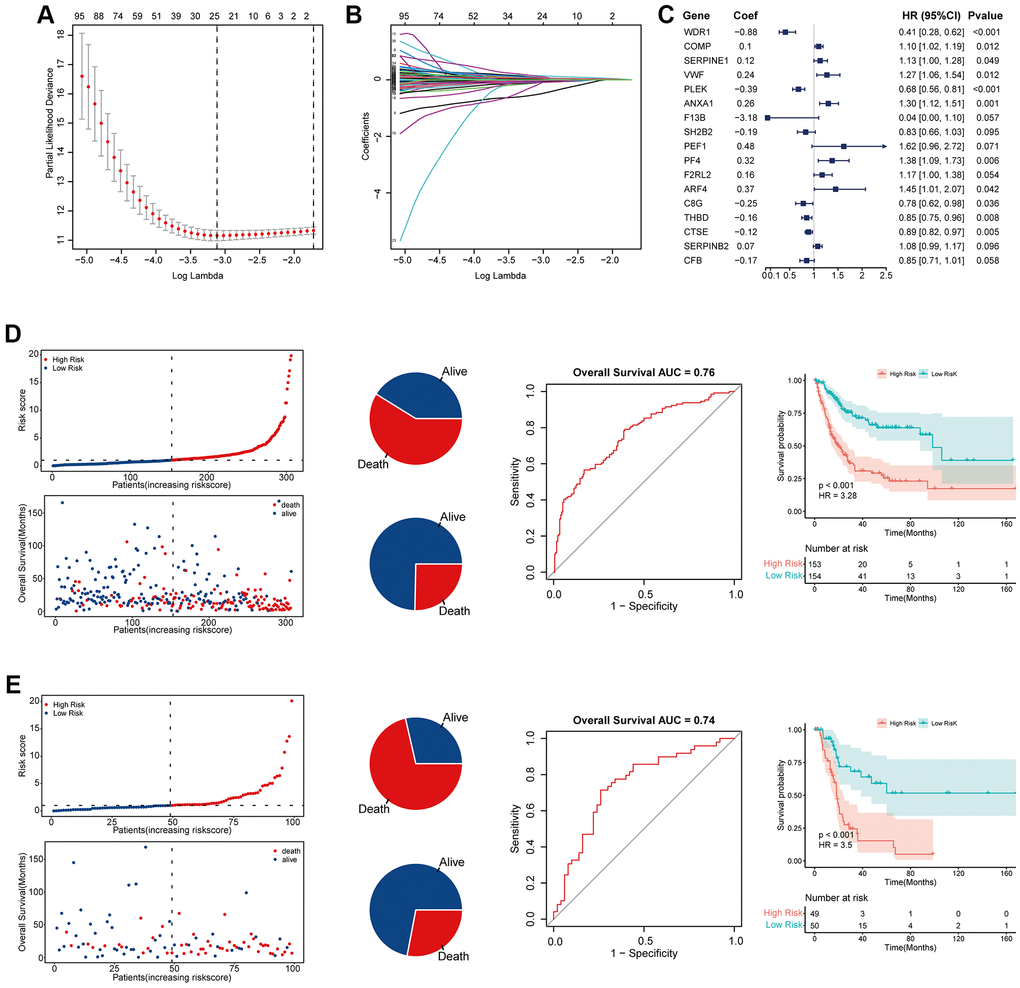
Figure 2. Establishment and validation of coagulation-related risk signature. (A) Least absolute shrinkage and selection operator cox analysis of the DEGs. (B) Partial likelihood deviance coefficient profiles. (C) Forest map of the variables contained in the risk signature. (D) Risk factor diagram, ROC curve and KM curve of the risk signature in the training set. The AUC of ROC curve is 0.76, while HR of KM curve is 3.28, p < 0.001. (E) Risk factor diagram, ROC curve and KM curve of the risk signature in the internal test set. The AUC of ROC curve is 0.74, while HR of KM curve is 3.5, p < 0.001.
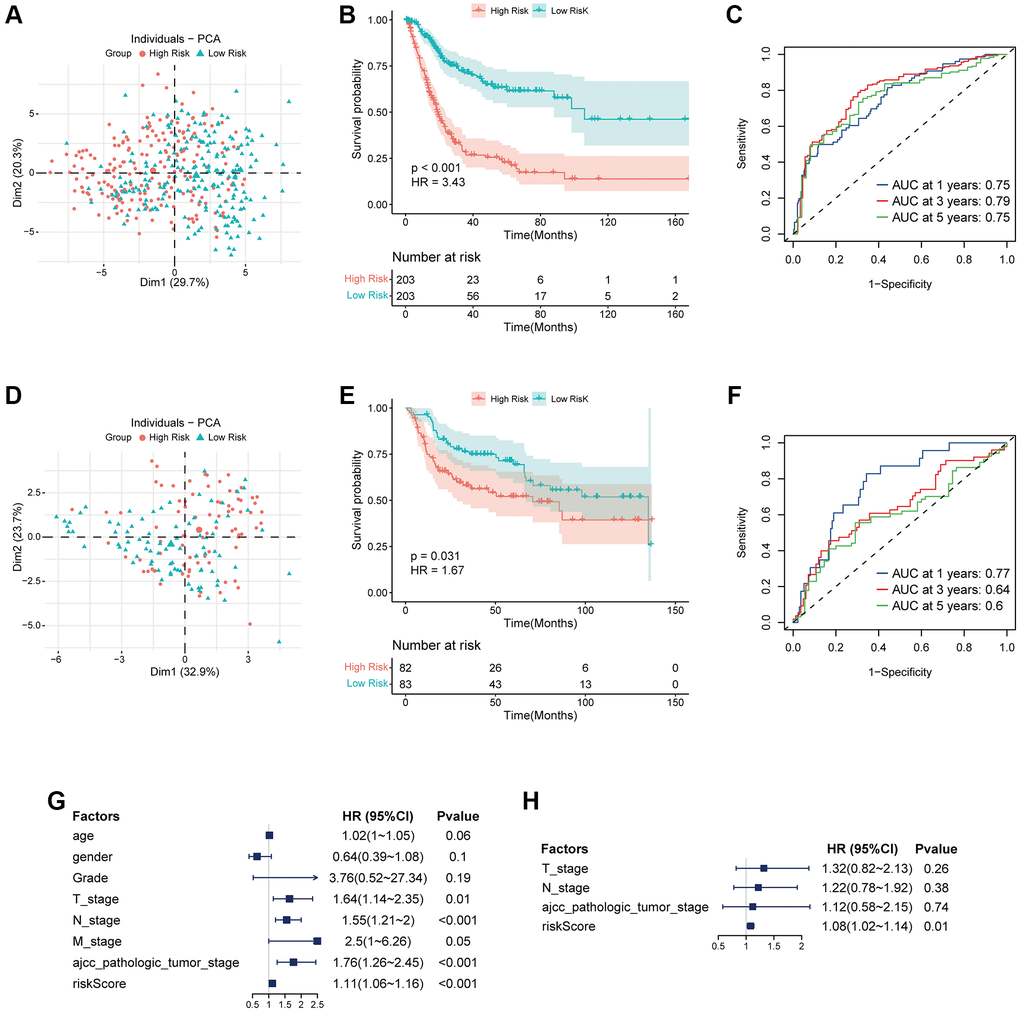
Figure 3. Validation of coagulation-related risk signature in TCGA set and external validation set. (A–C) PCA classification map, K-M curve, and ROC curve in TCGA dataset. The 1-year, 3-year, 5-year AUC of ROC curve is 0.75, 0.79, 0.75, respectively, while HR of KM curve is 3.43, p < 0.001. (D–F) PCA classification map, K-M curve, and ROC curve in external validation dataset. The 1-year, 3-year, 5-year AUC of ROC curve is 0.77, 0.64, 0.6, respectively, while HR of KM curve is 1.67, p = 0.031. (G) Multivariate COX regression forest map in TCGA dataset. Riskscore is an independent risk factor for prognosis. HR = 1.11, p < 0.001. (H) Multivariate COX regression forest map in external validation dataset. Riskscore is an independent risk factor for prognosis. HR = 1.08, p = 0.01.
The high risk associated with coagulation is closely related to tumor proliferation, angiogenesis, and immune microenvironment inhibition
To further analyze the correlation between our risk signature and clinical phenotype, we collected clinical information on TCGA bladder tumors and associated phenotypic markers for further analysis. The higher coagulation-related risks were strongly associated with a higher pathological grade of the tumor (p = 0.046), a higher clinical stage of AJCC (p < 0.001), a higher T stage (p < 0.001), and a higher risk of lymph node metastasis (p < 0.001) (Figure 4A–4G). The results of the GSEA pathway enrichment analysis suggested that the angiogenic pathways in the tumor were significantly activated (Figure 4H). Pearson correlation analysis suggested that the risk score was strongly correlated with angiogenesis in the tumor (p < 0.001, R = 0.32) (Figure 4I). In addition, the risk score was also correlated with tumor coagulation status and cell mitotic cycle (Figure 4J). Finally, we analyzed the correlation between the risk score and the above related molecular markers, and found that the risk score correlated with VWF (p = 0.002, R = 0.15), PECAM1 (p = 0.057, R = 0.09), and MKI67 (p = 0.015, R = 0.12) (Figure 4K–4M).
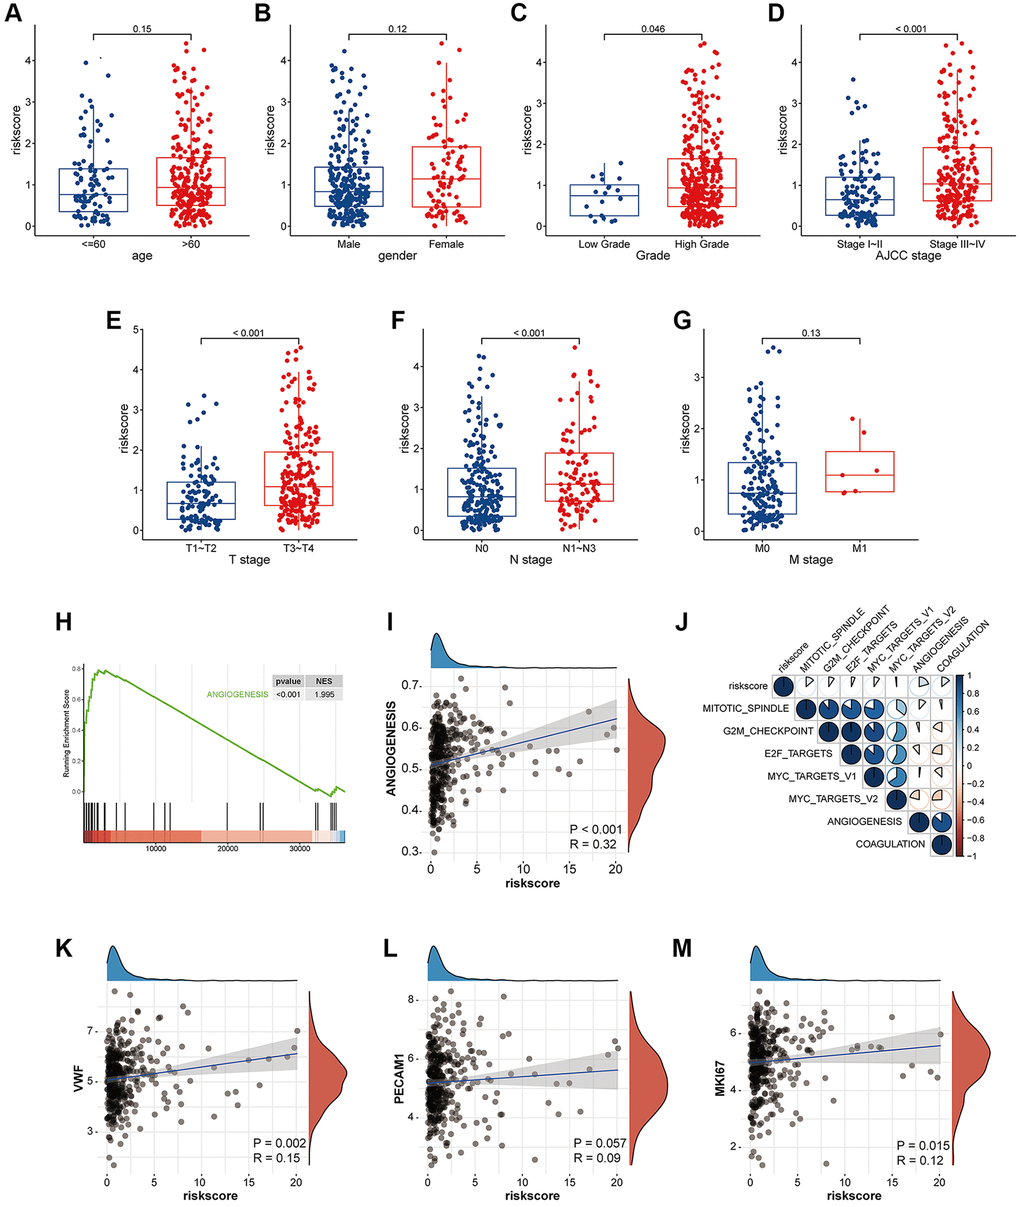
Figure 4. The risk signature is closely related to tumor proliferation, metastasis, coagulation and angiogenesis. (A–G) Box plot of coagulation related risk score by age, gender, pathological grade, AJCC stage, TNM stage. A higher risk score means a higher T, N, AJCC-Stage and a higher grade. The difference was statistically significant. (H) GSEA pathways were enriched for angiogenesis based on coagulation-related risk score. NES = 1.995, p < 0.001. (I) Coagulation-related risk score was strongly positively correlated with angiogenesis. R = 0.32, p < 0.001. (J–M) The coagulation-related risk score was correlated with tumor proliferation, coagulation, and angiogenesis.
Hypercoagulability-related risk signature was closely related to tumor immune microenvironment inhibition
To further clarify the biological role of the coagulation-related risk signature, we performed GO, KEGG, and GSEA enrichment analyses. The results suggested that the hypercoagulable state not only had a great effect on coagulation-related pathways and proliferation-related pathways that had already been EMT, but also had a great inhibitory effect on the immune microenvironment of tumors (Figure 5, Supplementary Figure 1). For example, TGFβ-β and WNT-β catenin pathways are all activated in hypercoagulable state. The matrix score of the high-risk group was significantly higher than that of the low-risk group, the infiltration abundance of B cells and T cells was significantly lower than that of the risk group, and the infiltration abundance of macrophages was significantly higher than that of the low-risk group. The IGS score and immune related molecular markers also indicated that the low-risk group had significantly better response effects than the high-risk group (Figure 6, Supplementary Figure 2).
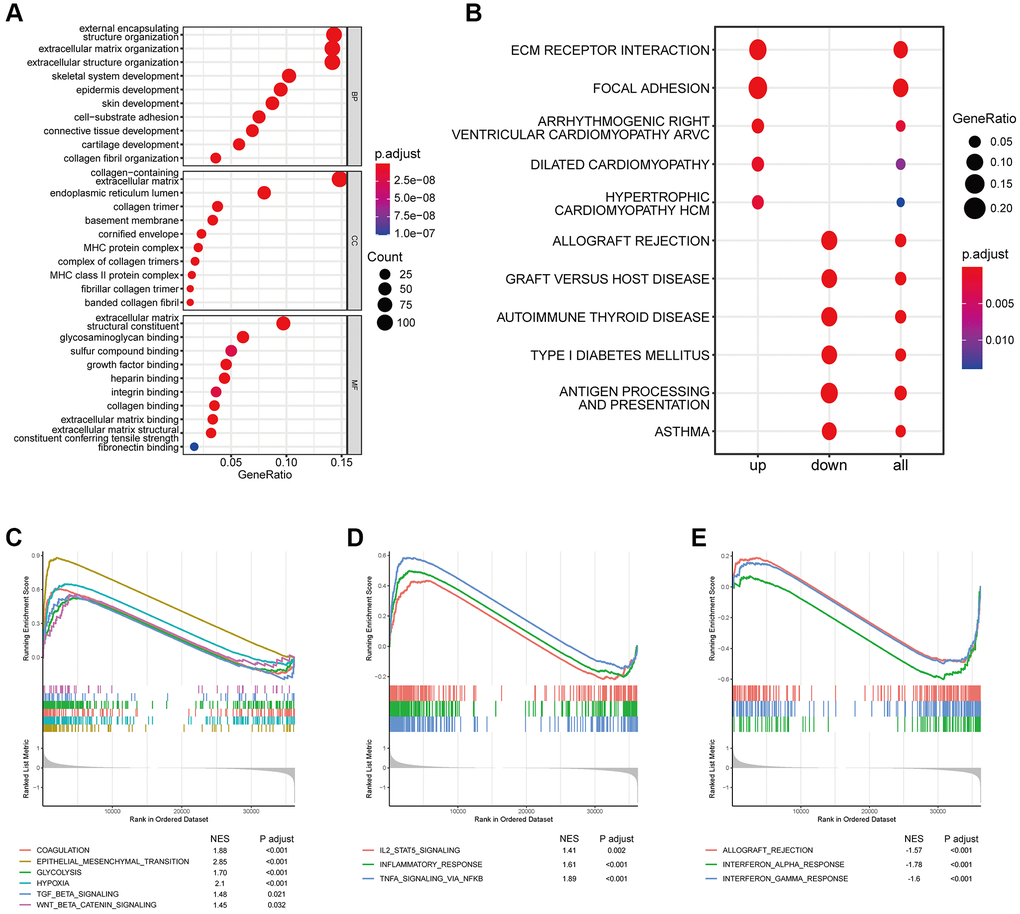
Figure 5. Effects of abnormal expression of coagulation-related genes on immune-related pathways. (A) GO analysis based on coagulation-related risk signature mainly enriched in the extracellular matrix pathways and MHC pathways. (B) KEGG analysis based on coagulation-related risk signature mainly enriched in the ECM receptor interaction pathways. (C) GSEA pathways were enriched for coagulation, EMT, hypoxia, WNTb-catenin, TGF-b pathways based on coagulation-related risk signature. (D) GSEA pathways were enriched for IL2-STAT, inflammatory response pathways based on coagulation-related risk signature. (E) GSEA pathways were enriched for IFNG pathways based on coagulation-related risk signature.
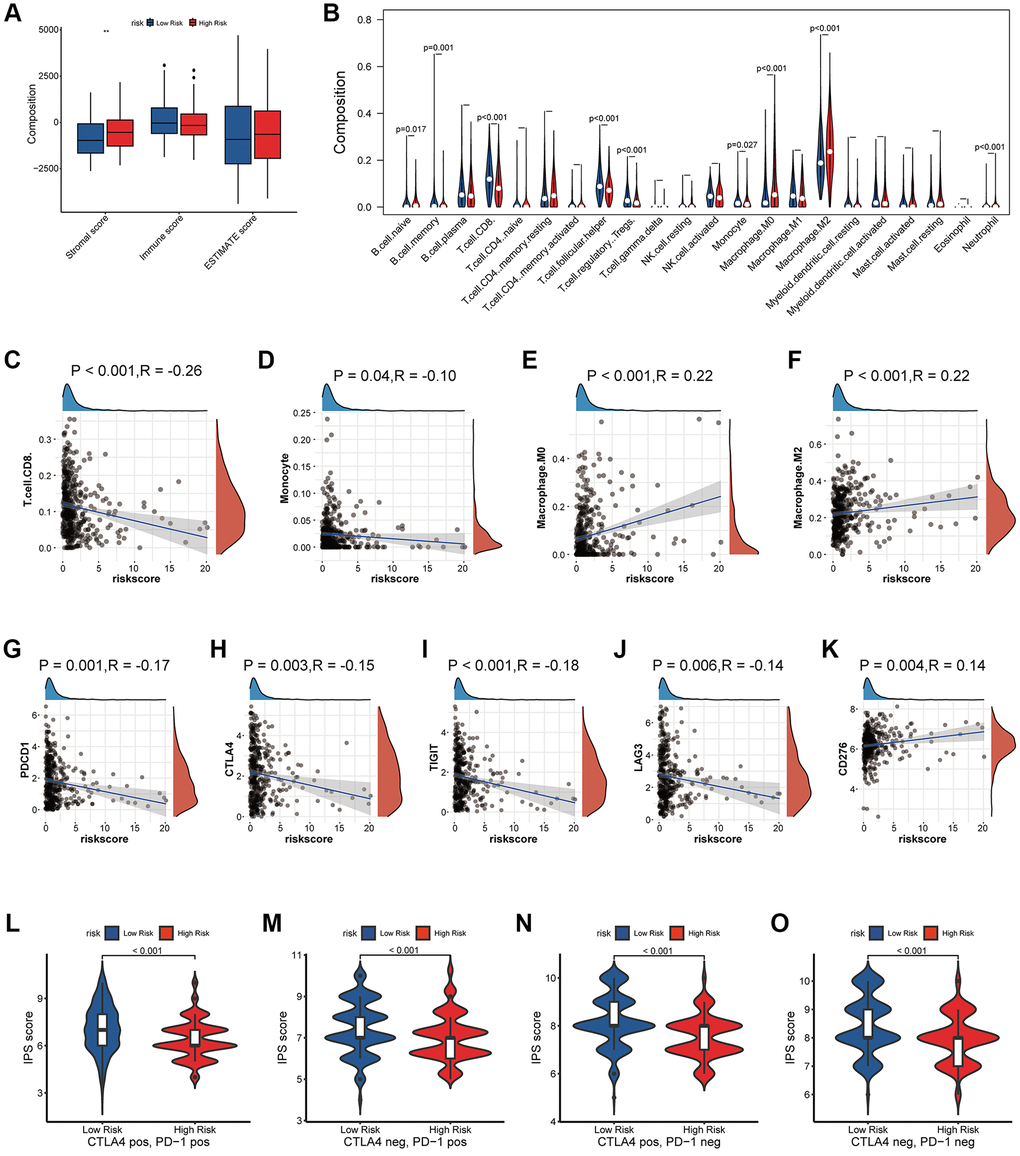
Figure 6. Effects of abnormal expression of coagulation-related genes on tumor immune microenvironment. (A) Estimate socre analysis based on coagulation-related risk signature. (B–F) Lymphocyte infiltration analysis based on coagulation-related risk signature. (G–K) Correlation analysis between coagulation-related risk score and immune checkpoint markers. (L–O) IPS score analysis based on coagulation-related risk signature.
Coagulation-related risk signature predict the efficacy of checkpoint inhibitor therapy for bladder cancer
When the immune microenvironment is in an inhibited state, the therapeutic effect of immune checkpoint inhibitor will be greatly affected [22]. Finally, we validated the predictive power of the risk signature in immunotherapy against two data sets of bladder tumors treated with PD1/PDL1. Our risk signature provides good differentiation in both data sets. In the data set of GSE17637, although the P value of KM curve was not statistically significant, it was still considered to have a trend due to the data volume (p = 0.15, HR = 1.54). In addition, we found that the high-risk group of bladder cancer patients receiving PD1/PDL1 treatment response was significantly lower than the low-risk group (13% vs. 31%, p = 0.05), and for PD1/PDL1 treatment in non- responsive patients the risk score was significantly higher than that in the responsive group (p = 0.014) (Figure 7A–7C). In the Imvigor210 data set, the survival prognosis of high-risk group was significantly worse than that of low-risk group (p = 0.005, HR = 1.58), the response degree of bladder cancer patients in the high-risk group receiving PD1/PDL1 treatment was significantly lower than that of the low-risk group (19% vs. 31%, p = 0.02), and the risk score of patients who failed to respond to PD1/PDL1 treatment was also significantly higher than that of patients in the response group (p = 0.076) (Figure 7D–7F). Finally, the four-category result composed of TMB and risk score suggested that risk score could be used as a supplement to TMB (Figure 7G, 7H).
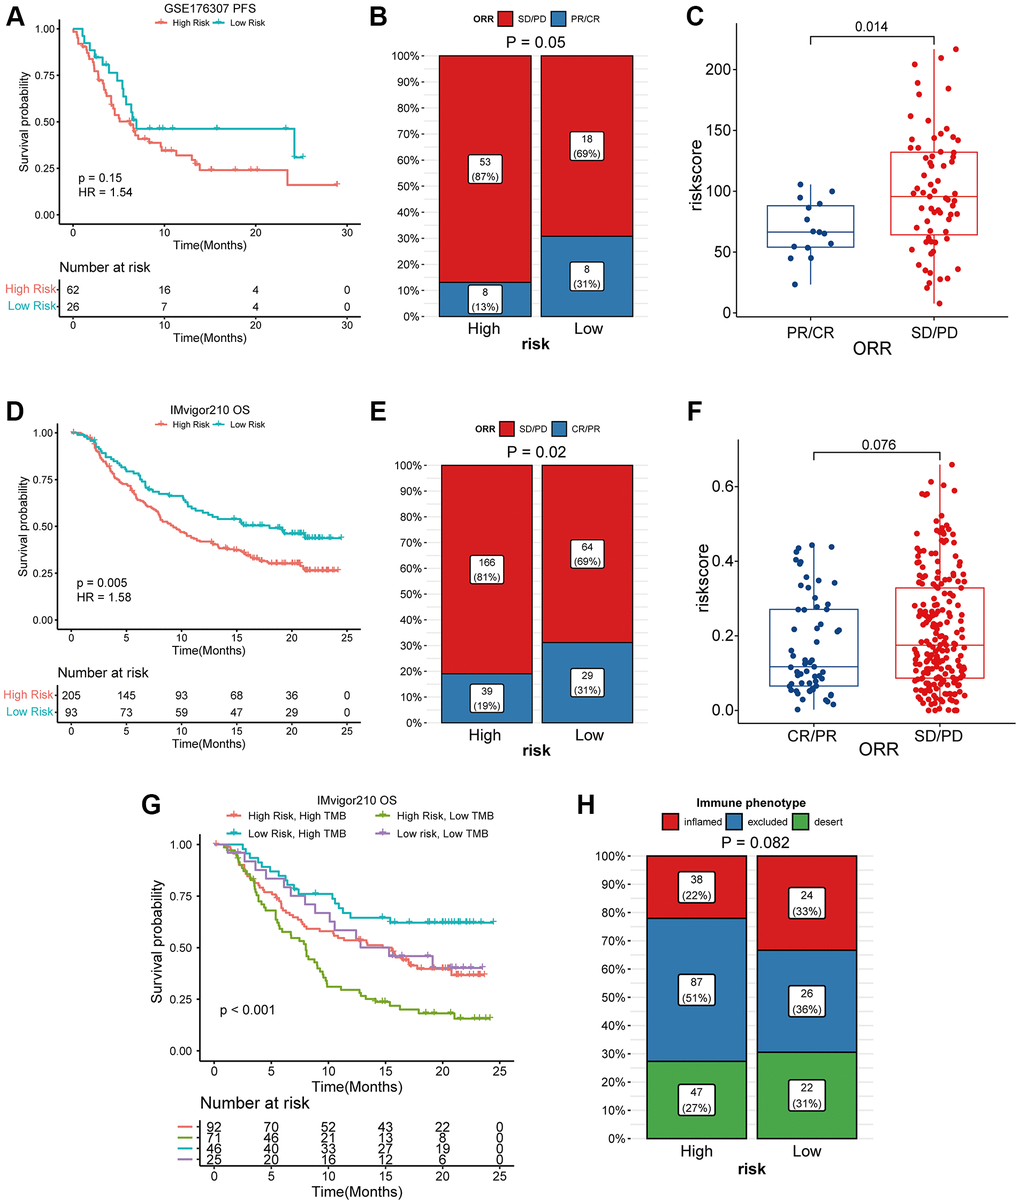
Figure 7. High coagulation-related risks were associated with poor PD1/PDL1 treatment outcomes and lower responses. (A) K-M curve analysis of coagulation-related risk signature in the GES176307 dataset. (B) four-grid table analysis of coagulation-related risk signature in the GES176307 dataset. The sensitivity of immunotherapy was higher in the low-risk group (31% vs. 13%). (C) box plot analysis of coagulation-related risk signature in the GES176307 dataset. The risk score was lower in the immunotherapy sensitive group. (D) K-M curve analysis of coagulation-related risk signature in the Imvigor210 dataset. (E) four-grid table analysis of coagulation-related risk signature in the Imvigor210 dataset. The sensitivity of immunotherapy was higher in the low-risk group (31% vs. 19%). (F) box plot analysis of coagulation-related risk signature in the Imvigor210 dataset. The risk score was lower in the immunotherapy sensitive group. (G, H) K-M curve, four-grid table analysis of TMB combined coagulation-related risk signature in the Imvigor210 dataset.
Discussion
Coagulation abnormalities are very common in advanced tumors, and thromboembolism is the second leading cause of death in patients with advanced tumors, with a incidence rate only lower than organ failure due to distant metastasis of the tumor [23]. About 20% of symptomatic patients with deep vein thrombosis have active malignancies, and the incidence of thrombosis in neoplastic patients is 4–7 times higher than in non-neoplastic patients [24, 25]. Hypercoagulable state in patients with advanced tumor is formed by a combination of many factors. In addition to the factors related to the patients themselves, such as older age and obesity, tumor-related factors are also one of the causes. Studies have confirmed that tumors can secrete inflammatory factors and tumor procoagulant factors activate the clotting mechanism of the body. The cancer cell procoagulant directly promotes the conversion of factor X to factor Xa [26]. The sialic acid portion of the adenocarcinoma mucin causes direct non-enzymatic activation of factor X [27].
Correspondingly, the changes of coagulation state in the body can also affect the biological function of tumors. Coagulation factors are believed to promote cancer invasion and metastasis by promoting the interaction of tumor cell migration and angiogenesis [28]. Neutrophil extracellular traps (NETs) promote tumor cell migration, angiogenesis, and hypercoagulable state [29]. However, whether the abnormal expression of coagulation-related genes affects the biological behavior of tumors is not fully elucidated, and the research on coagulation-related genes in bladder tumors has not been reported yet. In this study, we confirmed the clinical association of coagulation-related genes within tumors with bladder cancer. In large cohort studies, we found that abnormal expression of tumor-associated genes is closely related to the prognosis, angiogenesis, and tumor proliferation of bladder cancer.
Pathway enrichment score indicated that coagulation genes not only activated procoagulant pathways, but also affected angiogenesis, tumor proliferation, and EMT pathways. Tumors need a large amount of energy in the process of growth and invasion, which can be accelerated by angiogenesis and remodeling. The need for angiogenesis in tumor growth and metastasis has been widely recognized [30]. As a symbolic behavior of malignant transformation of cells, EMT has also been widely studied [31]. In addition, our results also suggest that the abnormal expression of coagulation genes may be related to the inhibitory state of the immune microenvironment of bladder cancer. In our study, when the expression of coagulation-related genes was abnormal, immune-related pathways such as TGFβ-β, WNT-β-catenin, and IL6-STAT were all activated. The immune infiltration analysis indicated that when the coagulation related risk score was high, the infiltration abundance of B cells and T cells was low, while that of M2 macrophages was high. In our study, Regulatory T cells (Tregs) were more abundant in the low-risk group. Although considered to be an immunosuppressive cell population, the prognostic role of Tregs varies among tumor types [32]. In bladder cancer, there is a strong positive correlation between Tregs enrichment and T cell infiltration, higher infiltration abundance of Tregs indicates stronger immune cell enrichment and better prognosis [33, 34]. This is consistent with our research results. The state of the immune microenvironment is closely related to the therapeutic efficacy of PD1/PDL1. For example, when the WNT pathway is activated, even highly immunogenic tumor cells will still produce immune escape, thus affecting the therapeutic efficacy of PD1 inhibitors [35]. TGFβ can affect the sensitivity of tumor cells to cytotoxic T cells through a variety of pathways [36, 37]. In our present study, abnormal expression of coagulation genes affected the efficacy of PD1/PDL1 inhibitors for bladder cancer. A high risk associated with coagulation predicts a worse prognosis and a lower response rate.
As a retrospective study, we demonstrated the efficacy of the coagulation-related risk signature in different cohorts, but confounders that could influence clinical outcomes could not be excluded. Although our results confirm that the coagulation score is relevant to the prognosis of bladder cancer and the therapeutic efficacy of PD1/PDL1, further studies are needed to confirm the clinical utility of the coagulation score and its utility as a useful biomarker.
In conclusion, we provide a method for quantitative assessment of coagulation status within a tumor. At the same time, coagulation scores were strongly associated with angiogenesis, tumor proliferation, EMT, and poor prognosis in patients with bladder cancer as well as in those treated with PD1/PDL1.
Supplementary Materials
Author Contributions
ZL and YT designed the study; ZL, BL, YH, QL analyzed the data and wrote the manuscript; BL and QL contributed to draft editing; All authors have read and approved the final version of the manuscript.
Acknowledgments
We would like to express our appreciation to GEO, TCGA, UCSC Xena for providing the data used in this research study.
Conflicts of Interest
The authors declare that the research was conducted in the absence of any commercial or financial relationships that could be construed as a potential conflict of interest.
Funding
The fund project name is Guangdong Medical Science and Technology Research Fund, and the project number is B2022027.
Editorial Note
This corresponding author has a verified history of publications using the personal email address for correspondence.
References
- 1. Kim AS, Khorana AA, McCrae KR. Mechanisms and biomarkers of cancer-associated thrombosis. Transl Res. 2020; 225:33–53. https://doi.org/10.1016/j.trsl.2020.06.012 [PubMed]
- 2. Labelle M, Begum S, Hynes RO. Direct signaling between platelets and cancer cells induces an epithelial-mesenchymal-like transition and promotes metastasis. Cancer Cell. 2011; 20:576–90. https://doi.org/10.1016/j.ccr.2011.09.009 [PubMed]
- 3. Parisi R, Panzera T, Russo L, Gamba S, De Curtis A, Di Castelnuovo A, Marchetti M, Cerletti C, Falanga A, de Gaetano G, Donati MB, Iacoviello L, Costanzo S, and Moli-sani Study Investigators. Fibrinogen levels in relation to colorectal cancer onset: A nested case-cohort study from the Moli-sani cohort. Front Cardiovasc Med. 2022; 9:1009926. https://doi.org/10.3389/fcvm.2022.1009926 [PubMed]
- 4. Henrikson KP, Salazar SL, Fenton JW
2nd , Pentecost BT. Role of thrombin receptor in breast cancer invasiveness. Br J Cancer. 1999; 79:401–6. https://doi.org/10.1038/sj.bjc.6690063 [PubMed] - 5. Diao X, Guo C, Li S. Identification of a novel anoikis-related gene signature to predict prognosis and tumor microenvironment in lung adenocarcinoma. Thorac Cancer. 2023; 14:320–30. https://doi.org/10.1111/1759-7714.14766 [PubMed]
- 6. Wang Y, Lin MG, Meng L, Chen ZM, Wei ZJ, Ying SC, Xu A. Identification of necroptosis-related genes for predicting prognosis and exploring immune infiltration landscape in colon adenocarcinoma. Front Oncol. 2022; 12:941156. https://doi.org/10.3389/fonc.2022.941156 [PubMed]
- 7. Xu R, Wu X, Du A, Zhao Q, Huang H. Identification of cuproptosis-related long non-coding ribonucleic acid signature as a novel prognosis model for colon cancer. Am J Cancer Res. 2022; 12:5241–54. [PubMed]
- 8. Colaprico A, Silva TC, Olsen C, Garofano L, Cava C, Garolini D, Sabedot TS, Malta TM, Pagnotta SM, Castiglioni I, Ceccarelli M, Bontempi G, Noushmehr H. TCGAbiolinks: an R/Bioconductor package for integrative analysis of TCGA data. Nucleic Acids Res. 2016; 44:e71. https://doi.org/10.1093/nar/gkv1507 [PubMed]
- 9. Lee JS, Leem SH, Lee SY, Kim SC, Park ES, Kim SB, Kim SK, Kim YJ, Kim WJ, Chu IS. Expression signature of E2F1 and its associated genes predict superficial to invasive progression of bladder tumors. J Clin Oncol. 2010; 28:2660–7. https://doi.org/10.1200/JCO.2009.25.0977 [PubMed]
- 10. Mariathasan S, Turley SJ, Nickles D, Castiglioni A, Yuen K, Wang Y, Kadel EE III, Koeppen H, Astarita JL, Cubas R, Jhunjhunwala S, Banchereau R, Yang Y, et al. TGFβ attenuates tumour response to PD-L1 blockade by contributing to exclusion of T cells. Nature. 2018; 554:544–8. https://doi.org/10.1038/nature25501 [PubMed]
- 11. Rose TL, Weir WH, Mayhew GM, Shibata Y, Eulitt P, Uronis JM, Zhou M, Nielsen M, Smith AB, Woods M, Hayward MC, Salazar AH, Milowsky MI, et al. Fibroblast growth factor receptor 3 alterations and response to immune checkpoint inhibition in metastatic urothelial cancer: a real world experience. Br J Cancer. 2021; 125:1251–60. https://doi.org/10.1038/s41416-021-01488-6 [PubMed]
- 12. Wagner GP, Kin K, Lynch VJ. Measurement of mRNA abundance using RNA-seq data: RPKM measure is inconsistent among samples. Theory Biosci. 2012; 131:281–5. https://doi.org/10.1007/s12064-012-0162-3 [PubMed]
- 13. Monti S, Tamayo P, Mesirov J, Golub T. Consensus Clustering: A Resampling-Based Method for Class Discovery and Visualization of Gene Expression Microarray Data. Mach Learn. 2003; 52:91–118. https://doi.org/10.1023/A:1023949509487
- 14. Ritchie ME, Phipson B, Wu D, Hu Y, Law CW, Shi W, Smyth GK. limma powers differential expression analyses for RNA-sequencing and microarray studies. Nucleic Acids Res. 2015; 43:e47. https://doi.org/10.1093/nar/gkv007 [PubMed]
- 15. Friedman J, Hastie T, Tibshirani R. Regularization Paths for Generalized Linear Models via Coordinate Descent. J Stat Softw. 2010; 33:1–22. [PubMed]
- 16. Barros AJ, Hirakata VN. Alternatives for logistic regression in cross-sectional studies: an empirical comparison of models that directly estimate the prevalence ratio. BMC Med Res Methodol. 2003; 3:21. https://doi.org/10.1186/1471-2288-3-21 [PubMed]
- 17. Huang ML, Hung YH, Lee WM, Li RK, Jiang BR. SVM-RFE based feature selection and Taguchi parameters optimization for multiclass SVM classifier. ScientificWorldJournal. 2014; 2014:795624. https://doi.org/10.1155/2014/795624 [PubMed]
- 18. Robin X, Turck N, Hainard A, Tiberti N, Lisacek F, Sanchez JC, Müller M. pROC: an open-source package for R and S+ to analyze and compare ROC curves. BMC Bioinformatics. 2011; 12:77. https://doi.org/10.1186/1471-2105-12-77 [PubMed]
- 19. Zhou RS, Zhang EX, Sun QF, Ye ZJ, Liu JW, Zhou DH, Tang Y. Integrated analysis of lncRNA-miRNA-mRNA ceRNA network in squamous cell carcinoma of tongue. BMC Cancer. 2019; 19:779. https://doi.org/10.1186/s12885-019-5983-8 [PubMed]
- 20. Newman AM, Liu CL, Green MR, Gentles AJ, Feng W, Xu Y, Hoang CD, Diehn M, Alizadeh AA. Robust enumeration of cell subsets from tissue expression profiles. Nat Methods. 2015; 12:453–7. https://doi.org/10.1038/nmeth.3337 [PubMed]
- 21. Yu G, Wang LG, Han Y, He QY. clusterProfiler: an R package for comparing biological themes among gene clusters. OMICS. 2012; 16:284–7. https://doi.org/10.1089/omi.2011.0118 [PubMed]
- 22. Wang D, Ye Q, Gu H, Chen Z. The role of lipid metabolism in tumor immune microenvironment and potential therapeutic strategies. Front Oncol. 2022; 12:984560. https://doi.org/10.3389/fonc.2022.984560 [PubMed]
- 23. Elyamany G, Alzahrani AM, Bukhary E. Cancer-associated thrombosis: an overview. Clin Med Insights Oncol. 2014; 8:129–37. https://doi.org/10.4137/CMO.S18991 [PubMed]
- 24. Donnellan E, Kevane B, Bird BR, Ainle FN. Cancer and venous thromboembolic disease: from molecular mechanisms to clinical management. Curr Oncol. 2014; 21:134–43. https://doi.org/10.3747/co.21.1864 [PubMed]
- 25. Lee AY. Management of thrombosis in cancer: primary prevention and secondary prophylaxis. Br J Haematol. 2005; 128:291–302. https://doi.org/10.1111/j.1365-2141.2004.05292.x [PubMed]
- 26. Falanga A, Gordon SG. Isolation and characterization of cancer procoagulant: a cysteine proteinase from malignant tissue. Biochemistry. 1985; 24:5558–67. https://doi.org/10.1021/bi00341a041 [PubMed]
- 27. Bick RL. Cancer-associated thrombosis. N Engl J Med. 2003; 349:109–11. https://doi.org/10.1056/NEJMp030086 [PubMed]
- 28. Wojtukiewicz MZ, Hempel D, Sierko E, Tucker SC, Honn KV. Protease-activated receptors (PARs)--biology and role in cancer invasion and metastasis. Cancer Metastasis Rev. 2015; 34:775–96. https://doi.org/10.1007/s10555-015-9599-4 [PubMed]
- 29. Efrimescu CI, Buggy PM, Buggy DJ. Neutrophil Extracellular Trapping Role in Cancer, Metastases, and Cancer-Related Thrombosis: a Narrative Review of the Current Evidence Base. Curr Oncol Rep. 2021; 23:118. https://doi.org/10.1007/s11912-021-01103-0 [PubMed]
- 30. Katsuta E, Rashid OM, Takabe K. Clinical relevance of tumor microenvironment: immune cells, vessels, and mouse models. Hum Cell. 2020; 33:930–7. https://doi.org/10.1007/s13577-020-00380-4 [PubMed]
- 31. Pastushenko I, Blanpain C. EMT Transition States during Tumor Progression and Metastasis. Trends Cell Biol. 2019; 29:212–26. https://doi.org/10.1016/j.tcb.2018.12.001 [PubMed]
- 32. Shang B, Liu Y, Jiang SJ, Liu Y. Prognostic value of tumor-infiltrating FoxP3+ regulatory T cells in cancers: a systematic review and meta-analysis. Sci Rep. 2015; 5:15179. https://doi.org/10.1038/srep15179 [PubMed]
- 33. Leblond MM, Zdimerova H, Desponds E, Verdeil G. Tumor-Associated Macrophages in Bladder Cancer: Biological Role, Impact on Therapeutic Response and Perspectives for Immunotherapy. Cancers (Basel). 2021; 13:4712. https://doi.org/10.3390/cancers13184712 [PubMed]
- 34. Koll FJ, Banek S, Kluth L, Köllermann J, Bankov K, Chun FK, Wild PJ, Weigert A, Reis H. Tumor-associated macrophages and Tregs influence and represent immune cell infiltration of muscle-invasive bladder cancer and predict prognosis. J Transl Med. 2023; 21:124. https://doi.org/10.1186/s12967-023-03949-3 [PubMed]
- 35. Takeuchi Y, Tanegashima T, Sato E, Irie T, Sai A, Itahashi K, Kumagai S, Tada Y, Togashi Y, Koyama S, Akbay EA, Karasaki T, Kataoka K, et al. Highly immunogenic cancer cells require activation of the WNT pathway for immunological escape. Sci Immunol. 2021; 6:eabc6424. https://doi.org/10.1126/sciimmunol.abc6424 [PubMed]
- 36. Bagati A, Kumar S, Jiang P, Pyrdol J, Zou AE, Godicelj A, Mathewson ND, Cartwright ANR, Cejas P, Brown M, Giobbie-Hurder A, Dillon D, Agudo J, et al. Integrin αvβ6-TGFβ-SOX4 Pathway Drives Immune Evasion in Triple-Negative Breast Cancer. Cancer Cell. 2021; 39:54–67.e9. https://doi.org/10.1016/j.ccell.2020.12.001 [PubMed]
- 37. Larson C, Oronsky B, Carter CA, Oronsky A, Knox SJ, Sher D, Reid TR. TGF-beta: a master immune regulator. Expert Opin Ther Targets. 2020; 24:427–38. https://doi.org/10.1080/14728222.2020.1744568 [PubMed]