Functional enrichment analysis of the common genes
The genes identified through the employment of limma and WGCNA analyses have potential significance in the pathogenesis of PMOP. Subsequently, an intersection of the genes derived from both methods was conducted to identify key genes that exhibit consistent role in PMOP for the further analyses. We collected 522 genes from the key modules identified by WCGNA and Venn plot show a total of 112 common genes between 522 module genes and 1278 DEGs (Figure 4A). DO enrichment analysis showed the possible common genes-related diseases, including “arteriosclerosis”, “atherosclerosis”, “arteriosclerotic cardiovascular disease”, “acute myocardial infarction”, “inflammatory bowel disease”, “COVID-19”, “cystitis”, “pancreatitis”, and “bacterial meningitis” (Figure 4B, 4C). We also perform GO and KEGG functional enrichment analyses. The top five biological processes were “serine-type endopeptidase activity”, “calcium-dependent protein binding”, “serine-type peptidase activity”, “serine hydrolase activity”, and “actin binding” (Figure 4D, 4E). Pathways highly related to the 112 common genes included “Renin secretion”, “Human cytomegalovirus infection”, “Oxytocin signaling pathway”, “SNARE interactions in vesicular transport”, “Neutrophil extracellular trap formation”, “Transcriptional misregulation in cancer”, “Proteoglycans in cancer”, and “Sphingolipid metabolism” (Figure 4F, 4G). The results of GSEA for 112 common genes were visualized by ridge plots in Supplementary Figure 2A, 2B. Top three GO Cell Component (CC) contained “immunoglobulin complex circulating”, “secretory granule membrane”, and “vesicle lumen” and top three Biological Process (BP) included “respond to bacterium”, “response to molecule of bacterial origin”, and “innate immune response in mucosa” (Supplementary Figure 2A). KEGG pathway analysis by GSEA resulted in “alanine aspartate and glutamate metabolism”, “one carbon pool by folate”, and “chemokine signaling pathway” (Supplementary Figure 2B). Supplementary Figure 2C and Figure 5D were GSEA plots showing the top- and down-regulated GO terms respectively. For KEGG enrichment analysis, the top- and down-regulated pathways were also visualized by the GSEA plot (Supplementary Figure 2E, 2F).
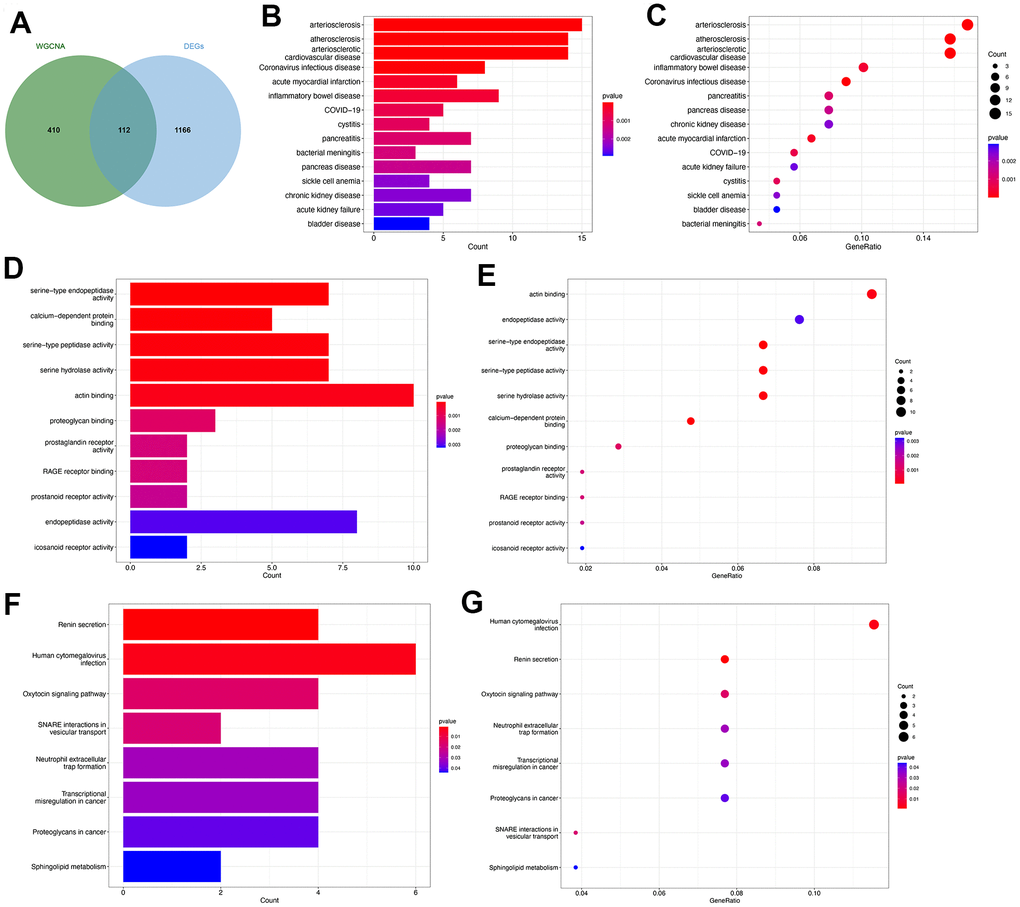
Figure 4. Functional enrichment analysis of the common key genes. (A) The Venn plot identified 112 shared genes among 522 module genes and 1278 DEGs. Bar plot (B) and dot plot (C) showed the results of DO enrichment analysis of 112 common genes. Bar plot (D) and dot plot (E) showed the results of GO enrichment analysis of 112 common genes. Bar plot (F) and dot plot (G) showed the results of KEGG enrichment analysis of 112 common genes.
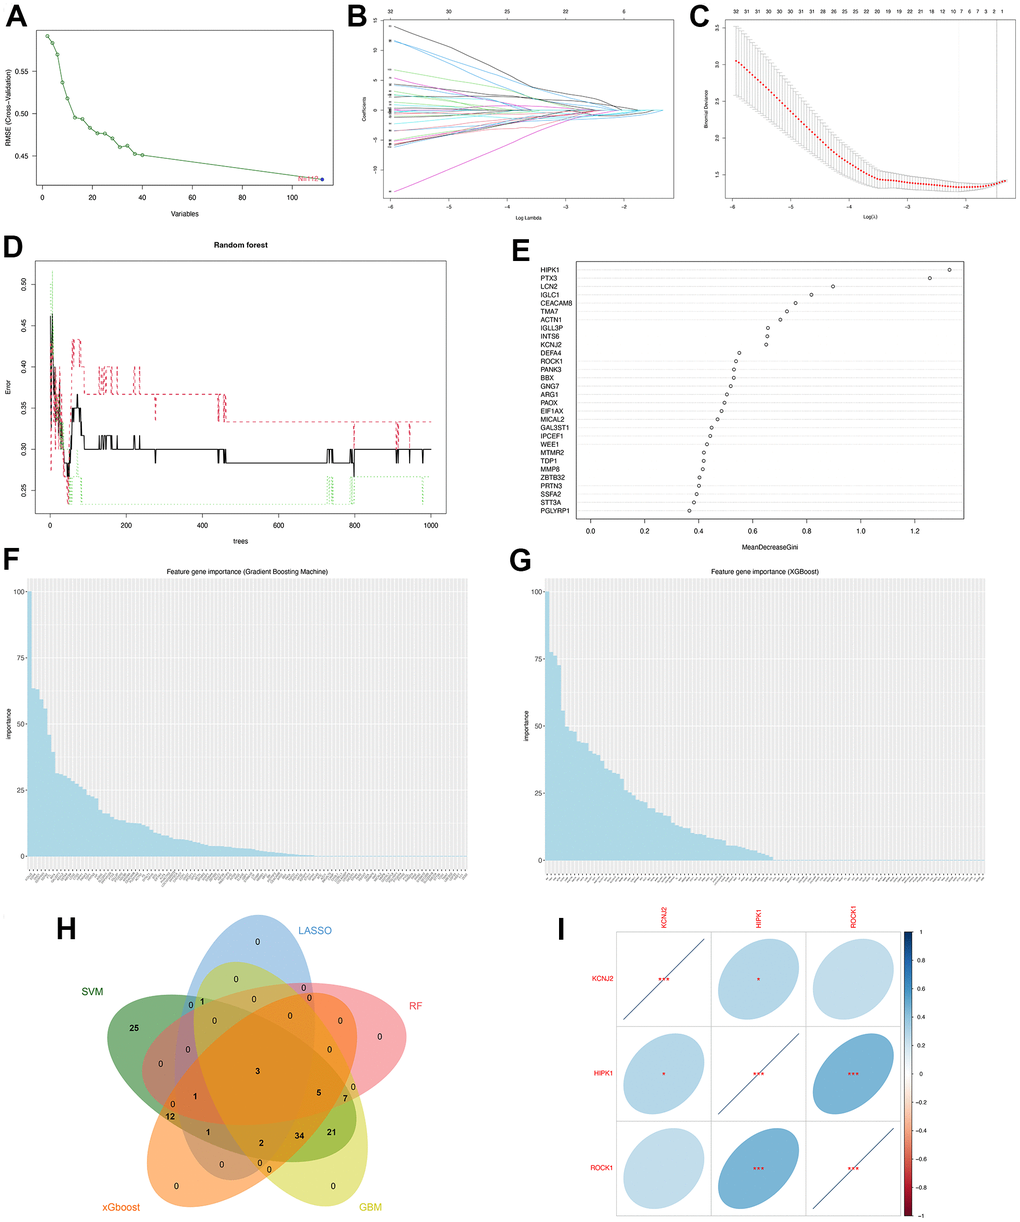
Figure 5. Machine learning identified three hub genes of PMOP. (A) SVM-RFE screening of candidate diagnostic genes. (B, C) LASSO screening of candidate diagnostic genes. (D) Random forest error rate versus the number of classification trees. (E) Random forest calculated the top 30 relatively important genes of PMOP. (F) GBM screening of candidate diagnostic genes and the bar chart showed the genes ranked by importance. (G) XGboost screening of candidate diagnostic genes and he bar chart showed the genes ranked by importance. (H) Venn plot between five machine learning methods resulted in three common hub genes. (I) Correlation between three hub genes. Blue represents positive correlations and red represents negative correlations. *, p < 0.05, **, p < 0.01, ***, p < 0.001.
Immune infiltration analysis and the correlation between genes and immune
According to the above GSEA results for 112 overlapped genes, three hub genes, and low-ROCK1 group genes, both the GO and KEGG functional enrichment analyses showed a probable association between immunization and PMOP, such as “innate immune response in mucosa”, “adaptive immune response”, “lymphocyte-mediated immunity”, and “primary immunodeficiency”. We then perform an immune infiltration analysis by xCell to find the content and effect of 33 immune cell types on PMOP. As shown in Figure 10A, DCs (Dendritic cells), cDCs (conventional DCs), iDCs (immature DCs), and NKT (Natural Killer T) cells were elevated (p <0.05) while Basophils and Mast cells show a significant decrease (p <0.05 and <0.001, respectively) in PMOP patients. Bar plot showed the different compositions and immune scores of immune cells in each sample (Figure 10B). The correlations between the expression levels of 33 immune cells were calculated. DC had a negative relationship with the T cells family, including Th2 cells, Tgd cells, CD4+ T cells, and CD8+ T cells (Figure 10C). For NKT cells, it was inversely related to Th2 cells but positively related to Th1 cells and Macrophages M2 (Figure 10C). Basophils and Mast cells have a positive correlation with Monocytes and B cells while Mast cells also had a positive association with T cells and Neutrophils (Figure 10C). The correlation between three hub genes and immune cells expression was shown in Figure 10D, and ROCK1 was inversely related to CD4+ TEM (Effector memory T Cells), Macrophages M2, aDC, cDC, iDC, DC, NKT, Th1 cells, naïve B cells, pro B cells, and memory B cells. Conversely, Tgd cells, Mast cells, CD4+ memory T cells, CD4+ T cells, Tregs, CD8+ Tcm, and Th2 cells were negatively correlated with ROCK1 in PMOP patients (Figure 10D).
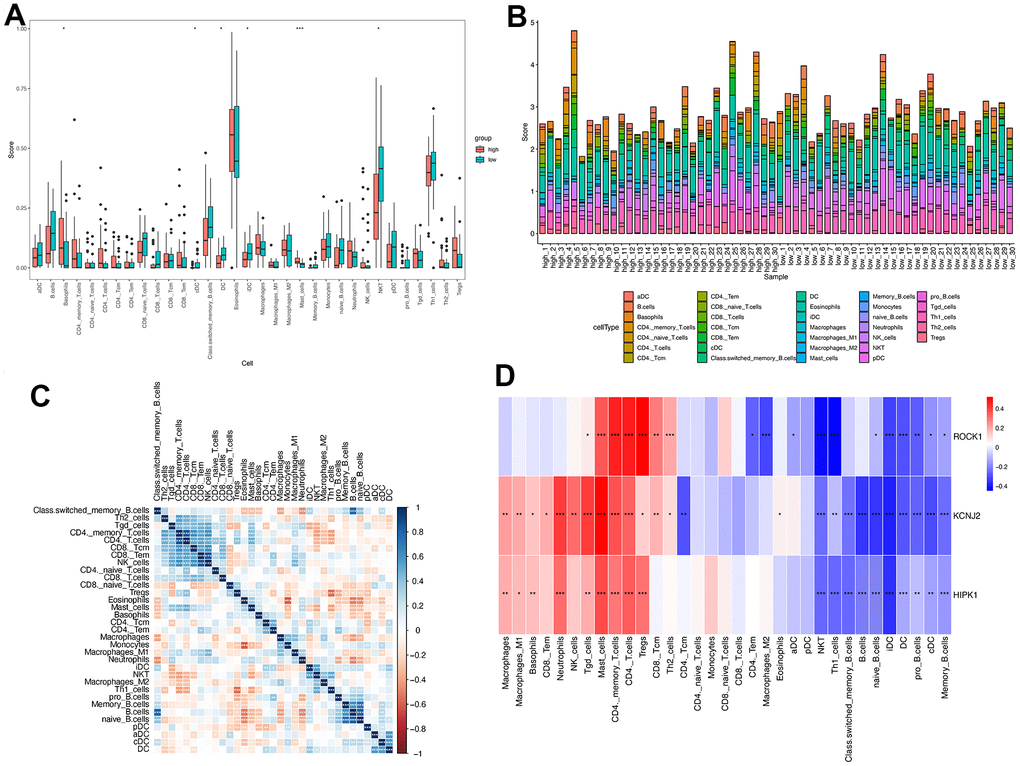
Figure 10. Immune cell infiltration analysis on PMOP. The proportion of 33 kinds of immune cells in PMOP patients and controls was visualized from the box plot (A) and the bar plot (B). (C) Correlation of 33 immune cell type compositions in PMOP. (D) Correlation between the expression of 33 immune cells and three hub genes in PMOP. *, p < 0.05, **, p < 0.01, ***, p < 0.001.
Pan-cancer ROCK1 expression
Several studies have found the important role of ROCK1 in cancers [25–28]. Since PMOP patients had a higher risk to get some types of cancer, we were greatly interested in whether the low expression of ROCK1 made great importance to increasing the cancer risk, accelerating the cancer progression, or worsening the cancer prognosis [29, 30].
We then calculated the difference in expression between normal and tumor samples in each tumor. In TCGA datasets of 26 tumors, eight tumors showed significantly higher expression, including Glioma (GBMLGG), Brain Lower Grade Glioma (LGG), Stomach and Esophageal carcinoma (STES), Stomach adenocarcinoma (STAD), Head and Neck squamous cell carcinoma (HNSC), Kidney renal clear cell carcinoma (KIRC), Liver hepatocellular carcinoma (LIHC), and Cholangiocarcinoma (CHOL), while the expression of ROCK1 in 10 tumors was lower than normal controls: Lung adenocarcinoma (LUAD), Colon adenocarcinoma/Rectum adenocarcinoma Esophageal carcinoma (COADREAD), Breast invasive carcinoma (BRCA), Kidney renal papillary cell carcinoma (KIRP), Prostate adenocarcinoma (PRAD), Uterine Corpus Endometrial Carcinoma (UCEC), Lung squamous cell carcinoma (LUSC), Rectum adenocarcinoma (READ), Bladder Urothelial Carcinoma (BLCA), and Kidney Chromophobe (KICH) (Figure 12A). To further validate the results, we add normal control data from GTEx datasets and perform difference analysis combined with TCGA and GTEx. As shown in Figure 12B, ROCK1 in 13 types of tumors was highly expressed: GBM(p=4.8E-12), GBMLGG(p=1.3E-73), LGG(p=1.5E-74), Esophageal carcinoma (ESCA)(p=2.9E-05), STES(p=4.0E-05), STAD(p=8.0E-22), HNSC(p=2.8E-07), KIRC(p=2.6E-06), High-Risk Wilms Tumor (WT)(p=5.1E-22), Pancreatic adenocarcinoma (PAAD)(p=7.7E-40), Acute Lymphoblastic Leukemia (ALL)(p=9.1E-44), Acute Myeloid Leukemia (LAML)(p=3.1E-74), CHOL(p=1.6E-05), and totally 18 cancers were low-ROCK1 expression: UCEC(p=5.1E-05), BRCA(p=3.0E-46), Cervical squamous cell carcinoma and endocervical adenocarcinoma (CESC)(p=7.7E-06), LUAD(p=8.4E-90), KIRP(p=2.7E-15), Colon adenocarcinoma (COAD)(6.8E-40), COADREAD(p=7.9E-47), PRAD(p=4.3E-16), LUSC(p=3.5E-103), Skin Cutaneous Melanoma (SKCM)(p=7.3E-24), BLCA(p=3.1E-08), Thyroid carcinoma (THCA)(p=1.5E-56), READ(p=0.02), Ovarian serous cystadenocarcinoma (OV)(p=6.8E-40), Testicular Germ Cell Tumors (TGCT)(p=3.0E-15), Uterine Carcinosarcoma (UCS)(p=1.6E-22), Adrenocortical carcinoma (ACC)(p=3.0E-24), KICH(p=2.6E-04). According to the results, we found that the tumors in the central nervous system (GBM and LGG), in the digestive tract (STAD, LIHC, CHOL, ESCA, PAAD), and the hematological malignancies including ALL and LAML had a higher level of ROCK1 expression significantly. Interestingly, consistent with the low expression of ROCK1 in PMOP, ROCK1 was down-regulated in all women’s tumors (BRCA, UCEC, CESC, OV, and UCS) in the database. Moreover, lung cancers (LUAD, LUSC) and tumors in the large intestine (COADREAD, READ, and COAD) also had a lower expression of ROCK1 than the normal tissues. However, the ROCK1 level in bone-related tumors like osteosarcoma is similar to the normal tissues. To further validate the results in protein level, the protein expression level of ROCK1 from HPA was consistent with the mRNA results, both in women-specific cancers (Figure 13A) and the skin cancers, renal cancers, and lung cancers (Figure 13B) which were mentioned above. We selected patients who is woman and at the age of postmenopause, the details of patient information were shown in Supplementary Table 2.
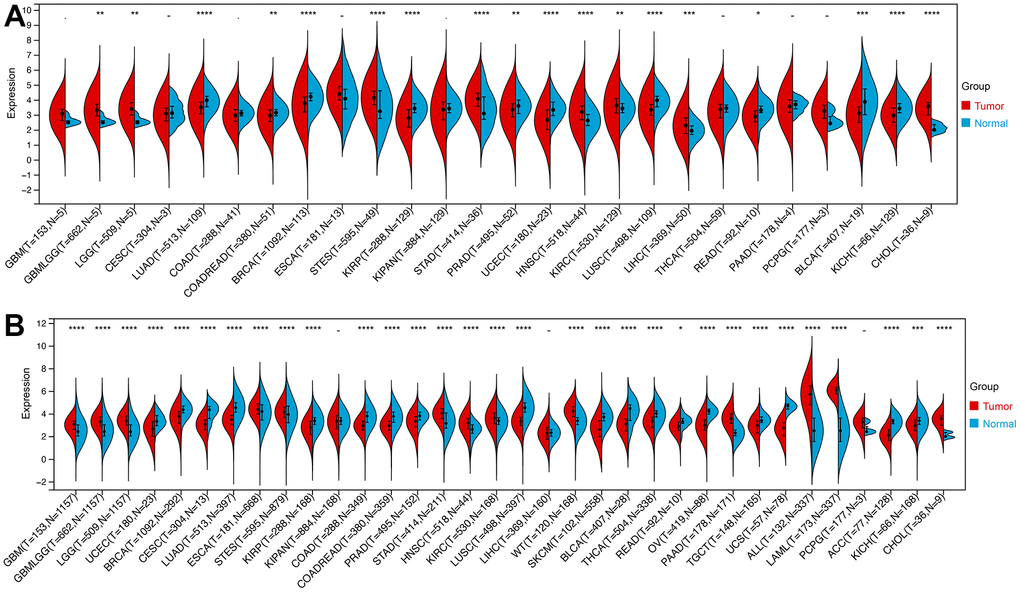
Figure 12. The expression of ROCK1 in Pan-cancer. (A) Pan-cancer expression levels of ROCK1 in the TCGA dataset. (B) Pan-cancer expression levels of ROCK1 in the TCGA and GTEx datasets. *p <0.05, **p <0.01, ***p <0.001, ****p <0.0001, -no significance.
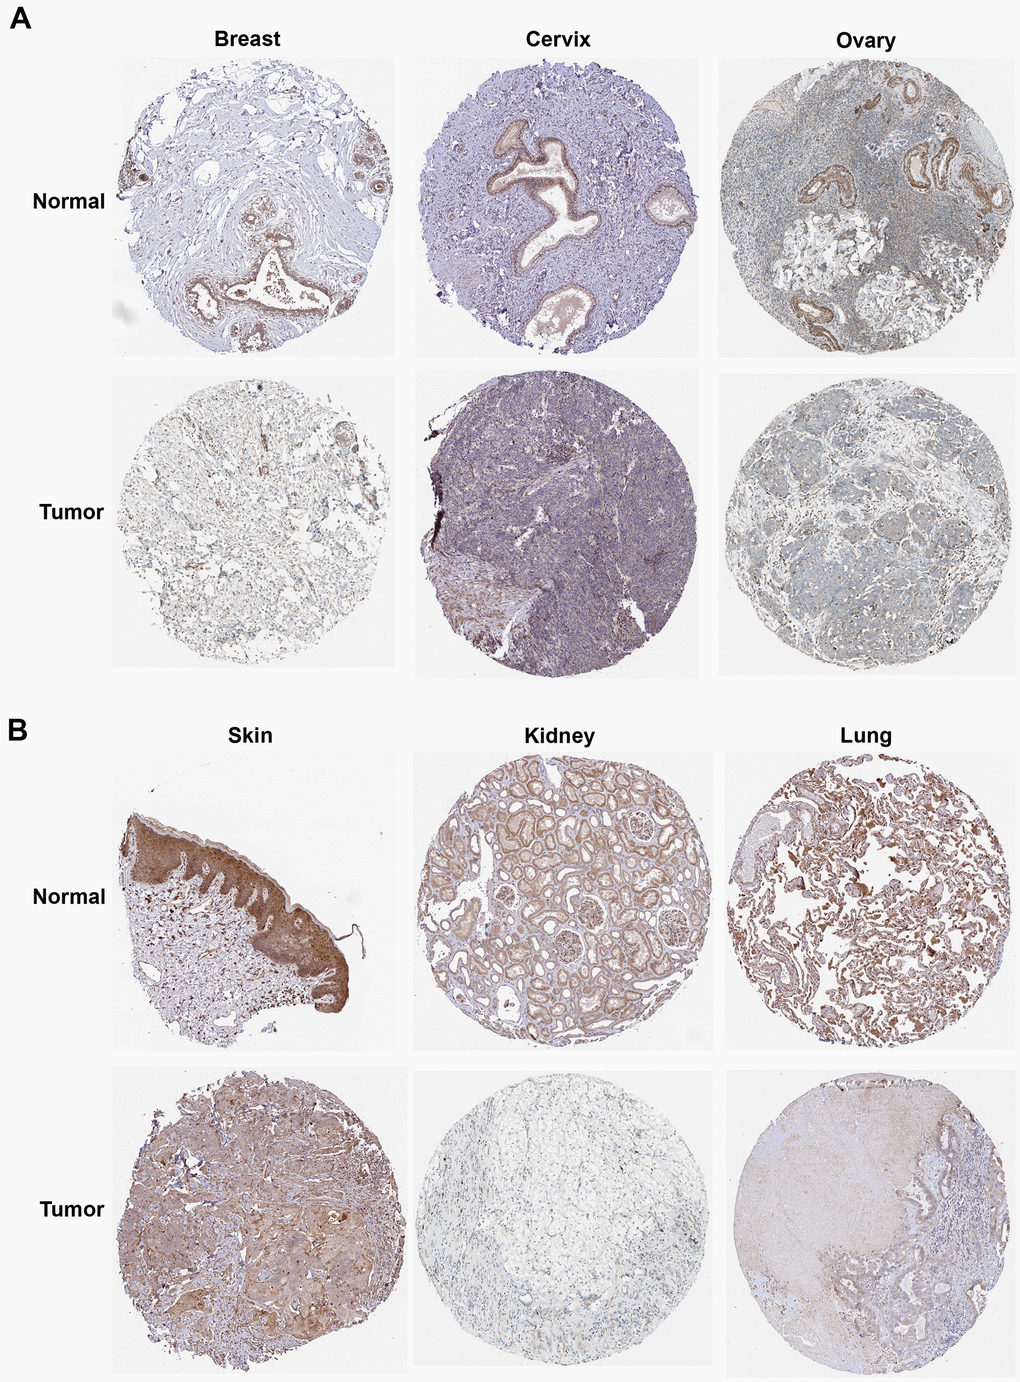
Figure 13. The protein expression of ROCK1 in pan-cancer. (A) The protein expression level of ROCK1 in women-specific cancers (Breast tumors, Cervical tumors, and Ovarian tumors versus normal tissues. (B) The protein expression level of ROCK1 in Skin tumors, Renal tumors, and Lung tumors versus normal tissues.
We also calculated the variation in ROCK1 expression in each tumor at different clinical phases to assess the impact of ROCK1 on tumor progression and severity. For the T stage (Supplementary Figure 3A), we found a significant difference in 5 tumors: BRCA (p=0.04), STAD (p=1.1E-03), PRAD (p=0.02), KIRC (p=4.3E-03), TGCT (p=0.02). ROCK1 expression in two tumors, STAD (p=0.01) and THCA (p=1.2E-03) were significant differences between N stages (Supplementary Figure 3B). Among 25 tumors for analysis, only KIRC M1 stage had lower ROCK1 expression than M0 stage (p=7.2E-03, Supplementary Figure 3C). Moreover, ROCK1 expression among Stage I to IV was significantly different in STAD (p=2.4E-03) and KIRC(p=2.5E-03) (Supplementary Figure 3D), while KIPAN (p=9.8E-07), HNSC (p=0.04), and KIRC (p=9.8E-07) had different ROCK1 expressions among Grade I to IV (Supplementary Figure 3E).
The relationship between ROCK1 and tumor prognosis in pan-cancer should be explored, which may help further understand the role of low-ROCK1 expression in PMOP patients’ cancer risk. Among several pan-cancer, we calculated the survival time including Overall survival (OS), Disease-specific survival (DSS), Disease-free interval (DFI), and Progression-free interval (PFI). TCGA-LGG (HR= 1.39, 95%CI = 1.01-1.90), TARGET-LAML (HR =1.46, 95%CI =1.20-1.77) had lower OS time and worse prognosis with high ROCK1 expression (Figure 14A). In contrast, low expression of ROCK1 in TCGA-GBMLGG (HR= 0.82, 95%CI =0.68-1.00), TCGA-KIRC (HR= 0.75, 95%CI =0.62-0.90), TCGA-SKCM (HR= 0.84, 95%CI =0.73-0.98), TARGET-NB (HR =0.74, 95%CI =0.56-0.99), TARGET-ALL (HR= 0.83, 95%CI =0.69-0.99) was related to bad prognosis and high death risk (Figure 14A). TCGA-LGG, TCGA-LUSC, and TCGA-ACC had lower DSS time while the ROCK1 expression was higher, and lower DSS time was also connected to lower ROCK1 expression in TCGA-KIRC, TCGA-THYM, TCGA-SKCM-M, and TCGA-OV (Figure 14B). The data of DFI and PFI were also calculated and shown in Figure 14C, 14D. We then draw the Kaplan–Meier (K-M) curve of tumors which significantly affected the OS time and cancer prognosis, and further demonstrate that TCGA-GMBLGG, TCGA-KIRC, TCGA-SKCM, and TARGET-ALL had worse prognosis with low-ROCK1 expression while the high expression of ROCK1 in TCGA-LGG, TARGET-LAML, and TARGET-NB was correlated to the low survival probability (Supplementary Figure 4).
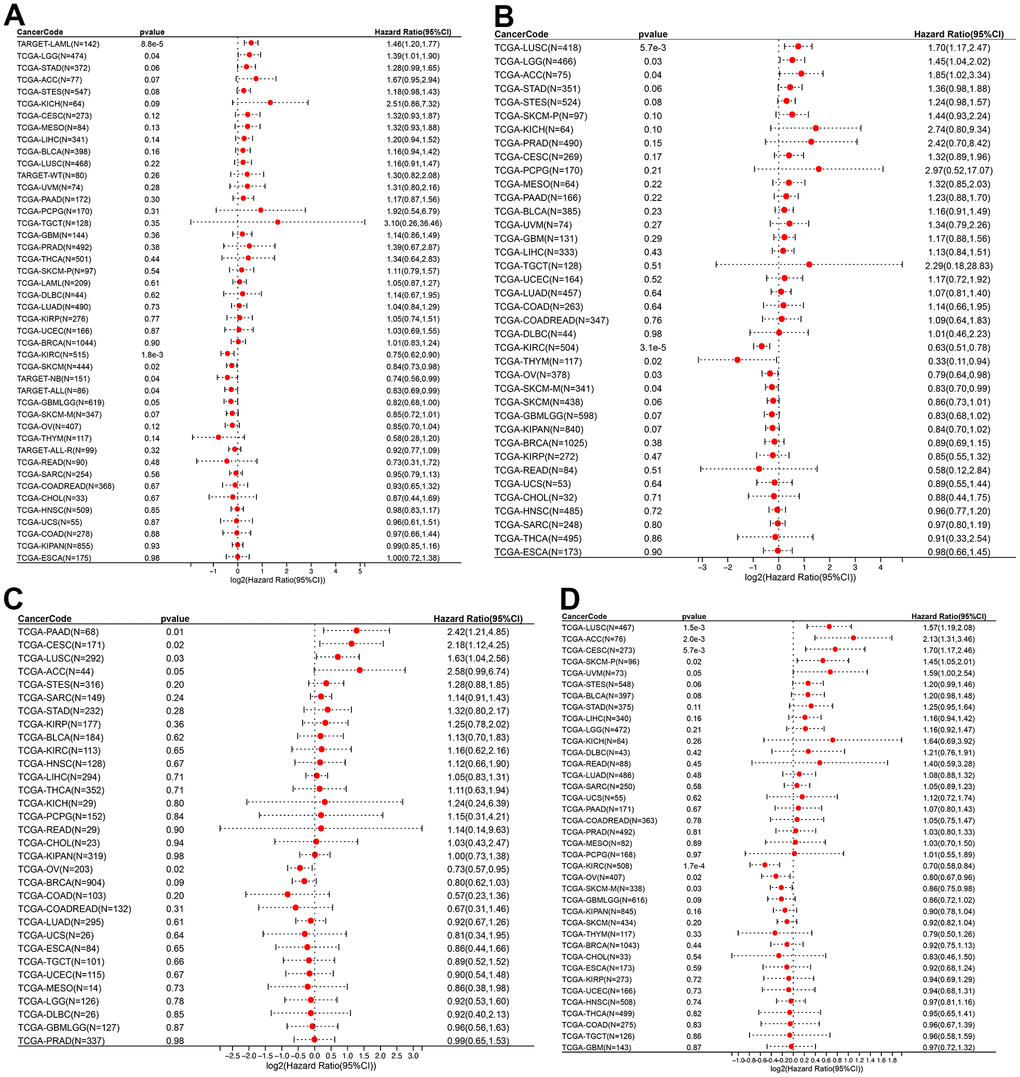
Figure 14. ROCK1 and survival situations. (A–D) Forest plots of ROCK1 expression and OS, DSS, DFI, and PFA. OS, overall survival; DSS, disease-specific survival; DFI, disease-free interval; PFI, progression-free interval; HR, hazard ratio.
RNA modification, including m1A, m5C, and m6A, had been extensively investigated due to its significant association with both cancers and bone metabolism [31–34]. We further investigate the correlation between ROCK1 expression and RNA modification genes in pan-cancer. The 44 RNA modification genes for analysis included 10 m1A-related genes, 13 m5C-related genes, and 21 m6A-related genes, which were divided into writer, reader, and eraser. Most RNA modification gene expression was positively correlated to the ROCK1 (Supplementary Figure 5).
Using TIMER, six immune cell infiltration scores were obtained for 9406 tumor samples from 38 tumor types. Moreover, the immune infiltration score with a significant correlation was determined using Pearson’s correlation coefficient of gene and immune cell infiltration scores in each tumor. The full results were shown in Figure 15A. To further validate the TIMER results, we then perform ESTIMATE immune score analysis and find immune scores in 12 types of tumors (GBM, UCEC, LAM, CESC, STES, SARC, KIRP, LUSC, THYM, WT, SKCM-P, and PCPG) were negatively correlated to the ROCK1 expression levels (Figure 15B).
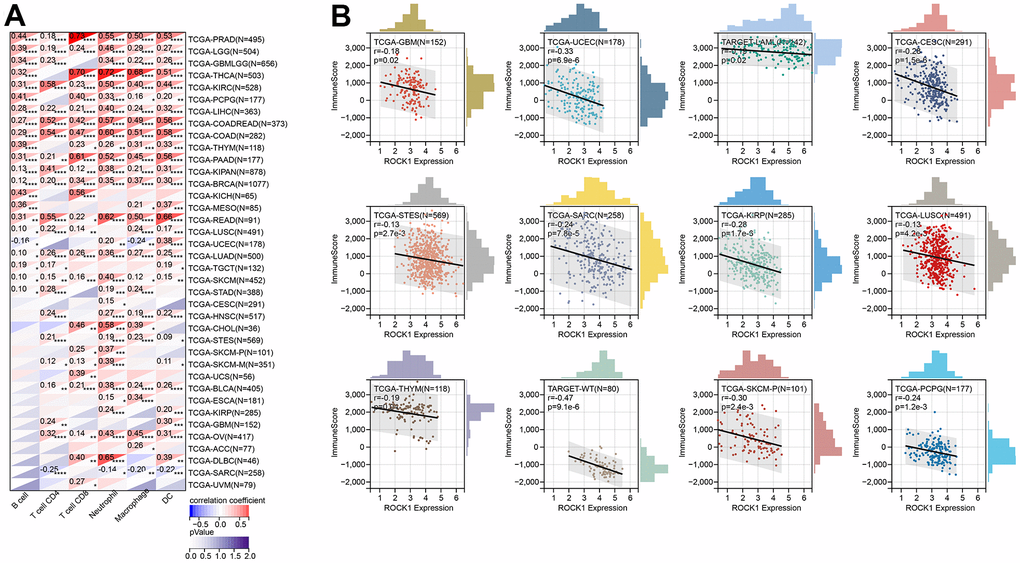
Figure 15. ROCK1’s role in tumor immune response. (A) Correlation between the expression levels of ROCK1 and immune infiltration pan-cancer by TIMER database. (B) Correlation between the expression of ROCK1 and ImmuneScore derived from the ESTIMATE algorithm. *p <0.05, **p <0.01, ***p <0.001, ****p <0.0001.
Tumor mutation burden (TMB) refers to the total number of substitution and insertion/deletion mutations per megabase in the exon coding region of a tumor sample that has been analyzed. High TMB levels in patients may result in increased neoantigen production and subsequent activation of tumor-specific T cells, which can be further potentiated by PD-1/PD-L1 inhibitors. As such, TMB has emerged as an important biomarker for predicting the response to immune checkpoint inhibitors in cancer patients [35]. We then calculate the Pearson correlation between TMB and ROCK1, which may help to identify ROCK1-related PD-1/PD-L1 inhibitors which can treat the specific tumors. As shown in Supplementary Figure 6A, ROCK1 expression had a positive correlation with TMB in COADREAD (r =0.12, p =0.026) and a negative correlation with STES (r =-0.16, p =1.7E-04) and STAD (r =-0.14, p =0.004). MSI (Microsatellite Instability) is a functional defect caused by DNA mismatch repair in tumor tissue. Like TMB, MSI is also an important tumor marker that may indicate a great effect treated by PD-1/PD-L1 inhibitors [36]. High ROCK1 expression was significantly and positively associated with high MSI values in GBM (r =0.23, p =0.005), GBMLGG (r =0.18, p =3.5E-06), CESC (r =0.15, p =0.01), LUAD (r =0.096, p =0.03), COAD (r =0.17, p =0.004), COADREAD (r =0.17, p =7.5E-04), LUSC (r =0.13, p =0.005), and READ (r =0.28, p =0.008), and with low MSI values in BRCA (r =-0.1, p =0.001), STES (r =-0.14, p =7.2E-04), KIPAN (r =-0.09, p =0.01), STAD (r =-0.12, p =0.016), PRAD (r =-0.16, p =3.2E-04), HNSC (r =-0.24, p =4.5E-08), THCA (r =-0.1, p =0.028), and DLBC (r =-0.56, p =3.8E-05) (Supplementary Figure 6B).