Tests of accuracy and biological relevance of predictions
Two claims are made by studies of EN-based predictors, first that the errors in prediction by DNAme clocks are attributed to age acceleration in particular individuals. In support for this attribution, a similar acceleration was seen for some diseases, albeit only for some age groups [1–5, 36]. A second claim is that because clocks trained on one sample set can work on out-of-sample set data, this indicates some biological relevance of EN predictions and of cytosine selection.
To examine these claims, we performed systematic fail-tests of DNAme clocks with large DNAme datasets from nine independent studies. First, we reconstructed EN regression models that replicate the published first-generation clocks, and tested them with the original and out-of-sample DNAme array datasets, in which healthy subjects were compared to those with disease: Rheumatoid arthritis, Down syndrome, BRCA-1 cancer, Werner syndrome, Multiple Sclerosis, Crohn’s Disease, Ulcerative Colitis, Irritable Bowel Disease, and an HIV dataset that did not have a parallel healthy control, Figure 2A and Supplementary Figure 2. Model performance was assessed by correlation coefficient (Pearson’s r) between the predicted and actual ages and median absolute error (MAE) (Equations 4, 5).
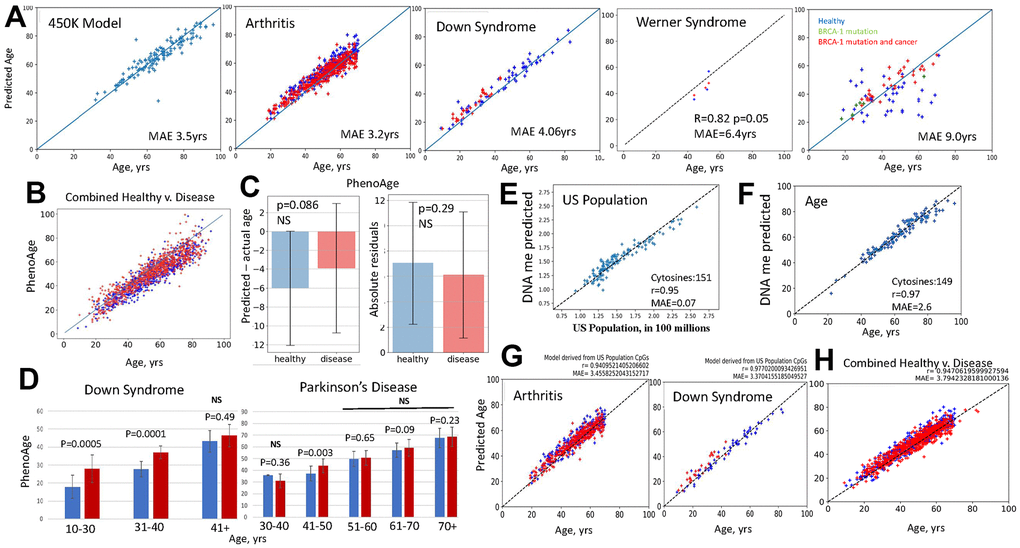
Figure 2. Fail-tests of EN models that are trained on biological v. non-biological parameters. (A) Standard first generation EN model was trained on 450K DNAme arrays dataset; tests with the original and new datasets, as indicated, are shown (blue – healthy, red – disease). BRCA-1 studies were done on 27K dataset, thus, after training on 27K dataset. EN was tested on BRCA-1 data. EN models were testable with the original and new datasets, except for the BRCA-1, where only the subjects with BRCA1 mutation and cancer but not healthy controls received fairly accurate age predictions. All EN models overlapped predictions for healthy subjects and patients (see Supplementary Figure 2 for the tests of EN models on additional disease v. healthy datasets). (B) PhenoAge scatter plots overlay for the patients with the studied datasets (red dots-Combined Disease, blue dots-Combined Healthy). (C) PhenoAge tests on the six 450K datasets are represented as the bar graphs on Mean and SDs of predicted age minus actual age (left) and as the comparison in absolute residuals (right); patients – red bars n=806, healthy controls – blue bars; n=754, p-values are shown, NS- non-significant. (D) PhenoAge predictions of DNAme age for the indicated age-intervals are shown as bar graphs of Means with SDs for the patients with Down Syndrome and Parkinson’s Disease (red bars), and their healthy controls (blue bars). DS, n=26, Control, n=58; PD, n=289, Control, n=219; p-values are shown. (E) EN model was trained on the US population numbers, at subjects’ birth years, using the same 450K DNAme array, as in A. The test shows excellent linearity and low MAE in predicting the numbers of people living in US from DNAme array, through 151 clock cytosines. (F) The US population EN model was then trained to predict persons’ age with successful tests (near perfect linearity and MAE of 2.6 years) by 149 clock cytosines. (G) This US population clock was also testable as an age predictor on the out-of-sample 450K datasets of indicated diseases (red dots) and their healthy controls (blue dots); health and disease predictions overlapped. (H) The age predictions made by the US population clock are shown as scatter plots overlay for Combined Disease (arthritis, Down Syndrome, HIV and Chron’s – red dots) and their healthy controls (Combined Healthy, blue dots). All GSEs are in Methods.
The models fairly accurately predicted the age of samples, but with an error of age acceleration throughout chronology (shifted above the line) and with overlap in age predictions for the patients and healthy subjects, Figure 2A and Supplementary Figure 2. This is biologically inconsistent, as arthritis significantly increases PBMC inflammaging, [37, 38], Werner Syndrome is a disease of premature aging (caused by a mutation of DNA helicase) [39, 40], and Down syndrome has a pathological juvenile blood phenotype with a prevalence of childhood leukemias and less mature circulating PBMCs [41]. In tests on BRCA-1 studies, the EN model had very high MAE and poor correlation with the age of the healthy subjects but produced fairly accurate predictions for the people with the BRCA-1 mutation, and cancer, Figure 2A.
The 27K EN model that was from the combination of disease and healthy samples surprisingly reported age acceleration when tested on the 450K dataset that was from relatively healthy individuals, Supplementary Figure 2. 27K dataset cytosine probes are present in the 450K dataset. Lastly, we found that a simple ordinary least squares regression (OLS) on the set of clock’s cytosines also yielded linear correlations, and these were somewhat more accurate in predicting age (lesser age acceleration through chronology) than the EN model, Supplementary Figure 2.
In testing PhenoAge, thought to be biologically more relevant, we expanded the approach to multiple independent studies with 450K DNAme arrays on Arthritis, Multiple Sclerosis, Down Syndrome, Parkinson’s, IBS, Werner Syndrome. We analyzed whether predicted age is on average higher for disease samples as compared to their healthy controls. Additionally, instead of MAE on one 450K correlation, which is the Median from an experimental n=1, we quantified the errors as the arithmetic Means of predicted minus actual age, with Standard Deviation (SD) and p-values, in these six large data studies, experimental n=6. In other words, we applied the typical data analysis that is used in biomedical research, when testing for a relevant change.
When applied to the DNAme clock, these analyses demonstrated that PhenoAge generally predicted that both healthy subjects and patients with various diseases were younger than their chronological age (shifted below the line) and these predictions had on average 12-17 years of error, which for some age groups grew to over 20 years, Figure 2B, 2C. The accuracy of PhenoAge was below statistical significance when it was analyzed with n=6, based on the errors for the same age and when comparing health v. disease. This agrees with batch effects causing a lack of reproducibility, and/or with the normally high variation in the underlying biology of epigenetics. PhenoAge predicted Down Syndrome patients to be biologically older than controls, even though their blood cells are reported to be pathologically juvenile [41]. Parkinson’s disease patients surprisingly had a prediction trend of being younger than their healthy controls at 30–40-year range and not statistically different from their healthy controls at all age intervals after 51years, Figure 2D.
The second-generation clocks are trained on, and can thus successfully predict, various biological and health parameters and also age, in both test and out-of-sample datasets. As mentioned above, this property of EN does not in itself require a biological meaning or even a physical connection between the correlated and the measured parameter. To demonstrate this point, we constructed a EN clock that accurately predicted the numbers of people living in US from DNAme array data, and like PhenoAge and PACE, it also predicted people’s age on both the original and out-of-sample datasets, Figure 2E–2G. In fact, the US population clock needed only 149 cytosines for predicting age with 2.6-year MAE and Pearson’s r of 0.97, e.g., outperforming many conventional DNAme clocks, Figure 2E. The DNAme predictor of the size of US population also illustrated that the ML EN process tends to overlap age predictions for health and disease, regardless of the training variable, Figure 2G, 2H. The increase in US population over time is a proxy for chronology, but this is also true for all DNAme clocks, be they trained on age, levels of inflammatory cytokines, packs of cigarettes smoked, composite health scores, or any metric which tends to have a progressive change with time. The meaning of the values that are composed together to create a latent variable are not preserved in EN training. EN regression only requires that there are some features which have at least some moderate correlations with time progression.
As expected from the body of published literature, inflammaging, trisomy and diseases are robustly different from health, and this can be detected with much higher resolution than EN by analyzing the primary, un-adjusted, non-linearized data of the DNAme array. For example, Uniform Manifold Approximation and Projection (UMAP), which preserves the topological structure of the data (with all 450k+ cytosines) while embedding it in multi-dimensional computational space, robustly distinguishes between health and disease in the studied here 450K array datasets, Figure 3 [42].
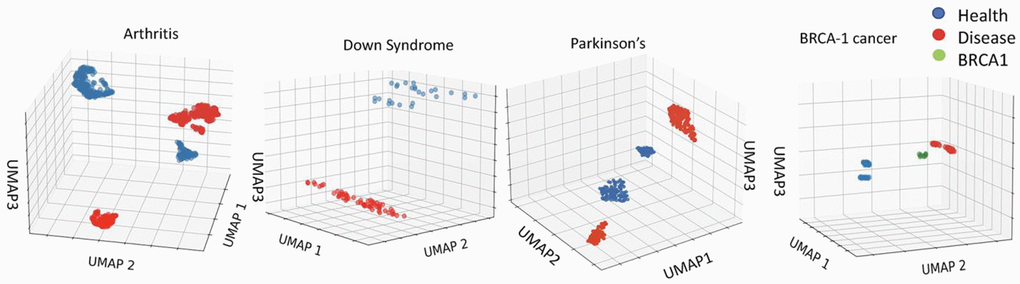
Figure 3. Robust epigenetic differences between health and disease are clear in the 450K datasets. Distinct clustering of DNAme of healthy vs. disease cohorts. UMAP on the 450Kcytosinedataset for Arthritis, Down Syndrome, Parkinson’s Disease and BRCA1 studies (see Methods for dataset identifiers). Each point represents an individual. The clustering of healthy, cancer, and BRCA1 mutation yet no cancer cohorts is distinct for each dataset.
Thus, the input DNAme data accurately reflects the expected significant epigenetic differences between healthy and disease populations. However, under the training of a least erroneous linear correlation EN is expected to minimize the weights of cytosines-beta values, which vary among individuals of the same age (or its proxy) due to a disease. Even when a combination of health parameters is used for training, as with the next generation EN clocks, the disease-imposed DNAme differences that vary between age groups, might be overlooked in search for the best linear predictors of age or age-related outcomes for the whole population.
Summarily, if chronology or its proxy is the response variable, and finding the best linear correlation is the task, the relevance of ML predictors is not obvious. Additionally, random experimental variation of the arrays and/or EN training might be misinterpreted as biologically meaningful change in all generations of clock models.
EN predictors are not based on change in DNA methylation with age
To explore a possible mechanism by which clock features predict age or health scores we studied the assigned weights of cytosine beta values of several published DNAme clock models. The weight assigned by a model to a predictor is a surrogate measure of its importance in the model, as the predictions returned by a model are most sensitive to changes in predictors with the highest weights. Interestingly, we found that EN does not necessarily select cytosines whose methylation either change or correlate strongly with age, and hence are biologically meaningful in such a way, Figure 4A.
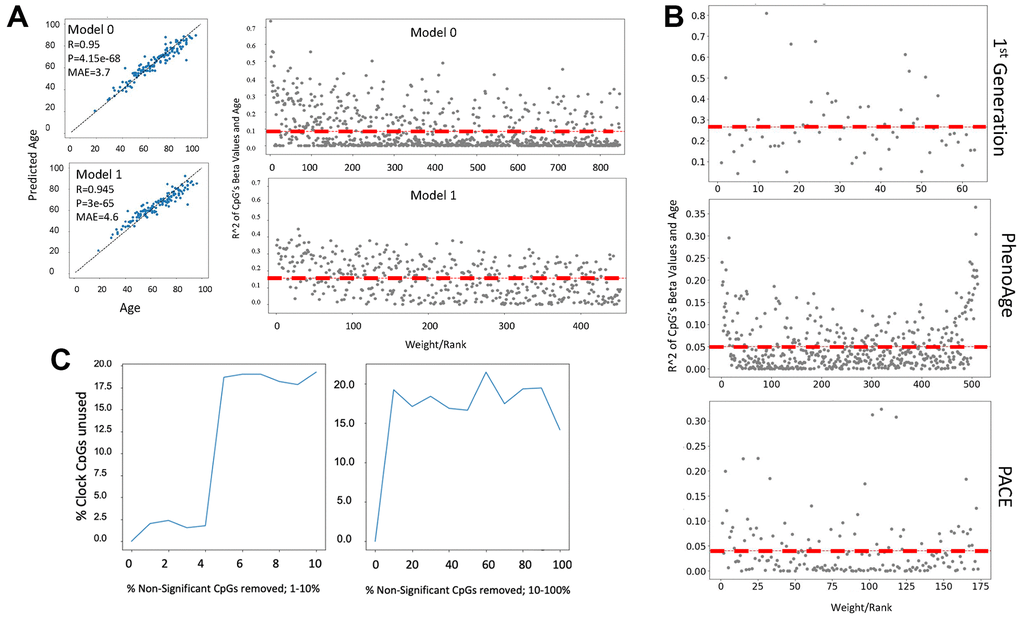
Figure 4. Cytosine ranking by EN is not based on the changes in methylation with age. (A) DNAme clock was constructed with EN regression on a 450K array dataset (GSE40279, N=656), and the test set prediction performance is shown (Model 0). The selected clock cytosines were removed, the model was retrained, and model performance on the test set is shown (Model 1). Scatter plot of the coefficient of variation for each clock cytosine individually regressed on age plotted against their rank by their absolute weights. The mean coefficient of variation of the clock cytosines are shown as red dashed lines. The cytosines of Model 1, e.g., those which were minimized to zero in Model 0, have a higher mean R2, despite being slightly less accurate. (B) Scatter plots of the coefficient of variation for the cytosines regressed on age are plotted against their rank/EN weights of the published 1st generation Hannum clock, PhenoAge and PACE. (C) An EN clock was trained with a 450K dataset (GSE40279), then non-clock cytosines were randomly removed: independently in a stepwise fashion. After each iteration of removal, a new EN model was trained and the selected set of cytosines was compared to the set of original clock cytosines. Non-clock cytosines were removed in one percent increments from 0-10% (left panel) and 10% increments from 10-100% (right panel). At 2% of removal of the non-clock cytosines, the cytosine set selected by EN began significantly changing. The percentage of unused original cytosines plateau at 17% in both gradual (1% at a time) and rapid (10% at a time) removal of the non-clock cytosines.
In fact, the ranking of cytosines as per their methylation change with age became better, yet MAE became slightly worse, after all the original clock picked cytosines were removed from the dataset, and as expected, EN selected the next weighted best fit linear predictor set, Figure 4A. The redundancy of cytosine sets is known, e.g., EN is “resilient” to specific cytosines, or their combination, and it is the EN process on large data that gives the linear correlation. In support of these finding, the changes of DNAme with age were not the determinant of the ranking of cytosines by the published 1st generation clock trained on age or PhenoAge, and PACE trained on health/disease parameters [1–5], (Figure 4B). The red dashed lines are the mean coefficient of variation and that the line remains flat with age signifies the irrelevance of age-specific changes in DNAme for the ranking of clock’s cytosines.
Exploring the mechanisms of cytosines selection further, we next removed not the clock picked cytosines, but the cytosines that were excluded from the model by EN, and then retrained EN on the remaining set, and we did this repeatedly, Figure 4B. Removal of unpicked cytosines significantly changed the picked cytosines from the original training, plateauing at 17-20% of the unused original set after removal of 3-4% of irrelevant cytosines. DeepmAge, PhenoAge and Hannum’s 71 clock cytosines were similarly deselected upon the non-clock cytosine removal, Supplementary Figure 3A–3C.
Such behavior does not agree with a hypothesis that biomarkers should not change when non-biomarkers are deleted from a dataset and supports the null hypothesis that picked cytosines are not biomarkers. ML methods that rely on stochastic gradient descent for optimization appear to suffer from the pitfall that removal or absence of certain features changes the hyper surface of the feature space which influences the local optima (i.e., feature sets, weights and hyperparameter values) that the gradient descent can converge upon. This point was experimentally supported by studying the effects of removing the non-significant cytosines on the energy landscape of EN, Supplementary Figure 3D.
Summarily, the biomedical significance of clock cytosines is not clear, and DNAme clocks are not directly based on the changes in DNA methylation with age or disease.
It is not absolute beta values, but the noise (SD) of certain cytosines that biomarks biological age
In the final part of our study, we quantify biological age from the DNAme arrays data, using six independent studies with 450K DNAme arrays that were performed on 1806 samples. We postulated that homeostatically vital cytosines would serve well as the detectors of biological noise, which in our hypothesis is a biomarker of aging and disease. Furthermore, we postulated that such noise detecting cytosines can be characterized and thus identified by a nearly equivalent Mean of their beta values between young and old, but a higher SD about the Mean with age. Our goal was to measure this indicator of biological age, not to predict it.
The age-imposed increase in the DNAme noise is visible when looking at a scatter plot of the beta values of individual cytosines that are on average invariable in their methylation across the lifespan, as exemplified in Figure 5A (each dot is an individual). To capture this biological phenomenon from the DNAme array data, we first specifically identified the cytosines that remain on average invariable in their methylation through age (Pearson’s (r) 0.02-0.05 of beta values over age) and become deregulated or “noisy” with age (change in absolute distance of their beta values from the Mean, ADM); this yielded 50 cytosines out of the 450K DNAme array, GSE42861 dataset, Figure 5B. Consistent with the hypothesis of biological relevance, all these cytosines turned out to be in vital genes known to be homeostatically regulated, Table 1 and Supplementary Data Excel, which shows genome loci annotations of the 50 noise detector cytosines. The biological age (Right Y axis) was then quantified based on the Median of the normalized by the young age sums of SDs of these 50 cytosines (Left Y axis). This unadjusted primary data had a good fit with polynomial curve, it displayed age-imposed increase in biological noise with a plateau at ~35-45 years of age, in healthy subjects, and a clear increase in the noise for the young and middle-aged patients with arthritis, Figure 5B (each dot represents the indicated age; the raw data with dots representing individuals per each age is shown in Supplementary Figure 4A).
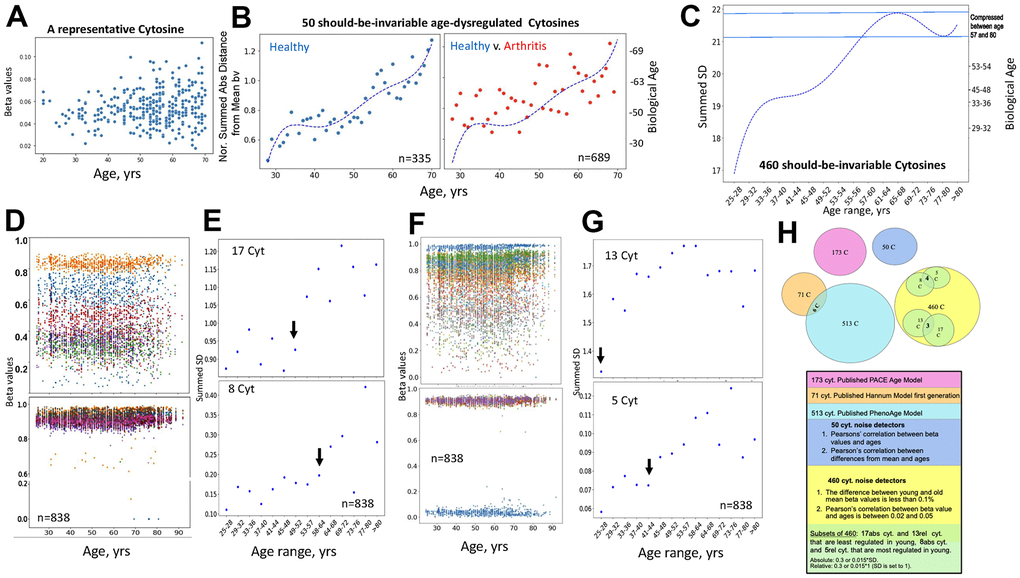
Figure 5. Direct quantification of biological age from DNAme array data through noise barometer. (A) Representative cytosine that is on average invariable in its methylation throughout lifespan but becomes visibly noisier, showing higher absolute deviation from the mean in older individuals. Each dot is an individual. (B) Polynomial curve was fitted to the dot-plot of Median of normalized by healthy young sums of SDs of the 50 cytosines for healthy individuals, left; the same polynomial curve is overlayed with the dot plot of the Median of normalized by healthy young sums of SDs of the 50 cytosines for arthritis patients, right. Biological ages were mapped onto the right Y axis, as described in Methods. Each dot is age range: blue – healthy, red, arthritis. (C) Polynomial curve was fitted to the 460 Summed SDs (of the 460 cytosines) v. chronological age ranges, using the six combined 450K DNAme datasets of healthy controls. Right Y axis shows mapping of the summed SDs into biological ages and the compression of specific age ranges. (D) Scatter plots on the changes in beta values over age for representative cytosines that are least regulated in young, with SD=0.3 of absolute Mean of beta values, and all 8 most regulated in young cytosines with SD=0.015 of absolute Mean of beta values. Each dot is a sample. (E) Dot plots of the summed SDs of the 17 cytosines and of the 8 cytosines. Each dot is 49 samples on average. Black arrows indicate transitions from low to high noise. (F) Same as (D), but for cytosines that have SD=0.3 and 0.015 of the relative Mean of beta values. (G) Same as (E), but for the summed cytosines with SD=0.3 and 0.015 of the relative Mean of beta values. (H) Venn diagrams of the cytosines of the published clocks and the 460, 50 and 5, 8 – most regulated, 13, 17 least regulated cytosines of the noise barometer that quantifies biological age; the text is color-coded per each cytosine set.
Table 1. Families and functions of the genes annotated to the 50 cytosines noise biomarkers.
| Probe | Gene | Family | Effects |
| cg00868523 | PRKCG | Protein Kinase C | Pleiotropic |
| cg01767885 | C1QTNF8 | C1q/TNF-Related | Cell motility - vital |
| cg01869186 | EPHB4 | Ephrin receptor/RTK | Vascular repair - vital |
| cg01900413 | ETS-1 | TF | Pleiotropic |
| cg02247160 | CTNNB1 | Beta-catenin | Pleiotropic |
| cg04153991 | PHLDB2 | Regulators of cadherin | Cell adhesion and cytoskeleton - vital |
| cg04495670 | FGF3 | FGF, MAPK signaling | Pleiotropic |
| cg06362282 | B3GALT4 | Membrane-bound Galactosyltransferase | Pleiotropic |
| cg06494091 | GNAQ | Guanine nucleotide-binding protein | Pleiotropic |
| cg06918474 | 3-Mar | Membrane associated ring-CH-type finger | E3 ligase - Pleiotropic |
| cg08499046 | Pax6 | TF | Pleiotropic |
| cg12615535 | RBP1 | Carrier protein | Retinol transporter - Pleiotropic |
| cg12717533 | FAM59B | GRB2 Associated | Regulator of MAPK1 - Pleiotropic |
| cg12779520 | CD6 | T-Cell Differentiation Antigen | Continuation of T cell activation |
| cg13399816 | GNG12 | G protein-coupled receptor signaling | Pleiotropic |
| cg13966628 | FMN2 | Formin homology | Actin cytoskeleton, cell polarity - Pleiotropic |
| cg14993491 | PCSK9 | Proprotein Convertase | Regulate the amount of cholesterol in the bloodstream - vital |
| cg15556672 | MRPS36 | Ribosomal proteins | Mitochondrial Ribosomal Protein S36 - vital |
| cg17096412 | TMEM98 | Transmembrane proteins | Secreted form promotes differentiation of Th1 cells Negative regulator of MYRF |
| cg17216583 | RPL22 | Ribosomal proteins | Ribosomal protein component of the 60S subunit - vital |
| cg19355182 | PDE4A | Phosphodiesterase | hydrolyzes cAMP - Pleiotropic |
| cg20261915 | GLP2R | G protein-coupled receptor | Glucagon receptor - vital |
| cg20283716 | ASPSCR1 | Tether with UBX Domain | GLUT4 regulation / insulin response - vital |
| cg23417875 | MAP4K4 | MAPK signaling | Activates JNK - Pleiotropic |
| cg23801965 | GSC2 | Goosecoid-like homeodomain | Axis formation - Pleiotropic |
| cg23983449 | GABARAP | GABA R associated proteins | Regulates ligand-gated chloride channels and neurotransmitter signaling |
| cg24027320 | TASP1 | Endopeptidase | Maintenance of HOX and TFIIA gene expression Pleiotropic, vital |
| cg24112454 | KIAA1409 | Ionic channels | accessory subunit of the NALCN channel that contributes to the Ca2 sensitivity - vital |
| cg27621745 | CHMP4C | Chromatin modifying /charged multivesicular body family | MVB formation and regulation of cell cycle progression - Pleiotropic |
| cg27642618 | CD33 | Sialic-acid-binding Ig-like lectin | Cell-cell interactions Pleiotropic. Resting state of immune cells. |
| cg07165260 | KIAA0513 | Uncharacterized | Uncharacterized |
| cg16443148 | CCDC78 | Coiled-coiled domain | Unknown |
| cg25007283 | ZIC4 | C2H2-type zinc finger | Not well characterized |
| cg00479463 | * | * | * |
| cg01681847 | * | * | * |
| cg05207943 | * | * | * |
| cg06899313 | * | * | * |
| cg07710266 | * | * | * |
| cg12518535 | * | * | * |
| cg14400541 | * | * | * |
| cg14657277 | * | * | * |
| cg20037507 | * | * | * |
| cg20445245 | * | * | * |
| cg24201362 | * | * | * |
| cg25734842 | * | * | * |
| cg27219748 | * | * | * |
| cg27317439 | * | * | * |
| * Not characterized. |
Next, we examined if DNAme noise, which we define as the age-imposed increase in SD of beta values, would self-manifest when we select cytosines solely based on their nearly-same methylation through chronology. We identified all the cytosines with less than 0.1% difference in the Means of their beta values between the young (25-28years) and the old (67+ years) individuals, in the healthy controls’ datasets of the studies on Down Syndrome, Arthritis, Parkinson’s, Multiple Sclerosis, IBS, and Werner Syndrome. A healthy change in cytosine noise is biologically expected as the immune system matures [43, 44], thus our young range is 25-28 years. These cytosines that are well-regulated through age were also cross-checked by having Pearson’s (r) 0.02-0.05 of beta values over age, e.g., excluding the zeroes of experimental errors; this approach yielded 460 cytosines that had minimal change in their Mean methylation with age. Interestingly and in agreement with our hypothesis, every one of these cytosines, whose methylation on average was age-invariable, manifested an increase in SD – DNAme noise with age, Figure 5C and Supplementary Data Excel. This unadjusted primary data had a good fit with a polynomial curve of chronological ages v. summed SD (Left Y Axis); and the non-linearity of the pattern compressed certain biological ages, which were mapped onto the Right Y axis by entering the summed SDs into the polynomial equation, Figure 5C.
Next, we narrowed down the 460-cytosine set of the noise detectors to those which are most regulated in the young cohort and those least regulated in the young cohort; once again, identifying the cytosines with these properties that are shared between all studied six healthy controls’ datasets. Out of 450K array data, only 460 cytosines had nearly the same Mean of beta values in young and old cohorts, and out of these only 8 had SD of >0.015 of the absolute Mean and only 5 had SD of >0.015 of a relative (set to 1) Mean of their beta values, e.g., they were the most regulated. Very interestingly, all the 8 and 4 out of the 5 were highly methylated (beta values ~1) and the remaining one cytosine had beta value near 0 – unmethylated; none were in-between or partially methylated, even though the samples analyzed for cytosine methylation were of a mixed population of peripheral blood cells, Figure 5D, 5F.
It is possible that these cytosines reflect loci that should be always completely silenced (say, controlling a different cell fate) or open (say, for housekeeping genes), regardless of the cell types of the circulating cells. In contrast, the cytosines that were the least regulated in the young cohort, 17 cytosines with SD of <0.3 of the absolute Mean and 13 cytosines with SD of <0.3 of a relative=1 Mean, had a large range of methylation (spanning the 0-1 range of beta values), Figure 5D, 5F. Other least regulated cytosines are shown in Supplementary Figure 4B. Annotations for the 5, 8, 13 and 17 cytosines – noise detectors are in Supplementary Data Excel.
Summing the 8, or the 5, or the 17, or the 13 Means of the SDs for each 3-year age interval between 25 and over 80 years, established that each set detected a natural pattern of human biological aging with a progression of epigenetic noise that is low in young, high in old, and has healthy, low noise plateaus, Figure 5E, 5G (each dot is 49 individuals on average, black arrows point to the 3-year interval before the upward transitions in noise). Interestingly, both the least and most regulated cytosines, which were identified as such by the two approaches in the young samples, became noisier with age, Figure 5E, 5G. 64-67 years and 49-52 years demarcated the upward shifts in biological noise (black arrows) for the 8 most- and 17 least-regulated cytosines, respectively, (the SD of the absolute Mean of beta values), Figure 5E. 41-44 years and the very early 29-32 years transitions from low to high biological noise (black arrows) were detected for the 5 most- and 13 least-regulated cytosines, respectively (SD of the relative Mean of beta values), Figure 5G.
We think of this measurement of noise increase with age as a barometer, implying epigenetic pressure on homeostatic gene regulation.
The 460 cytosines that had constant Means with age and the 50 cytosines found on average invariant yet noisier with age by linear regressions, were independent of the first-gen, PhenoAge and PACE EN cytosine sets, Figure 5H. The young-to-adult focused PACE cytosine set was also expectedly different from the full age-range focused first generation and PhenoAge models.
Next, we examined differences between health and disease, using the combined DNAme array data from the six studies by different laboratories. As mentioned, all 460 cytosines of noise barometer self-manifested higher SD of beta values in the old as compared to young, and 293 of these cytosines had at least 20% increase in their SDs with age. Interestingly and consistently with the fundamental paradigm of DNAme noise as a biomarker of aging and disease, summing the SDs of 460, 293 or 5 cytosines yielded similar patterns of healthy biological aging and the disease-imposed shifts, Figure 6A. Moreover, this pattern of biological aging and difference between health and disease were also yielded by SD of a single noise barometer cytosine (one of the most regulated in young), Figure 6A. The overlap between health and disease at certain ages is expected from the overall elevation of diseases with age (not just those studied), and from the possibility of pathologically diminished biological noise in some disease stages due to reduced complexity of blood cells (less lymphocytes and greater prevalence of inflammatory macrophages).
![The fundamental paradigm of noise barometer; DNAme clocks do not rely on DNAme noise. (A) Shown are polynomial fit curves of the chronological age v. sums of 460-, 293-, 5 SDs, SD and the dot plot line-fit of a single cytosine from the most regulated in young group, and the sums of 143, 448 SDs of all heteroscedastic cytosines with 20% or larger SD in old than young; the unfiltered 450K summed SDs are the black dot scatter that is overlaid with the 143, 448 (143K) line graph. These data are on the six combined datasets of patients with various diseases (red lines) and their healthy controls (blue lines). All noise detectors, but not the unfiltered 450K DNAme cytosines, outline a similar progression of biological aging of the healthy subjects, clearly distinguishing it from the disease-influenced changes. Each dot is the age range. (B) Dashed blue line shows the Median of summed SDs of three DNAme array healthy controls datasets that have the most samples (Arthritis, MS, and PD); this Median line is overlayed with the dot plots of each of these individual datasets, color-coded. Each dot is the age range. (C) Venn Diagrams show the presence of the 143K cytosines in the 50 and 460 noise barometers and in the DNAme EN clocks, color-coding is the same, as in Figure 5. (D) Scatter plots of the coefficient of variation of the cytosines’ SD regressed on age are plotted against their rank/EN weights for the published 1st generation clock, PhenoAge and PACE, [1–5].](/article/205046/figure/f6/large)
Figure 6. The fundamental paradigm of noise barometer; DNAme clocks do not rely on DNAme noise. (A) Shown are polynomial fit curves of the chronological age v. sums of 460-, 293-, 5 SDs, SD and the dot plot line-fit of a single cytosine from the most regulated in young group, and the sums of 143, 448 SDs of all heteroscedastic cytosines with 20% or larger SD in old than young; the unfiltered 450K summed SDs are the black dot scatter that is overlaid with the 143, 448 (143K) line graph. These data are on the six combined datasets of patients with various diseases (red lines) and their healthy controls (blue lines). All noise detectors, but not the unfiltered 450K DNAme cytosines, outline a similar progression of biological aging of the healthy subjects, clearly distinguishing it from the disease-influenced changes. Each dot is the age range. (B) Dashed blue line shows the Median of summed SDs of three DNAme array healthy controls datasets that have the most samples (Arthritis, MS, and PD); this Median line is overlayed with the dot plots of each of these individual datasets, color-coded. Each dot is the age range. (C) Venn Diagrams show the presence of the 143K cytosines in the 50 and 460 noise barometers and in the DNAme EN clocks, color-coding is the same, as in Figure 5. (D) Scatter plots of the coefficient of variation of the cytosines’ SD regressed on age are plotted against their rank/EN weights for the published 1st generation clock, PhenoAge and PACE, [1–5].
Confirming that selection of noise detecting cytosines is important, sums of SDs of all cytosines from these six combined 450K DNAme array healthy controls’ datasets showed a random scatter through chronological age, Figure 6A, each black dot is an age range. At the same time, in agreement with the fundamental nature of the noise / SD approach, 1/4th of 450K DNAme array cytosines (143,448 cytosines) was found to be significantly heteroscedastic and having 20% or more increase of the SDs of their beta values with age. Summing the 143,448 SDs yielded a similar pattern of biological aging and disease-imposed shifts, as when using 460, 293, 5, or 1 cytosine(s), Figure 6A.
Similar shapes of the healthy curves and good resolution between health and disease in the combined data from six independent studies by different laboratories suggested batch effect resilience of our noise barometer. This was confirmed and extrapolated by comparing the three most numerous healthy control datasets (from the studies of Arthritis, Parkinson’s, and Multiple Sclerosis) in their biological aging curves, Figure 6B and Supplementary Data Excel. Low batch effect was seen for the three individual healthy datasets, except in the 49-64 years age range, which could be due to a natural increase in DNAme dynamics from cumulatively diverging environments, habits, and diseases (not just those specifically studied), Figure 6B. Based on Venn Diagrams, 460 cytosine noise detectors have the highest overlap with the global 143 thousand subset, followed by the 50 cytosine noise detectors and various EN DNAme clocks, Figure 6C and Supplementary Data Excel.
The pattern of healthy biological aging based on the 460 and 5 cytosines was also similar to that yielded by the 50 cytosines, Figures 5B, 6A. And the 50 cytosines noise barometer demonstrated different curve shapes for different diseases, Supplementary Figure 5A. At the single levels, the most regulated cytosines – noise detectors had different patterns of their age-specific noise increase, Supplementary Figure 5B and Figure 6A. The natural biological aging curves of the combined health vs. combined disease that include the HIV dataset, are shown in Supplementary Figure 5C.
Since SD is the main parameter in our noise barometer, we also tested if EN clocks might be based on selection of cytosines that have higher SD of their beta values with age and/or disease. The regression analysis demonstrated that this is not the case for either the 1st generation EN clock that is trained on age or for PhenoAge or for PACE that are trained on health/disease parameters [1–5]. Namely, there was a lack of correlation between the ranking (weighting) of the clock’s cytosines by the ENs and the changes of the SDs of their beta values with age, Figure 6D.
These results suggest that biological age can be measured in a batch effect resilient approach through quantification of the SD of the methylation of cytosines that should-be-invariable, yet are age deregulated. The natural curve of biological aging defined by this approach is not linear; it has healthy low-noise plateaus and upward shifts at specific ages. In this method, DNAme noise is the biomarker and a particular set of cytosines is the detector of such biomarker. This method is different from and moreover, orthogonal to, the linear predictors that are based on population statistics. Importantly, regardless of the selection of all the cytosines that should-be-invariable (50, 460) or their subsets most or least regulated in young (1, 5, 8, 13, 17), an increase of biological noise with age was always observed, and there was never a high in young to low in old progression for any cytosine of the noise barometer.