Identification and functional enrichment of differentially expressed HMs
Of the 539 KIRC samples and 72 control normal samples, 21 down-regulated and 27 up-regulated HMs were identified and the results were presented in Figure 1A, 1B. GO analysis (Figure 2A) showed that the GO terms with the highest enrichment in the biological process (BP) classification were histone modification, chromatin organization, peptidyl−lysine modification, chromatin remodeling and histone methylation. In the cellular component (CC) content, condensed chromosome, chromosomal region and spindle were the main enriched GO terms. Histone binding, methyltransferase activity, transferase activity and transferring one−carbon groups were the significantly enriched GO terms in the category of molecular function (MF). The enrichment analysis of KEGG pathways implied that HMs may be closely associated with Lysine degradation (Figure 2B).
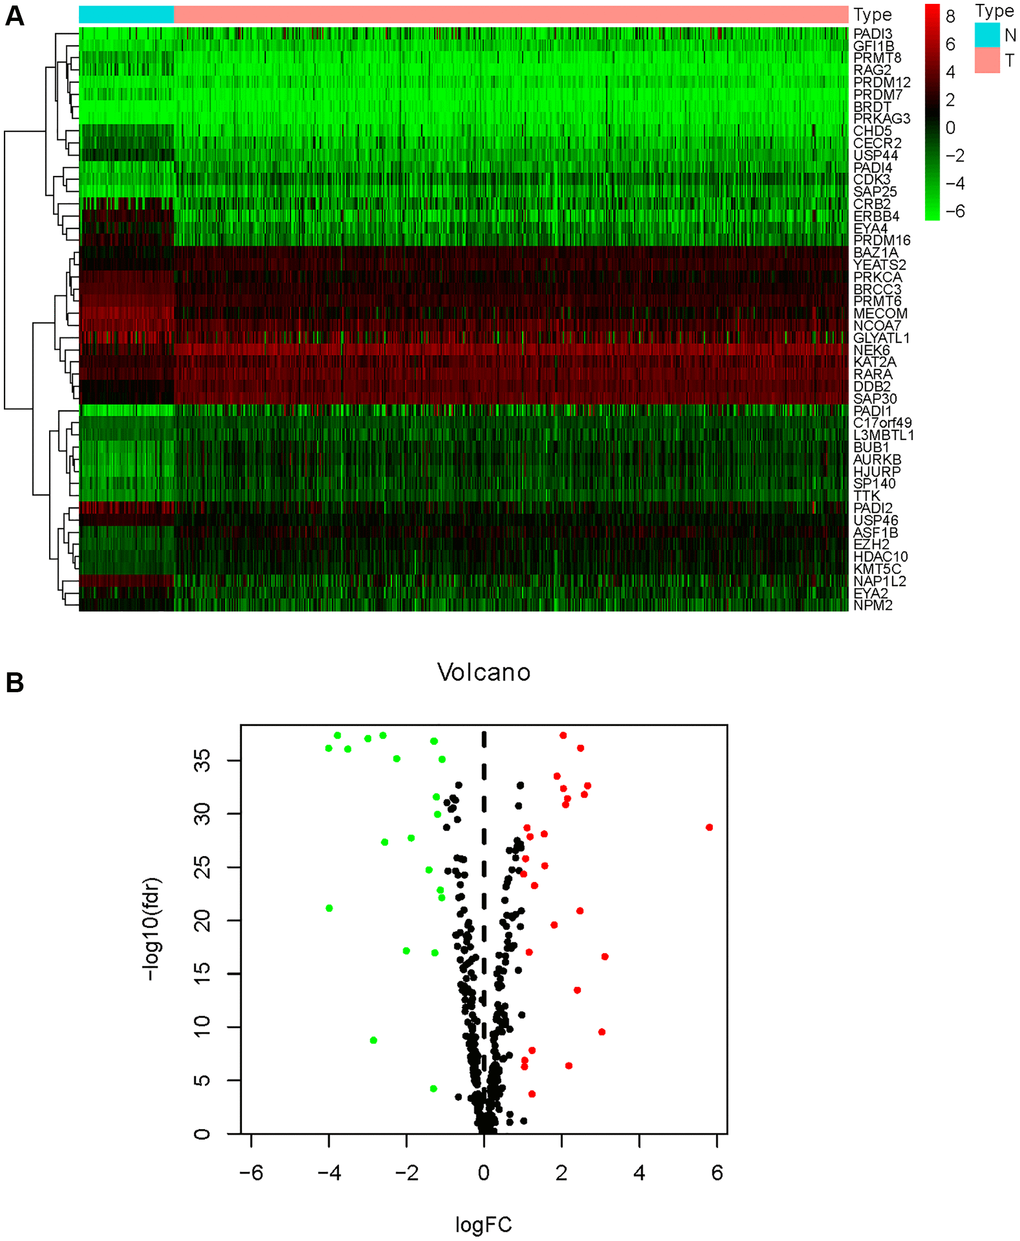
Figure 1. Differential expression analysis of HMs. (A) The heatmap displayed the differential expression of HMs between KIRC samples and normal control samples. Red represented up-regulation of HMs expression, green represented down-regulation of HMs expression. (B) Volcano displayed the differential expression of HMs in KIRC samples.
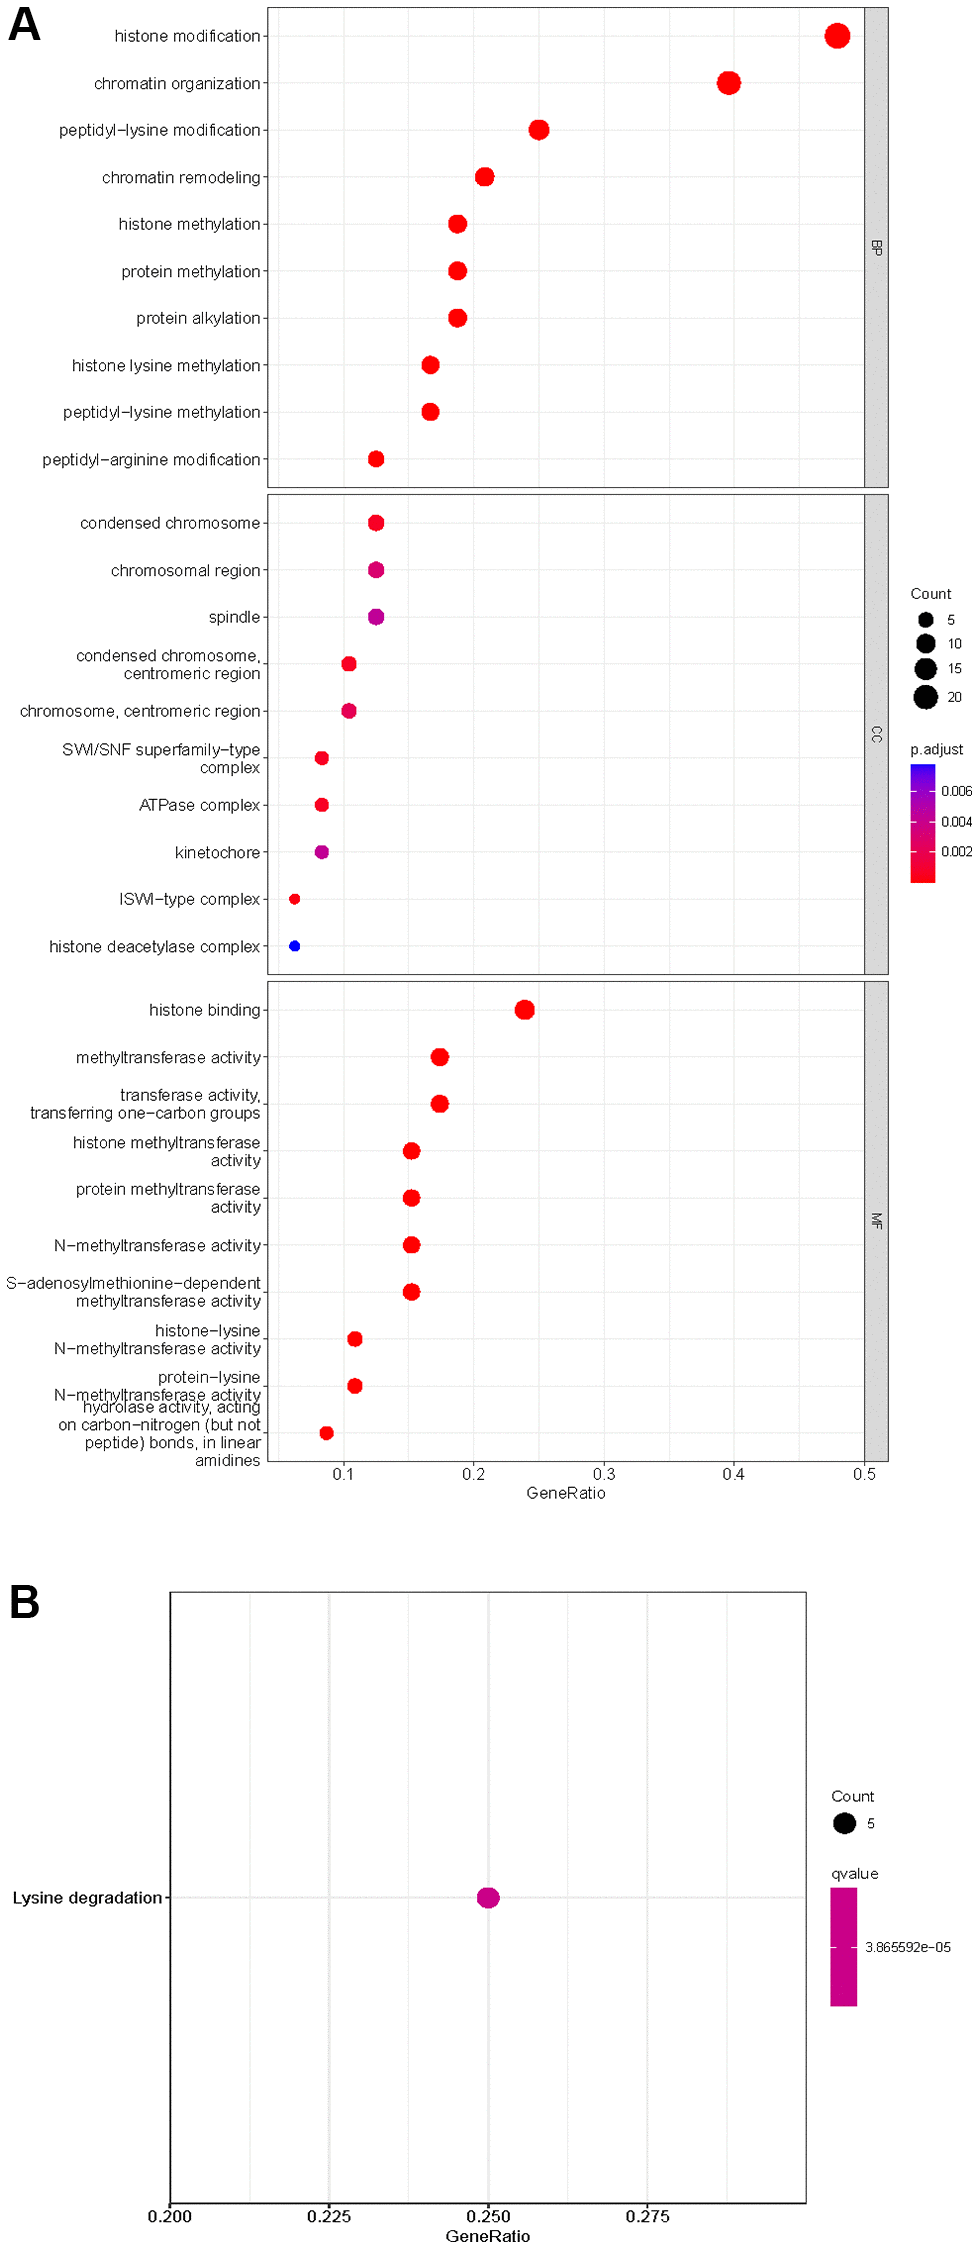
Figure 2. Enrichment analysis of HMs differentially expressed in KIRC. (A) GO analysis of HMs. (B) KEGG pathway enrichment analysis of HMs.
Construction and verification of HMs-based signature
In all, 515 samples from the KIRC met the inclusion criteria for follow-up research. These KIRC samples were further divided into 361 samples as a training set and 154 samples as a test set in a 7:3 ratio by care method sampling. Univariate analysis of differentially expressed HMs in the training set were performed and 21 HMs that significantly correlated with the prognosis of KIRC were identified (Figure 4A). Those HMs that were over-fitted to the model were eliminated, and finally 8 HMs (C17orf49, GLYATL1, HJURP, KAT2A, NCOA7, NEK6, PRDM16, TTK) were identified to build a risk model (Figure 4B, 4C). The risk score can be calculated from the mRNA expression of HMs and the relevant coefficients (Table 1) with the following equation: riskscore = 0.0280971627824297 × C17orf49 expression + (−0.107290283832969) × GLYATL1 expression + 0.520165069344535 × HJURP expression + 0.241951166184651 × KAT2A expression + (−0.00243111668616741) × NCOA7 expression + (−0.13291750024586) × NEK6 expression + (−0.500207346820667) × PRDM16 expression + 0.209483791892391 × TTK expression. As a cut-off value, the median risk score was used to divide the KIRC samples into high-risk and low-risk categories. In the two-dimensional plane, PCA and t-SNE analysis (Figure 5) showed significant dispersion between KIRC samples of high- and low-risk groups. The mRNA expression of the 8 HMs in the high-risk group and the low-risk group was shown in Figure 6A. The correlation between the risk signature and the survival of the KIRC samples were shown in Figure 6B–6D. The KIRC samples in the high-risk group had significantly shorter survival time and significantly higher mortality rates than the samples in the low-risk group. The ROC curve showed an accuracy of 0.706 and 0.748 for the risk score to predict 3- and 5-year OS for the KIRC samples, respectively (Figure 6E). A same analysis was performed on the test set as well as the entire set to verify the stability and reliability of the risk model derived from training set. As shown in Figures 7A, 8A, test and overall sets of KIRC samples of high- and low-risk groups displayed similar expression level of HMs as the training samples. Survival differences between high-risk group and low-risk group in the test (Figure 7B–7D) and overall set (Figure 8B–8D) were consistent with those in the risk model. The accuracy of the test set’s risk score in predicting 3- and 5-year OS for KIRC samples was 0.738 and 0.749, respectively (Figure 7E) and 0.702 and 0.722, respectively in the entire set (Figure 8E). Analyses of the test set and the total set showed good stability and reliability of the risk model.
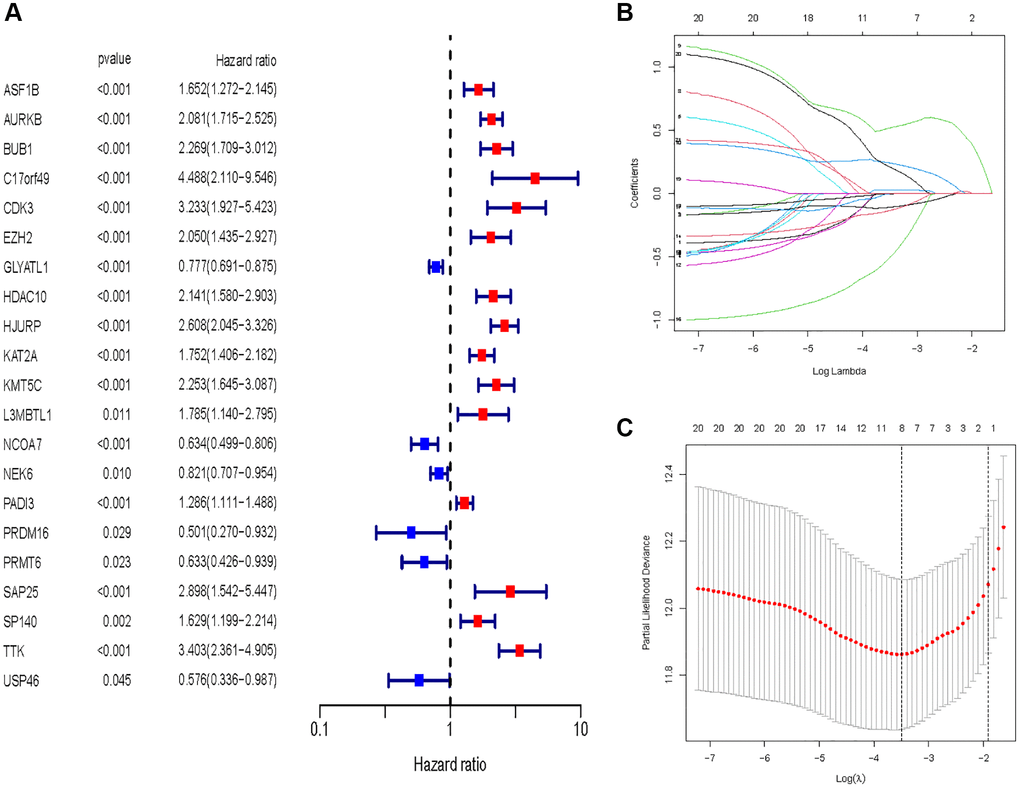
Figure 4. Identification of HMs for construction of risk model. (A) Identification of differentially expressed HMs associated with prognosis of KIRC samples by univariate analysis. (B) Elimination of HMs with model overfitting by LASSO analysis. (C) Tenfold cross-validation for tuning parameter selection in the LASSO analysis.
Table 1. Genes and coefficient in risk models.
| Gene symbol | Coefficient |
| C17orf49 | 0.028097 |
| GLYATL1 | −0.10729 |
| HJURP | 0.520165 |
| KAT2A | 0.241951 |
| NCOA7 | −0.00243 |
| NEK6 | −0.13292 |
| PRDM16 | −0.50021 |
| TTK | 0.209484 |
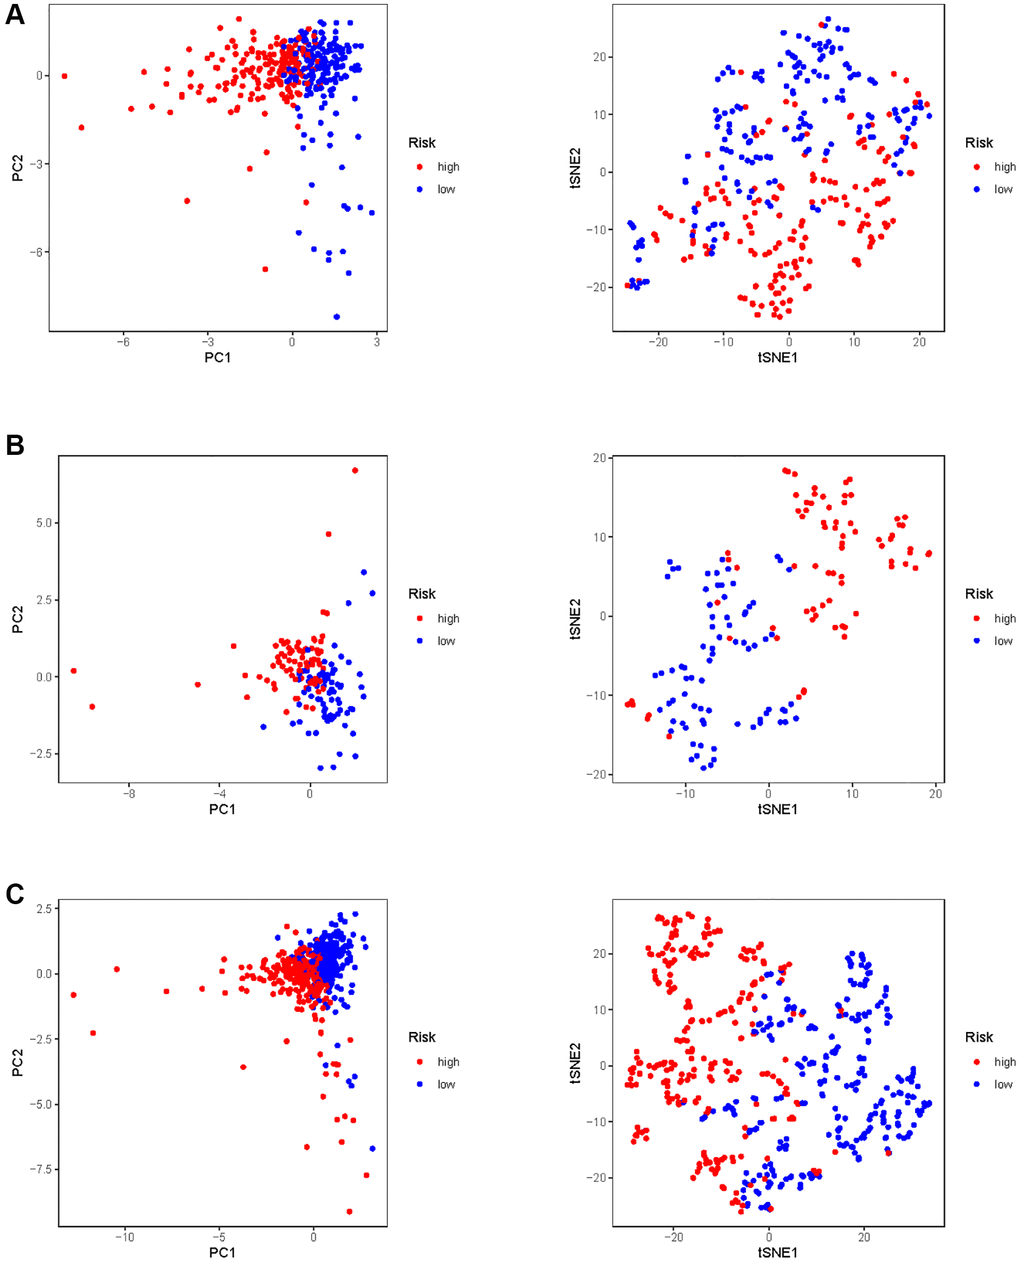
Figure 5. PCA and t-SNE analysis of risk model in KIRC. (A) PCA and t-SNE analysis of risk model in training set. (B) PCA and t-SNE analysis of risk model in test set. (C) PCA and t-SNE analysis of risk models in entire set.
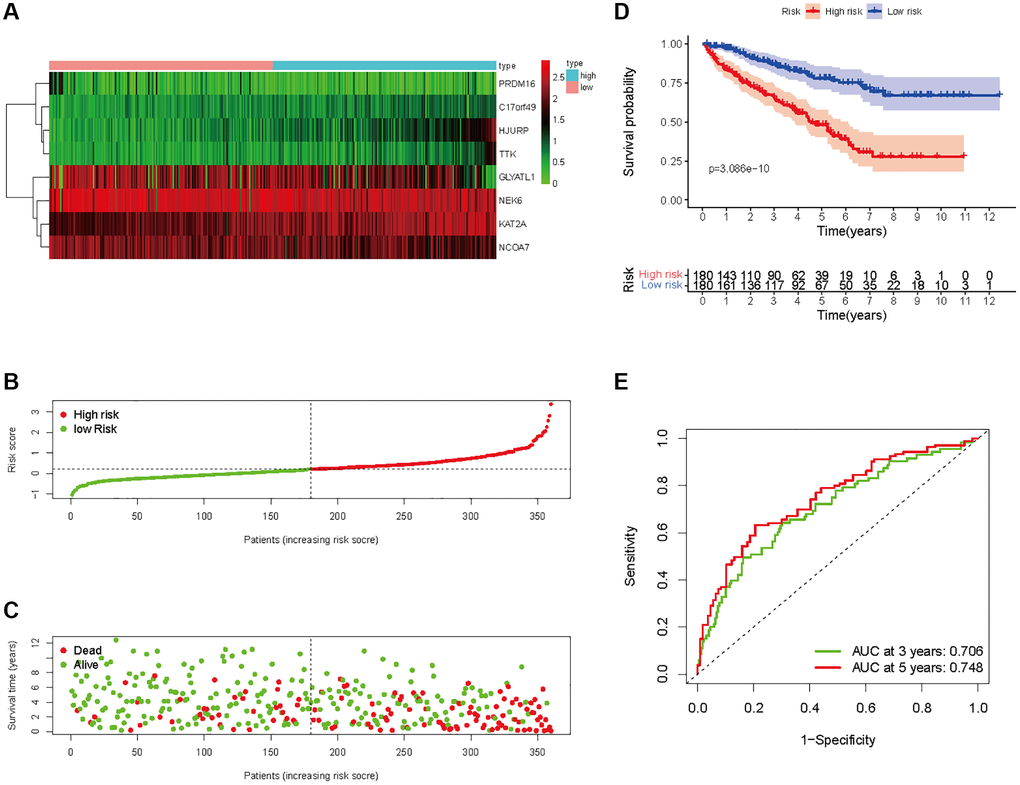
Figure 6. Prognostic analysis of HMs-based signature in the training set. (A) Expression of HMs of KIRC samples between high- and low-risk groups. (B) Kaplan-Meier survival analysis of KIRC samples between high- and low-risk groups. (C, D) Analysis of differences in survival status of KIRC samples between high- and low-risk groups. (E) Time-dependent ROC curve analysis of risk scores predicting 3- and 5- year OS in the KIRC samples.
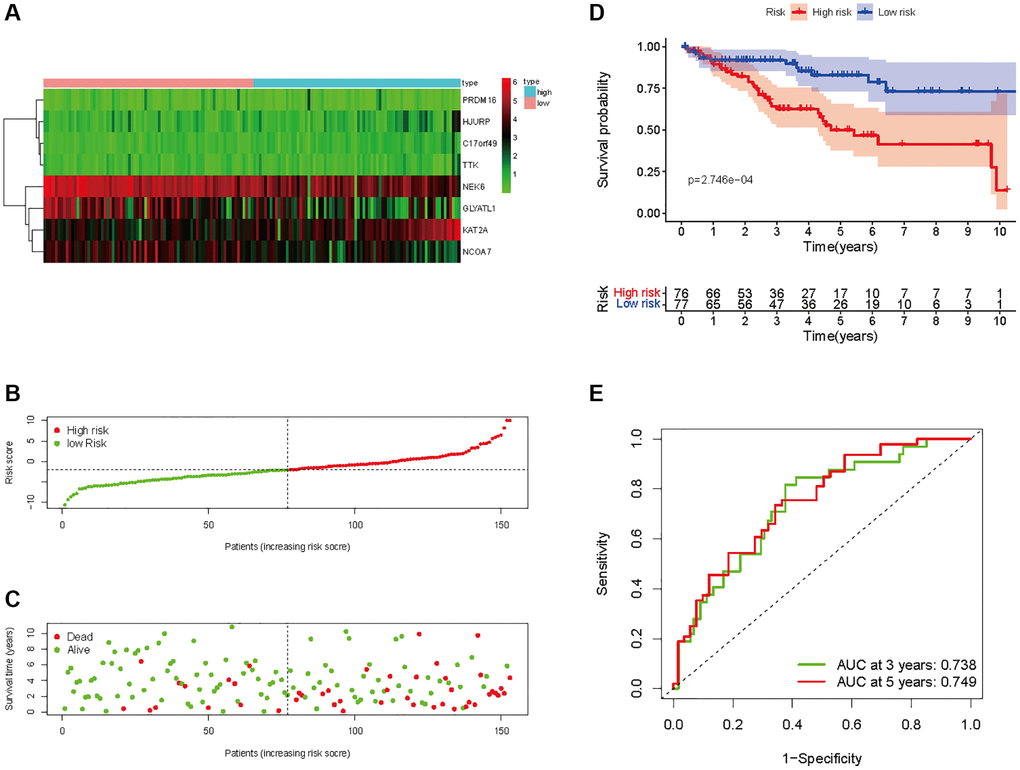
Figure 7. Prognostic analysis of HMs-based signature in the test set. (A) Expression of HMs of KIRC samples between high- and low-risk groups. (B) Kaplan-Meier survival analysis of KIRC samples between high- and low-risk groups. (C, D) Analysis of differences in survival status of KIRC samples between high- and low-risk groups. (E) Time-dependent ROC curve analysis of risk scores predicting 3- and 5-year OS in the KIRC samples.
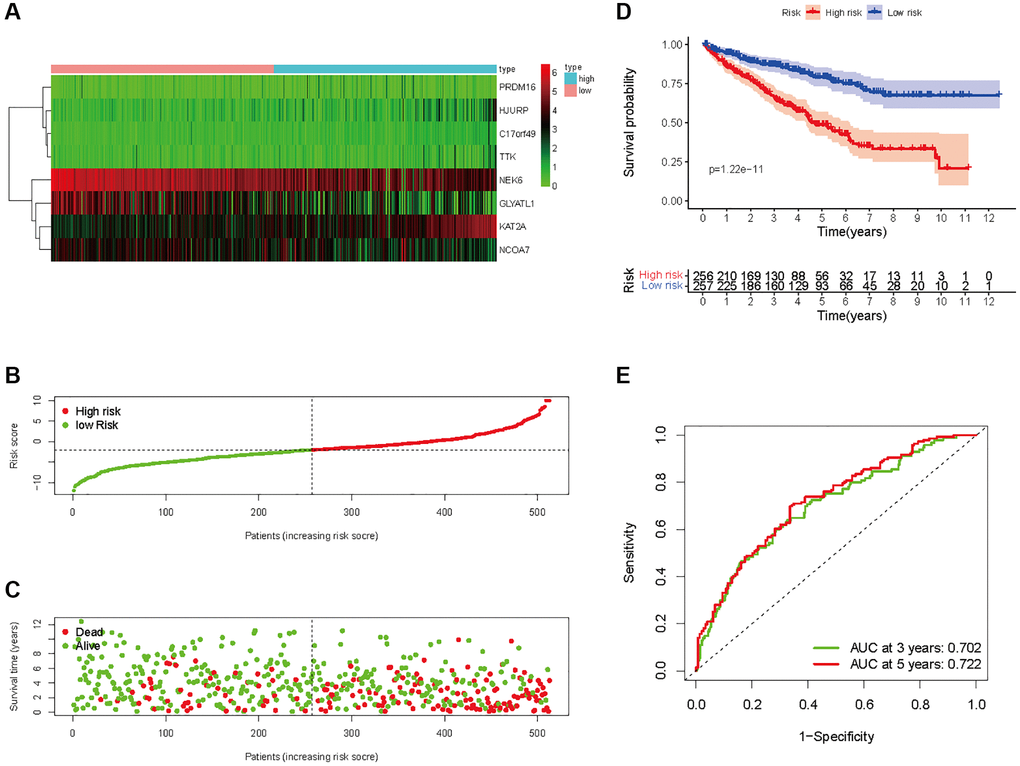
Figure 8. Prognostic analysis of HMs-based signature in the entire set. (A) Expression of HMs of KIRC samples between high- and low-risk groups. (B) Kaplan-Meier survival analysis of KIRC samples between high- and low-risk groups. (C, D) Analysis of differences in survival status of KIRC samples between high- and low-risk groups. (E) Time-dependent ROC curve analysis of risk scores predicting 3- and 5-year OS in the KIRC samples.
Construction of prognostic models
A univariate Cox analysis was conducted using variables including age, gender, grade, stage, and risk score (Figure 10A). Univariate Cox analysis revealed close correlations between age (p < 0.001), grade (p < 0.001), stage and risk score (p < 0.001) for the prognosis of KIRC samples. Further multivariate Cox analyses were implemented using age, grade, stage, and risk score. Cox analysis of the KIRC samples revealed that age (p < 0.001), grade (p = 0.053), stage (p < 0.001), and risk score (p < 0.001) influenced prognosis independently (Figure 10B). In addition, ROC curves of several clinical variables and risk score predicting the OS of KIRC samples shown that risk score (AUC = 0.768) can be as accurate as or better than some traditional clinical variables in predicting KIRC samples’ prognosis (Figure 10C).
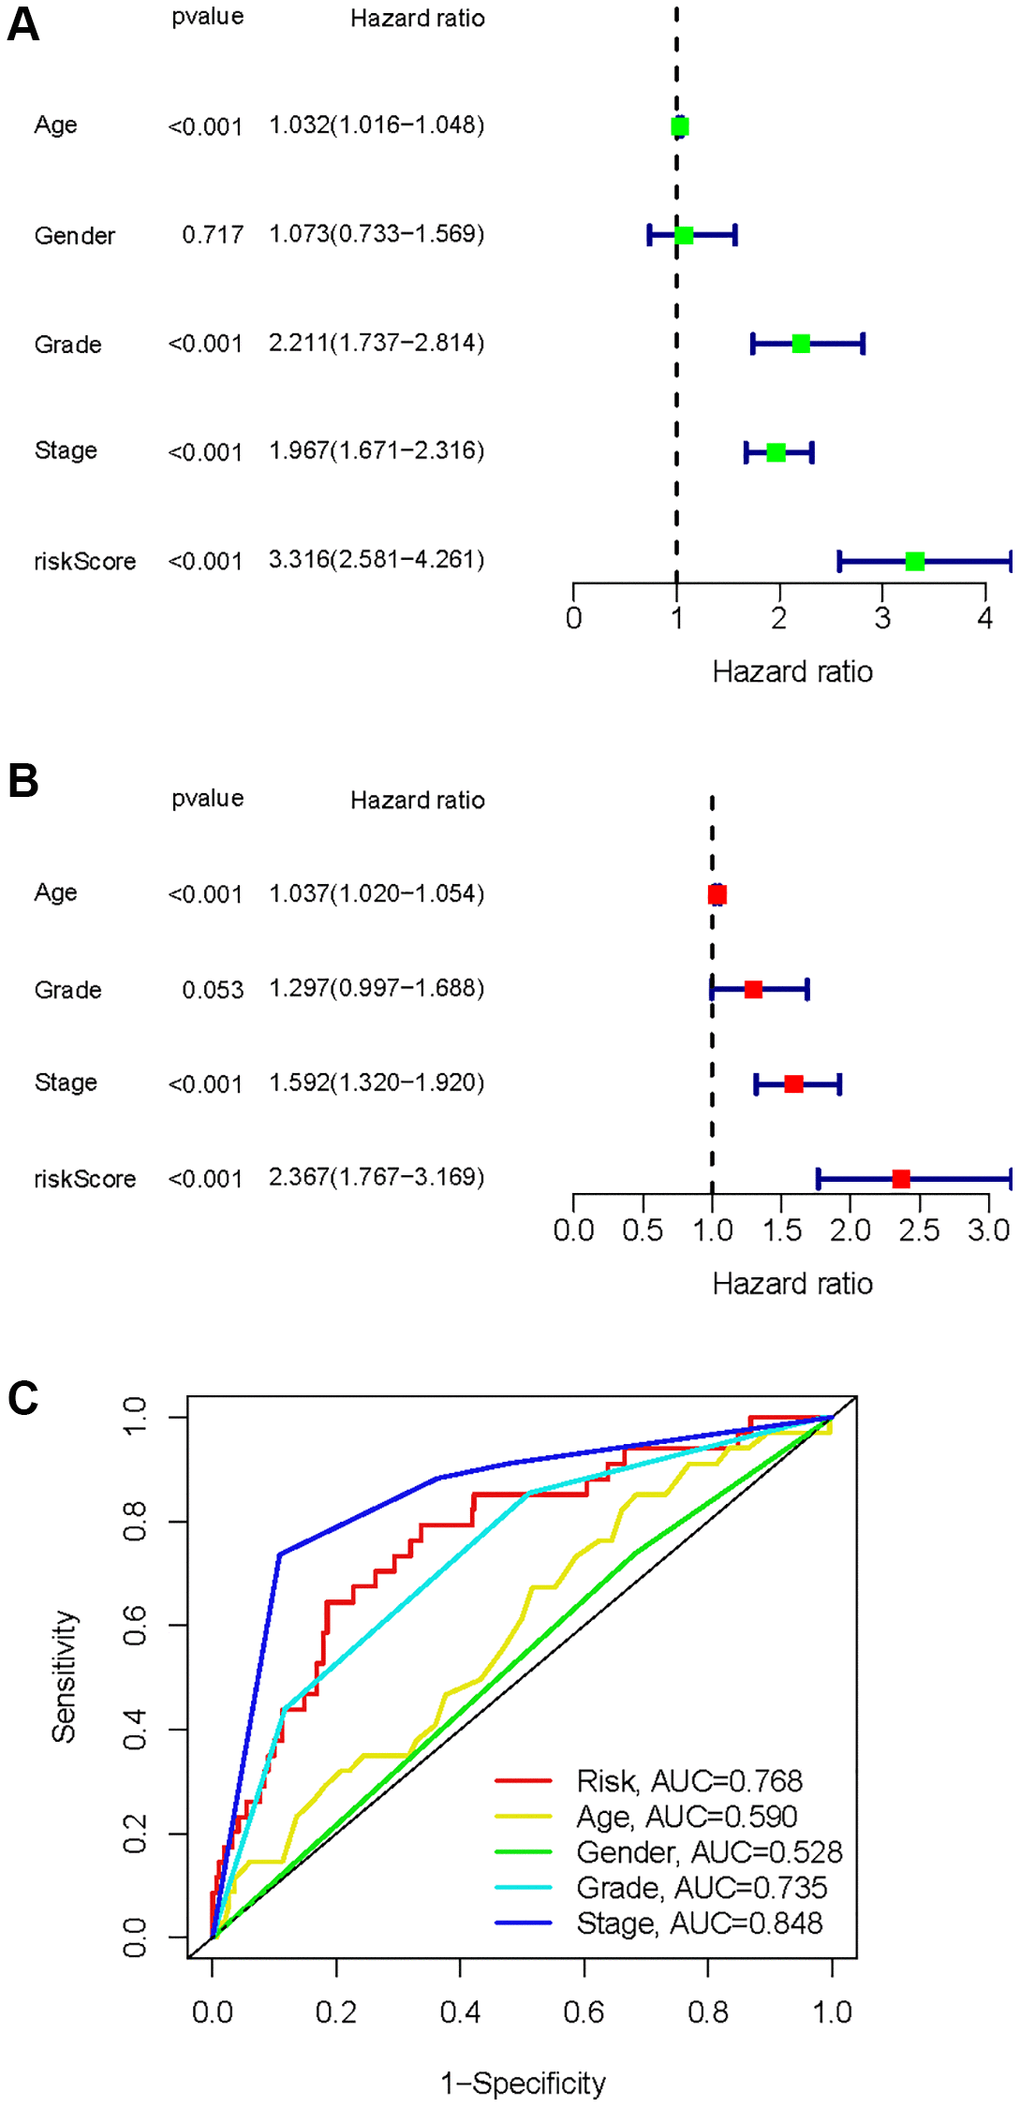
Figure 10. Identification of independent factors affecting the prognosis of the KIRC samples. (A) Univariate Cox regression analysis to identify factors associated with prognosis in the KIRC sample. (B) Multivariate Cox regression analysis to identify factors that can independently predict prognosis in the KIRC sample. (C) Multivariate ROC curves for risk and other clinical variables predicting prognosis in the KIRC samples.
As a result of the univariate and multivariate analyses, independent prognostic factors of the KIRC samples were incorporated into the prognostic model. By transforming complex regression equations into visual graphs, nomograms make the results of predictive models more understandable [23]. A nomogram predicting the probability of 3- and 5-year OS was plotted on the basis of this advantage (Figure 11A). The concordance index (C-index) = 0.754 reflected the decent accuracy of the nomogram in predicting the 3- and 5-year OS of KIRC. The calibration curves further showed the consistency between the nomogram-predicted OS probabilities for the KIRC samples and the actual OS for the KIRC samples at 3- and 5-year (Figure 11B, 11C).
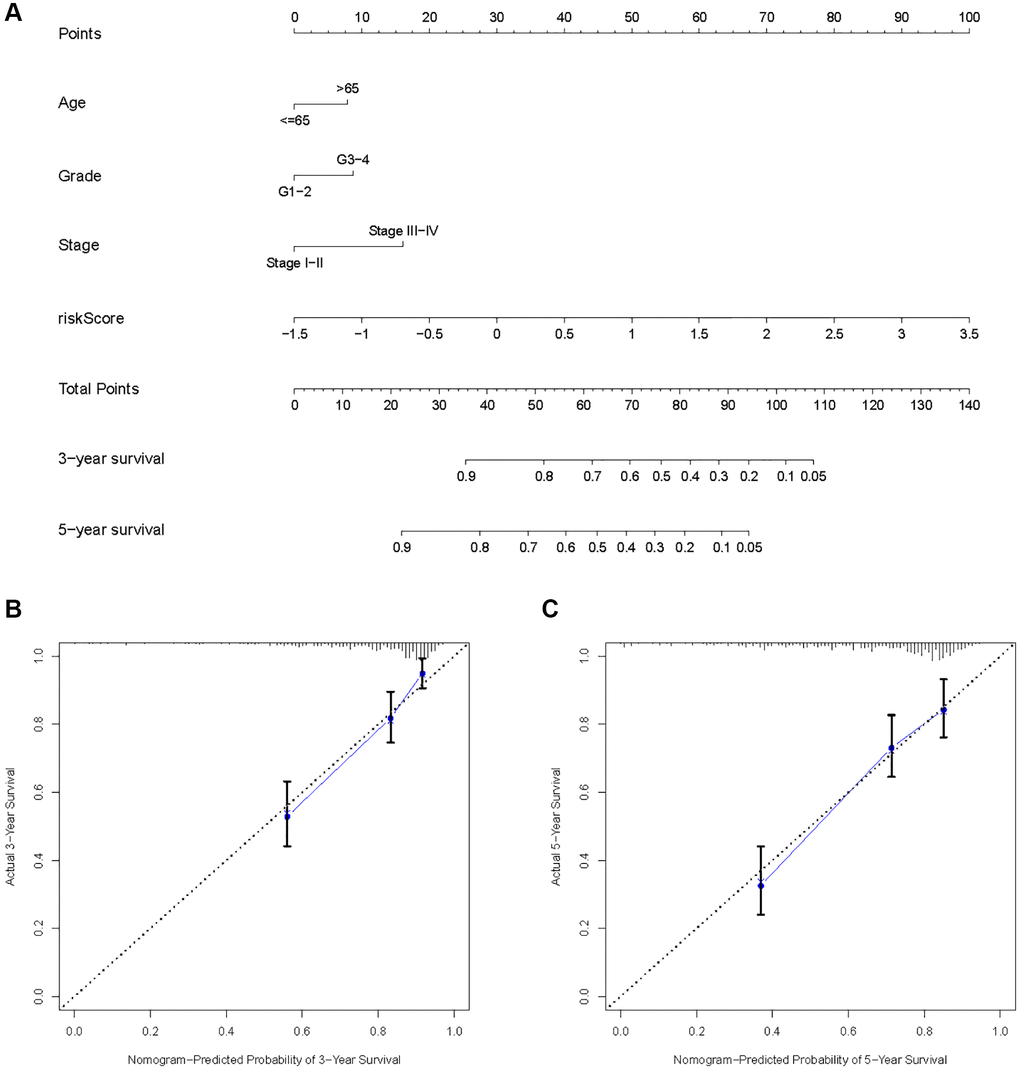
Figure 11. Construction of a risk score-based prognostic model for KIRC. (A) Construction of a risk score-based nomogram for predicting 3- and 5-year OS in KIRC samples. (B, C) Calibration curves to determine the performance of nomogram to predict 3- and 5-year OS in KIRC samples.
Immune characteristics
By searching the TIMER database, we found correlations between expression level of these 8 HMs (C17orf49, GLYATL1, HJURP, KAT2A, NCOA7, NEK6, PRDM16, TTK) and the infiltration level of six common immune cells (B Cell, CD8+ T Cell, CD4+ T Cell, Macrophage, Neutrophil and Dendritic Cell) (Figure 12). The expression of C17orf49 closely correlated with the infiltration of CD8+ T Cell (cor = 0.35, p = 4.32e−14), CD4+ T Cell (cor = 0.295, p = 1.15e−10), Neutrophil (cor = 0.16, p = 5.76e−04), and Dendritic Cell (cor = 0.289, p = 3.34e−10). The expression of GLYATL1 significantly correlated with the infiltration of B Cell (cor = 0.161, p = 5.29e−04) and CD8+ T Cell (cor = 0.152, p = 1.44e−03) only. HJURP showed a close association with immune infiltration, and its expression level significantly correlated with B Cells (cor = 0.261, p = 1.32e−08), CD8+ T Cell (cor = 0.187, p = 8.21e−05), CD4+ T Cell (cor = 0.19, p = 4.27e−05), Macrophage (cor = 0.146, p = 1.88e−03), Neutrophil (cor = 0.281, p = 9.02e−10) and Dendritic Cell (cor = 0.347, p = 2.40e−14). The expression level of KAT2A had significantly negative correlation with the infiltration level of B cells (cor = −0.153, p = 1.01e−03), however, it had significantly positive correlation with the infiltration level of CD4+ T cells (cor = 0.323, p = 1.18e−12) and Neutrophil (cor = 0.129, p = 5.53e−03). The expression of NCOA7 closely correlated with infiltration of CD8+ T Cell (cor = 0.202, p = 1.99e−05), CD4+ T Cell (cor = 0.247, p = 7.79e−08), Macrophage (cor = 0.214, p = 5.02e−06), Neutrophil (cor = 0.245, p = 1.11e−07) and Dendritic Cell (cor = 0.117, p = 1.22e−02). Both NEK6 and TTK show a close correlation with immune cell infiltration. The expression of NEK6 and TTK closely and positively correlated with the infiltration of these six immune cells (B Cells, CD8+ T Cell, CD4+ T Cell, Macrophage, Neutrophil and Dendritic Cell) (p < 0.01). The expression of PRDM16 had significantly negative correlation with the infiltration of B cells (cor = 0.13, p = 5.33e−03), but significantly positive correlation with the infiltration of CD8+ T Cell (cor = 0.1, p = 3.72e−02), CD4+ T Cell (cor = 0.311, p = 8.90e−12) and Macrophage (cor = 0.135, p = 4.21e−03). We further investigated the correlation between the expression of these 8 HMs and the level of MSI and TMB. The results showed that the expression of C17orf49 significantly correlated with the level of TMB (r = 0.11, p = 0.041). The expression of HJURP significantly correlated with the level of MSI (r = 0.15, p = 0.005) and TMB (r = 0.24, p = 1.49e−05). KAT2A likewise showed a close association with MSI (r = 0.17, p = 0.002) and TMB (r = 0.16, p = 0.003). The expression level of PRDM16 negatively correlated with the level of TMB (r = −0.12, p = 0.032). The expression level of TTK showed a meaningful correlation with the level of both MSI (r = 0.17, p = 0.002) and TMB (r = 0.20, p = 2.39e−04) (Figure 13).
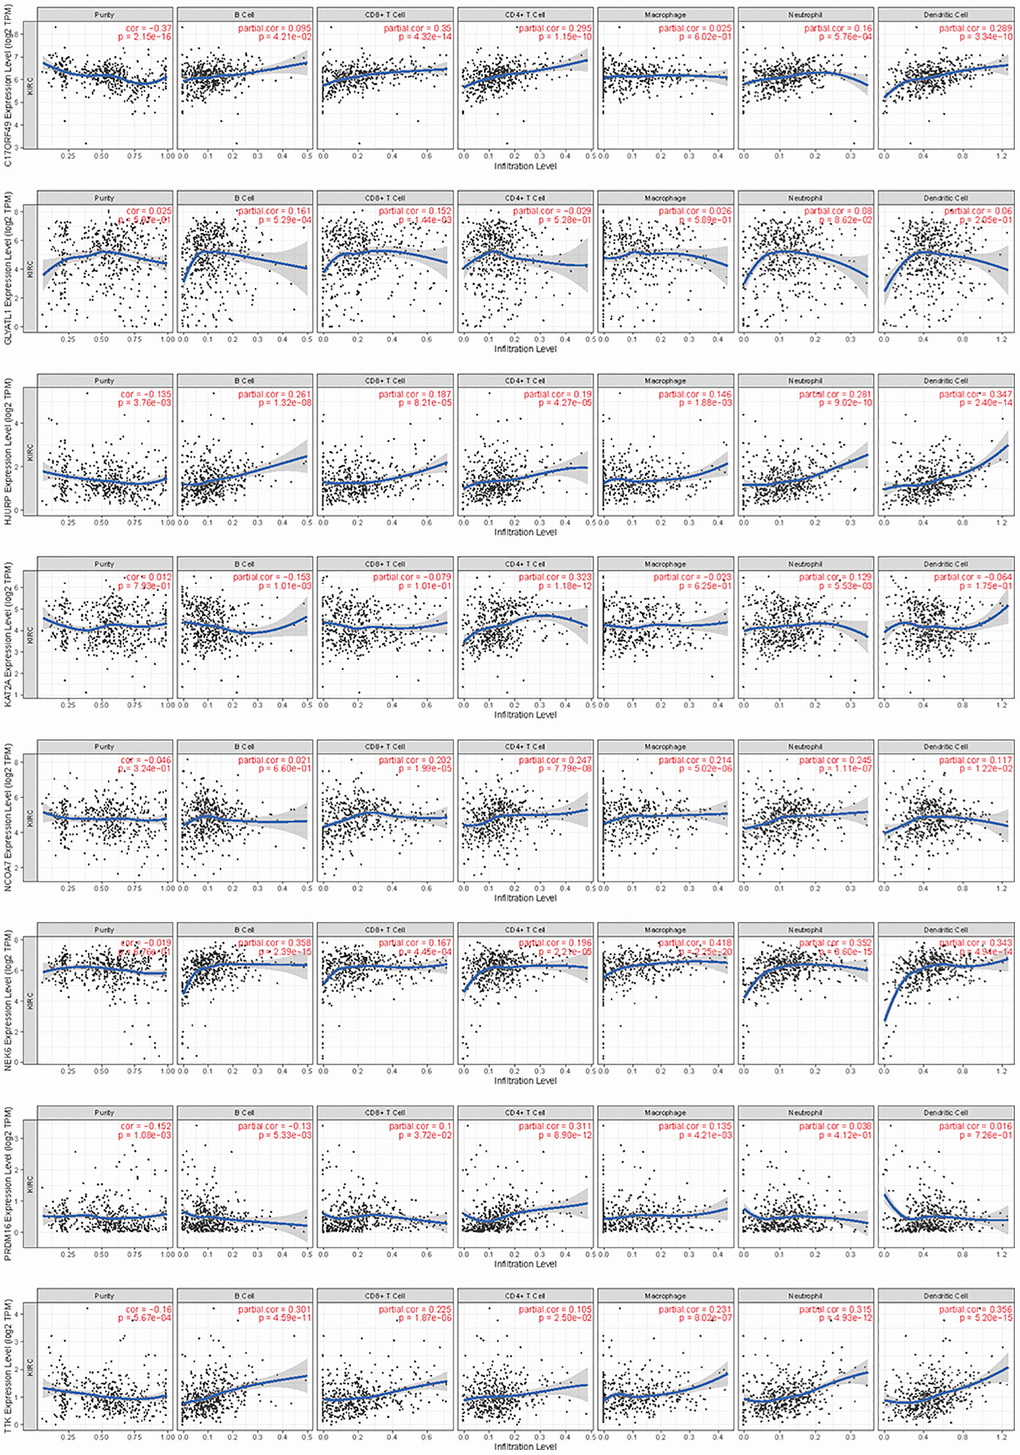
Figure 12. Correlation analysis of the expression of HMs with immune cell infiltration in TIMER database.
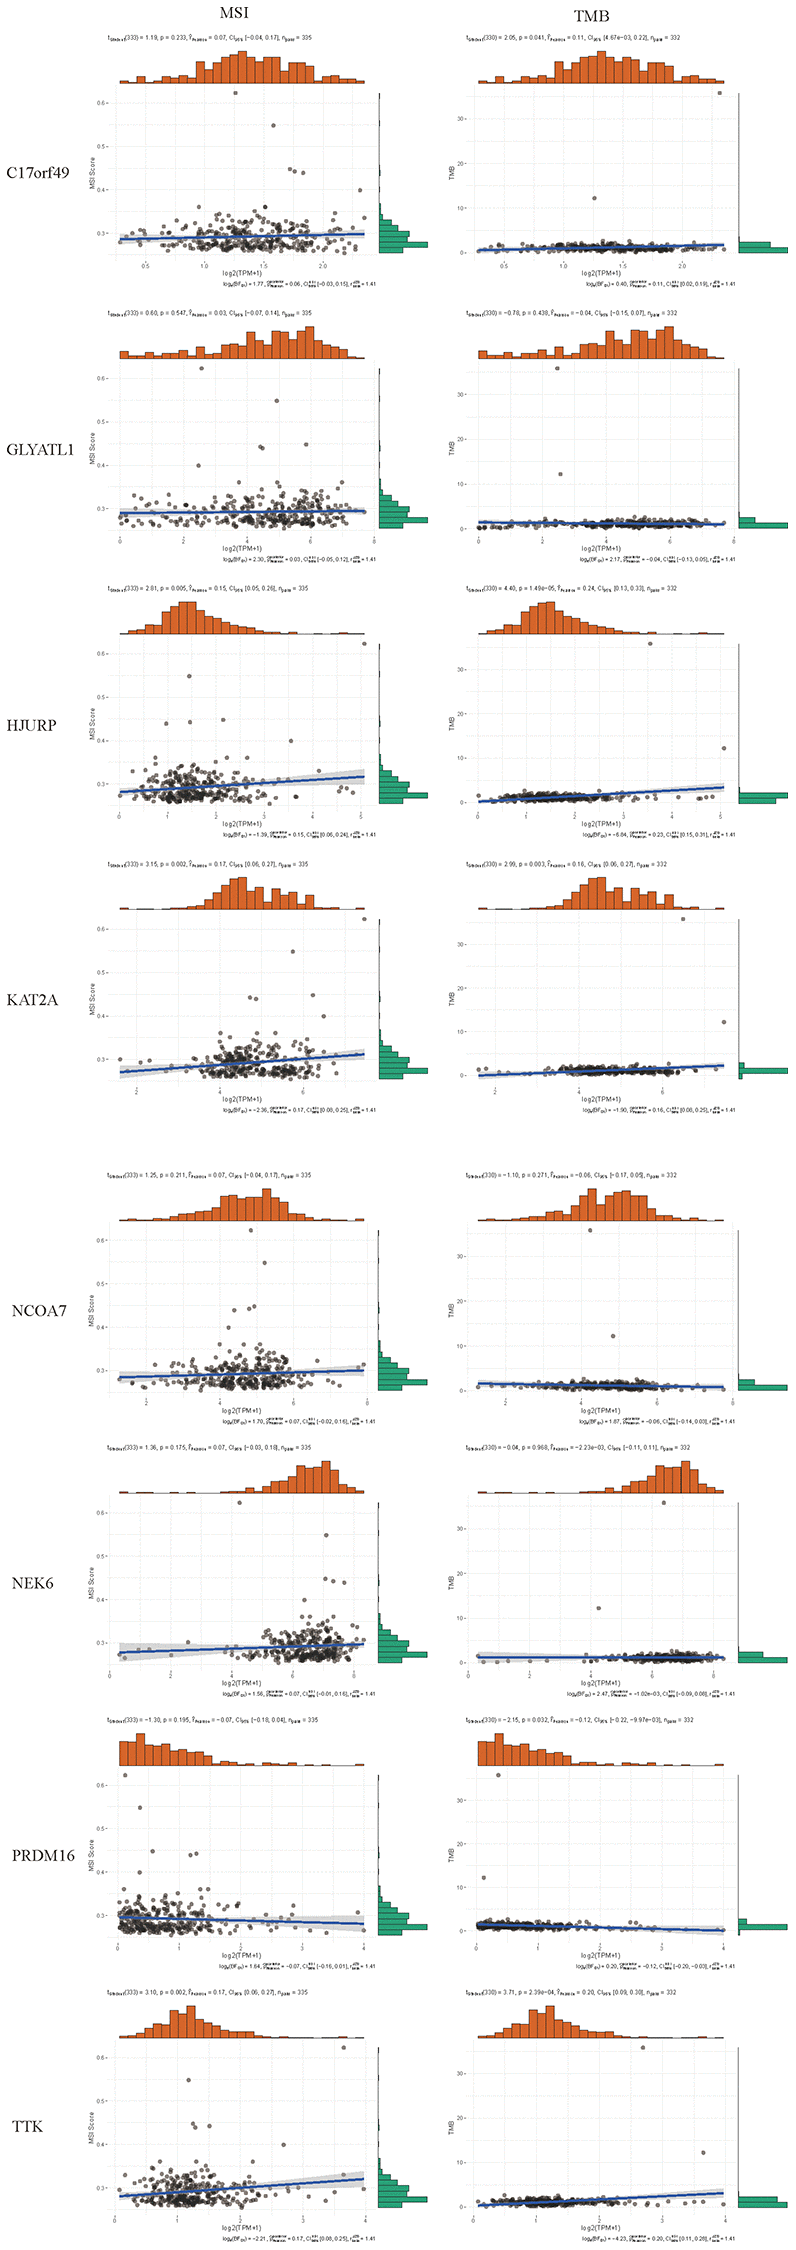
Figure 13. Correlation analysis of the expression of HMs with the level of MSI and TMB.
Based on the evidence that these HMs were associated with immunity, we analyzed the correlation between HMs-based signature and immune characteristics. Analysis of differences in the TME between high- and low-risk groups showed that the level of immune cell infiltration in the TME was significantly higher in the high-risk group than in the low-risk group (p = 1.1e−05) (Figure 14A–14C). We further analyzed the differences in the expression of immune checkpoints in KIRC samples between high- and low-risk groups, and result showed that the level of expression of IDO2, ICOS, PDCD1, CD70, LAIR1, CD28, CD40, TNFRSF4, CD160, ADORA2A, TNFSF9, LAG3, BTLA, CD48, CD44, CD40LG, TIGIT, TNFSF4, TMIGD2, TNFRSF14, TNFSF14, LGALS9, TNFRSF9, CD86, CD244 and TNFRSF25 were significantly higher in the high-risk group than in the low-risk group (Figure 14D). In addition, a significant finding was that the TIDE scores of KIRC samples in the high-risk group were significantly higher than those of samples in the low-risk group (Figure 14E), revealing that KIRC in the high-risk group was more prone to immune escape.
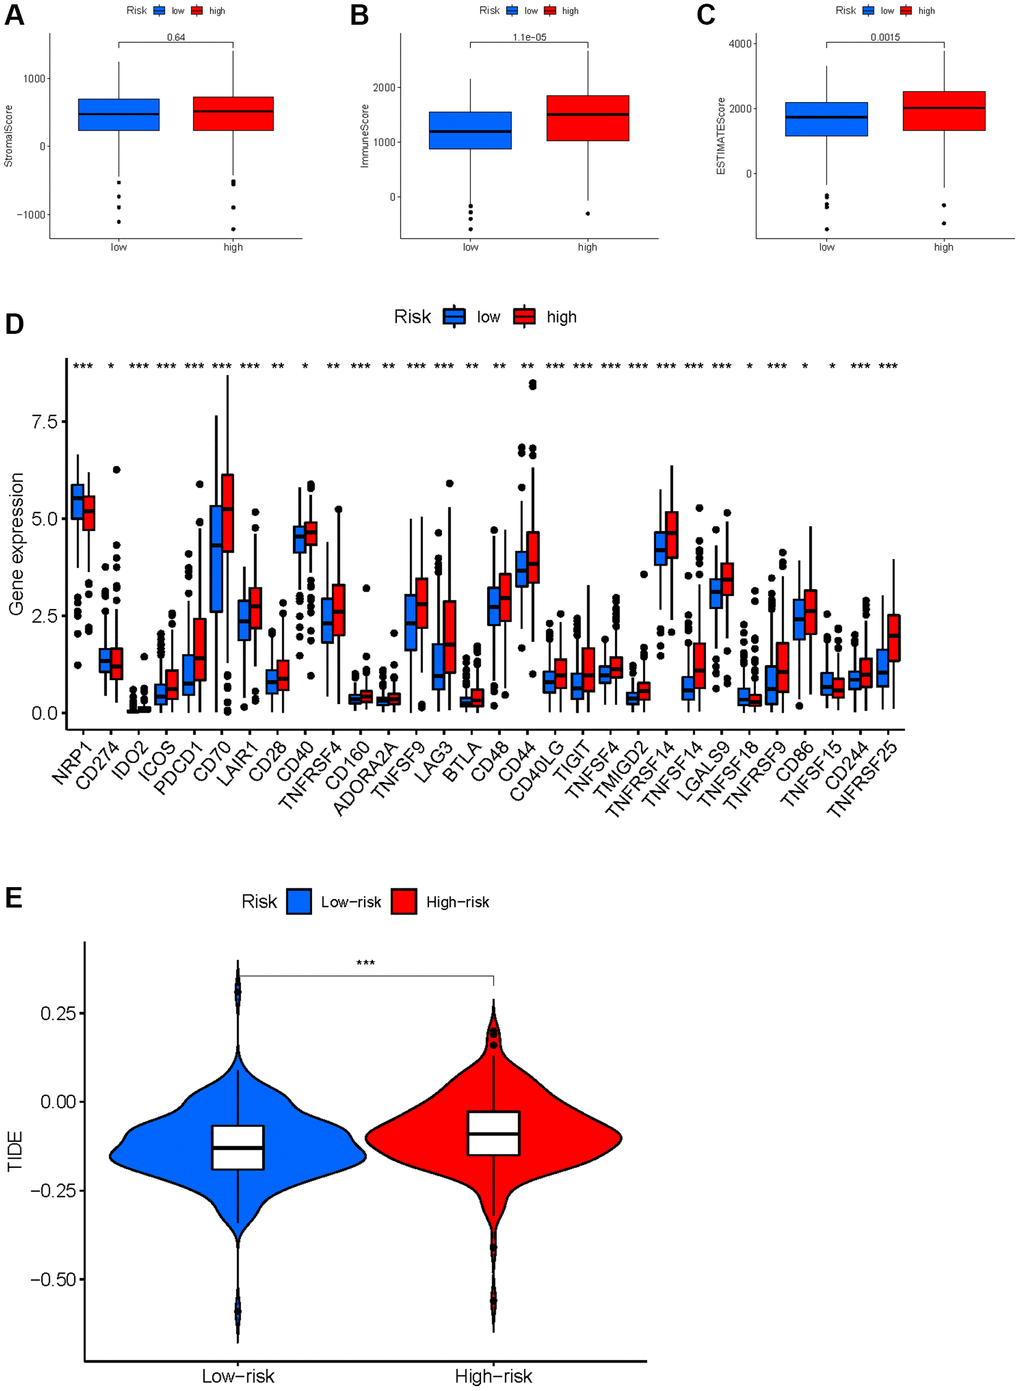
Figure 14. Correlation between HMs-based signature and immune characteristics. (A–C) Analysis of the tumour microenvironment between high- and low-risk groups by ESTIMATE algorithm. (D) Analysis of differences in immune checkpoint expression between high- and low-risk groups. (E) Analysis of differences in TIDE scores between high- and low-risk groups.
Drug sensitivity analysis
To improve chemotherapy outcomes in KIRC patients, it is important to understand KIRC’s sensitivity to chemotherapy. Analyses of chemotherapy drug sensitivity in KIRC samples with high or low risk showed that KIRC samples with high risk had lower IC50 values for Sunitinib, Tipifarnib, Nilotinib, Bosutinib, Mitomycin. C, Vinblastine, Camptothecin, Docetaxel and Doxorubicin compared with KIRC samples with low risk (Figure 15), implying that KIRC samples with high risk were more sensitive to these nine chemotherapy drugs. In contrast to the high-risk group, the low-risk group had significantly lower IC50 values for Pazopanib, Bexarotene, and Thapsigargin in KIRC, implying that KIRC samples with low risk were more sensitive to these three chemotherapeutic drugs.
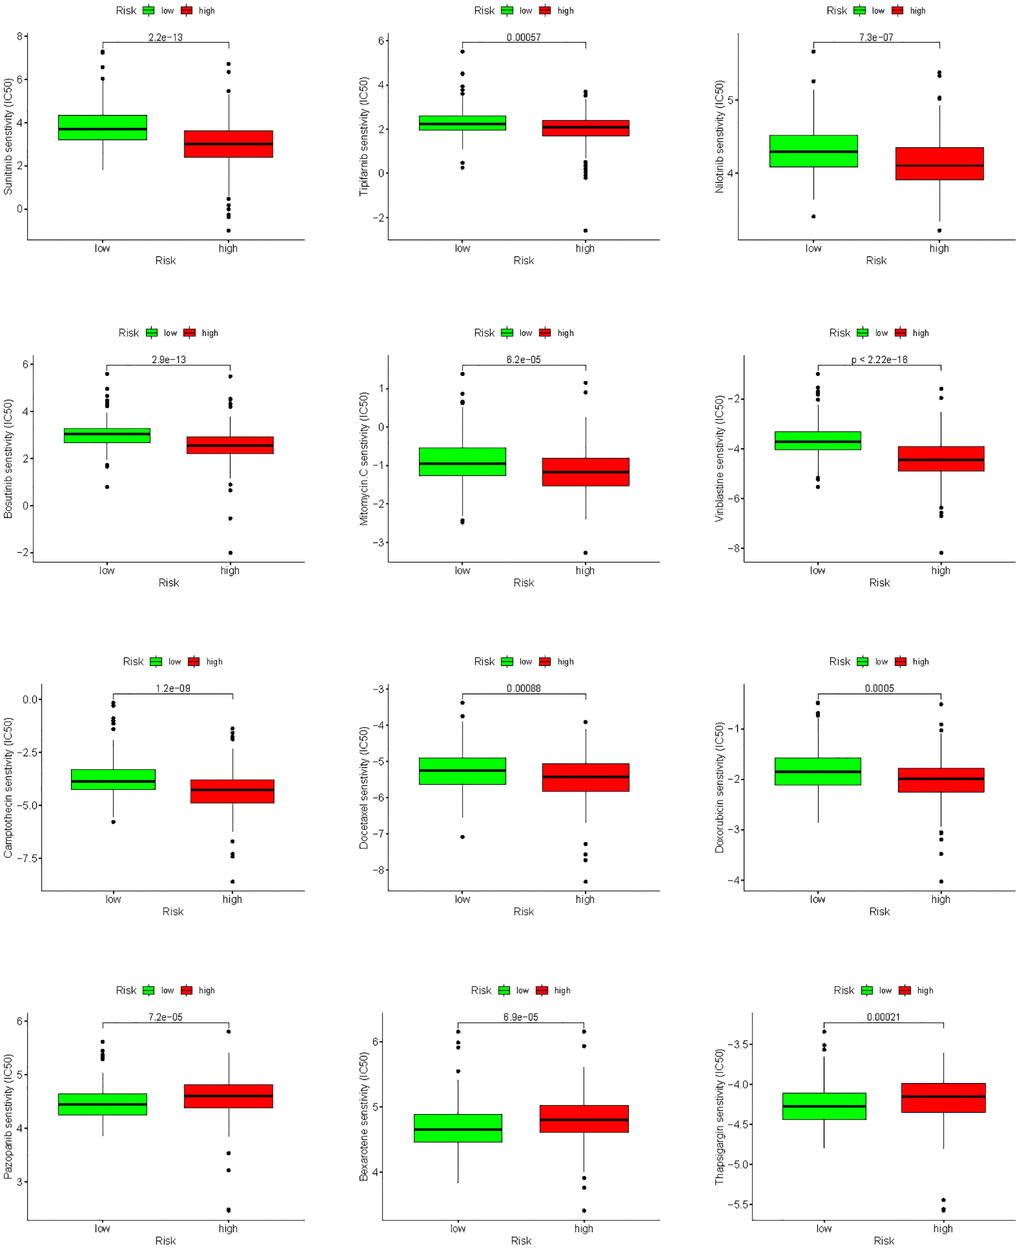
Figure 15. Analysis of differences in sensitivity to chemotherapy drugs between high- and low-risk groups.