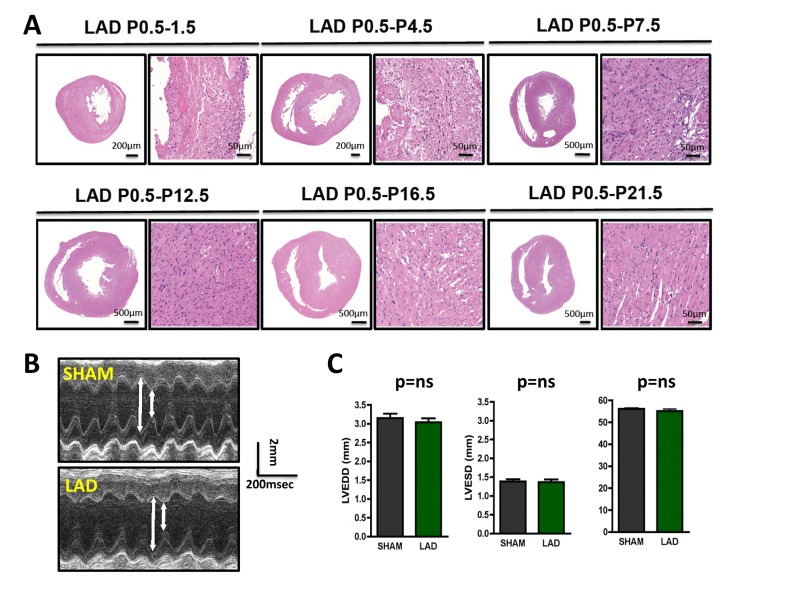
Figure 2.Time-course of cardiac regeneration(A) Time-course of regeneration. Whole hearts and magnifications at the infarction areas are shown on day P1.5, P4.5, P7.5, P12.5, P16.5, and P21.5 following LAD ligation of newborn mouse hearts at P0.5. Images are representative of 4 mice analyzed. Note the complete regeneration of the infarction zone starting ~ day P7.5. (B-C) Cardiac echocardiography of 3 months old mice that where either sham-operated on P0.5 or received LAD ligation on P0.5. Representative M-mode echocardiograms are shown in (B). Arrows show LVESD and LVEDD. Data in (C) show mean values +/− SEM of LVEDD, LVESD, and Fractional shortening (n = 4 per group). ns, not significant (Mann-Whitney U Test).