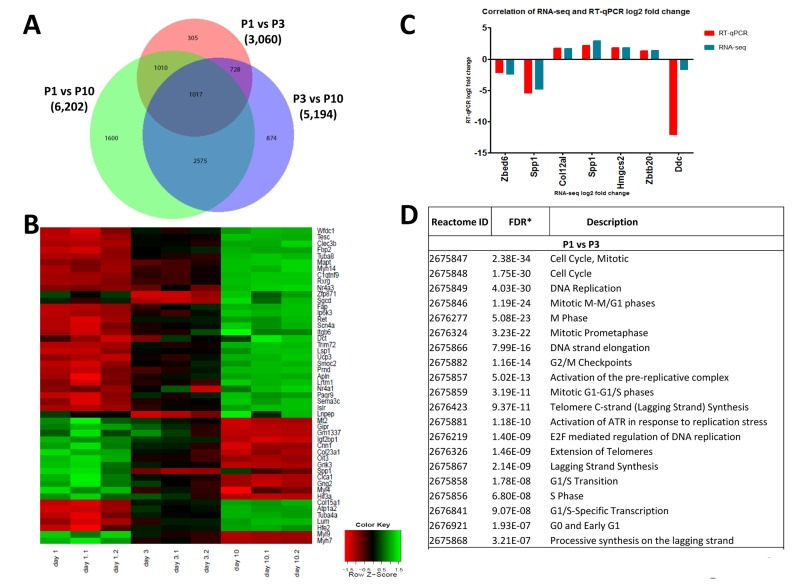
Figure 6.Differentially expressed genes in the left ventricle of postpartum P1, P3, and P10 mice(A) Venn diagram of differentially expressed genes in the left ventricle of non-manipulated P1, P3 and P10 mice. Numbers of genes differentially expressed comparing P1 vs P3, P1 vs P10, and P3 vs P10 are indicated. (B) Heat map showing the progression of the 50 most differentially expressed genes in individual mice between P1, P3 and P10. Most transcripts progress in a linear, or approximately linear, fashion from P1 to P3 and P10 are shown. However, a small set of genes robustly shows an expression increase from P1 to P3 and then a decrease from P3 to P10, whereas another small gene set shows a decrease and then an increase. (C) Validation of RNA-seq results using qRT-PCR. Data indicate a strong correlation between RNAseq data and qPCR expression analyses for the majority of the validated genes accept Ddc, which could be caused by a poor reproducibility of this gene assay. (D) Reactome analysis of differentially expressed genes between P1, P3 and P10 mice showing that the most differentially expressed gene between these stages of the development belong to mitosis and cell cycle categories.