Submit an Article
Navigate
Home
Editorial Board
Editorial Policies
Current Volume
Archive
Scientific Integrity
Publication Ethics Statements
Interviews with Outstanding Authors
Newsroom
Sponsored Conferences
Podcast
Contact
Special Collections
Submit an Article
Online ISSN: 1945-4589
Research Paper
|
Volume 6, Issue 3
|
pp. 176–186
Metabolic profiles of biological aging in American Indians: The strong heart family study
Back to article
Figure 1
(1 of 2)
−
100%
+
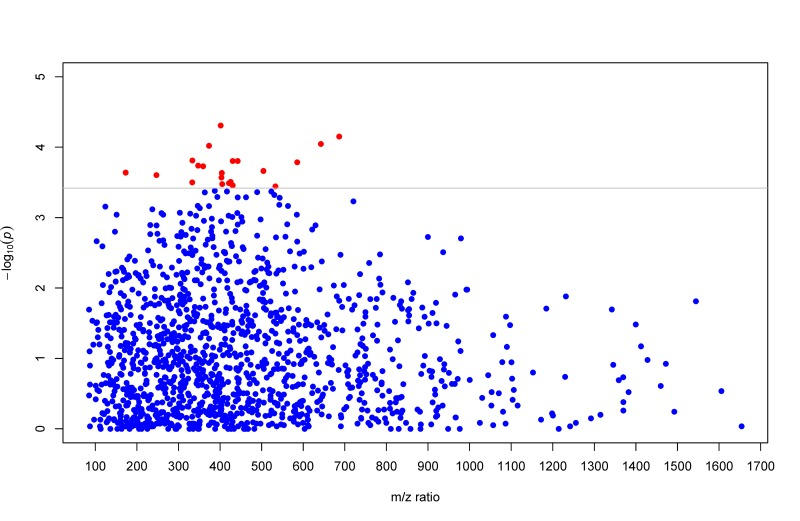
Figure 1.
Manhattan plot (−log
10
p
vs metabolic feature) showing metabolites using raw
p
values obtained from multivariate GEE regression. Metabolites significantly associated with LTL are highlighted in red dots at the q-value level of 0.05.