


Introduction
Aging and age-related metabolic disorders, such as obesity, diabetes, and cardiovascular disease (CVD), pose great social and economic burdens worldwide. The aging process is characterized by progressive metabolic decline over time, such as metabolic rate decline [1], reduced insulin secretion and β-cell dysfunction [2, 3], as well as glutathione metabolism [4]. Biological pathways known to be involved in aging are also implicated in metabolism. Therefore, profound metabolic abnormality represents a hallmark of aging [5]. With the current increase in life expectancy and the heavy burden of age-related disorders, there is an urgent need to elucidate metabolic pathways associated with aging and to develop novel metabolic markers and therapeutic targets for early aging and age-related disorders.
Telomeres are repetitive DNA sequences and associated proteins at the end of each chromosome. They are critical in maintaining chromosomal stability and normal aging [6]. Telomere length shortens progressively during each round of cell cycle and declines significantly with age, thus has been emerging as a valuable marker for biological aging and age-related disorders. Progressive metabolic deterioration and telomere-induced biological aging have been shown to be two intimately linked biological processes [7]. On one hand, telomere dysfunction impairs metabolic function [8], and telomerase reactivation reverses tissue degeneration in aged telomerase-deficient mice [9]. On the other hand, metabolic signatures associated with natural aging accurately predicts biological aging provoked by accelerated telomere shortening, and a derived metabolomic score reliably predicts the age of wild-type mice [10]. Moreover, treatment with telomerase reverse transcriptase (TERT) reverses some of the metabolic changes associated with aging [11], further substantiating the association between telomeric aging and metabolic dysfunction. Shortened telomere length has been associated with a variety of metabolic disorders, such as obesity [12], diabetes [13], insulin resistance [14], impaired glucose tolerance [15], atherosclerosis [13, 16], dyslipidemia [17], and hypertension [18]. In a recent study, we reported that leukocyte telomere length at baseline significantly and independently predicts incident diabetes in American Indians [19], lending further support for a strong relationship between biological aging driven by telomere shortening and metabolic dysregulation.
Metabolomics is an emerging high-throughput analytical technology that can measure numerous endogenous and exogenous metabolites in biofluids (e.g., plasma, serum, urine). Because small metabolites are intermediates and end products of all regulatory pathways, metabolic alterations represent the most proximal reporters of alterations in our body in response to intrinsic and extrinsic perturbations, and thus may capture the complex physiological or pathological changes that accompany the aging process [20]. In previous metabolomics studies, changes in serum or plasma metabolites have been associated with chronological age or aging in animal and human studies. For example, several groups reported decreased serum carnitines, acylcarnitines and amino acids with chronological age and increased free fatty acid levels in aging rodents [21]. In human studies, serum carnitine [22], glycerophosphocholines and sphingomyelins increased with chronological age [23]. These investigations demonstrated that metabolic profiles are age-dependent, and metabolomic approaches can be used to capture the metabolic signatures of aging process. However, existing studies focused on metabolic changes related to chronological age, which could be very different from that of biological aging driven by telomere shortening. The goal of this study is to identify metabolic profiles of telomeric aging independent of chronological age and other aging-related factors in American Indians, a minority group suffering from disproportionately higher rates of age-related metabolic disorders, especially type 2 diabetes.
Results
Table 1 presents the characteristics of study participants according to LTL tertiles. Compared to participants with longer LTL, those with shorter LTL were significantly older, and had significantly higher levels of BMI, waist circumference, LDL-c and total cholesterol as well as eGFR. No significant difference was observed for other listed variables across LTL tertiles.
Table 1.
Characteristics of the SHFS study participants according to LTL tertiles (n=423)
| T/S ratio | Tertile 1 (n=139 ) | Tertile 2 (n=144 ) | Tertile 3 (n=140 ) | P trend* | |||||||||||||||||||||||||||||||||||||||||||||||||||||||||||||||||||||||||||||||||||||||||||||||
|---|---|---|---|---|---|---|---|---|---|---|---|---|---|---|---|---|---|---|---|---|---|---|---|---|---|---|---|---|---|---|---|---|---|---|---|---|---|---|---|---|---|---|---|---|---|---|---|---|---|---|---|---|---|---|---|---|---|---|---|---|---|---|---|---|---|---|---|---|---|---|---|---|---|---|---|---|---|---|---|---|---|---|---|---|---|---|---|---|---|---|---|---|---|---|---|---|---|---|---|
| Mean | 0.7549±0.1281 | 0.9960±0.0511 | 1.2584±0.1783 | ||||||||||||||||||||||||||||||||||||||||||||||||||||||||||||||||||||||||||||||||||||||||||||||||
| Median | 0.7865 | 0.9988 | 1.2121 | ||||||||||||||||||||||||||||||||||||||||||||||||||||||||||||||||||||||||||||||||||||||||||||||||
| Interquartile range | 0.6684-0.8565 | 0.9521-1.0411 | 1.1339-1.3171 | ||||||||||||||||||||||||||||||||||||||||||||||||||||||||||||||||||||||||||||||||||||||||||||||||
| Age (years) | 39.50±14.33 | 33.87±12.24 | 28.37±11.16 | <0.0001 | |||||||||||||||||||||||||||||||||||||||||||||||||||||||||||||||||||||||||||||||||||||||||||||||
| Female (%) | 65.47 | 68.06 | 61.43 | 0.4787 | |||||||||||||||||||||||||||||||||||||||||||||||||||||||||||||||||||||||||||||||||||||||||||||||
| BMI (kg/m2) | 34.08±7.72 | 32.56±8.36 | 32.01±9.08 | 0.0488 | |||||||||||||||||||||||||||||||||||||||||||||||||||||||||||||||||||||||||||||||||||||||||||||||
| WC (cm) | 107.46±17.83 | 103.58±19.12 | 101.44±20.08 | 0.0081 | |||||||||||||||||||||||||||||||||||||||||||||||||||||||||||||||||||||||||||||||||||||||||||||||
| Current smoker (%) | 30.93 | 40.97 | 35.71 | 0.1891 | |||||||||||||||||||||||||||||||||||||||||||||||||||||||||||||||||||||||||||||||||||||||||||||||
| Current drinker (%) | 68.35 | 65.97 | 67.14 | 0.5926 | |||||||||||||||||||||||||||||||||||||||||||||||||||||||||||||||||||||||||||||||||||||||||||||||
| SBP (mmHg) | 119.65±13.67 | 120.18±13.93 | 118.46±13.92 | 0.4777 | |||||||||||||||||||||||||||||||||||||||||||||||||||||||||||||||||||||||||||||||||||||||||||||||
| DBP (mmHg) | 76.06±9.40 | 76.47±11.15 | 75.75±12.19 | 0.8109 | |||||||||||||||||||||||||||||||||||||||||||||||||||||||||||||||||||||||||||||||||||||||||||||||
| HDL (mg/dL) | 51.19±14.32 | 50.74±15.36 | 50.46±14.57 | 0.6785 | |||||||||||||||||||||||||||||||||||||||||||||||||||||||||||||||||||||||||||||||||||||||||||||||
| LDL (mg/dL) | 101.41±30.90 | 98.12±28.13 | 93.37±27.48 | 0.0210 | |||||||||||||||||||||||||||||||||||||||||||||||||||||||||||||||||||||||||||||||||||||||||||||||
| Total triglyceride (mg/dL) | 143.67±74.09 | 149.11±92.95 | 136.51±68.94 | 0.4131 | |||||||||||||||||||||||||||||||||||||||||||||||||||||||||||||||||||||||||||||||||||||||||||||||
| Total cholesterol (mg/dL) | 180.69±35.55 | 178.18±33.31 | 170.77±32.14 | 0.0146 | |||||||||||||||||||||||||||||||||||||||||||||||||||||||||||||||||||||||||||||||||||||||||||||||
| Fasting glucose (mg/dL) | 91.62±7.15 | 90.69±7.56 | 90.72±6.93 | 0.2702 | |||||||||||||||||||||||||||||||||||||||||||||||||||||||||||||||||||||||||||||||||||||||||||||||
| Fasting insulin (uU/mL) | 15.82±9.95 | 15.93±12.43 | 16.89±14.47 | 0.4734 | |||||||||||||||||||||||||||||||||||||||||||||||||||||||||||||||||||||||||||||||||||||||||||||||
| HOMA-IR | 3.64±2.46 | 3.63±2.93 | 3.78±3.18 | 0.6999 | |||||||||||||||||||||||||||||||||||||||||||||||||||||||||||||||||||||||||||||||||||||||||||||||
| eGFR | 101.44±25.17 | 103.72±22.94 | 110.39±22.31 | 0.0037 | |||||||||||||||||||||||||||||||||||||||||||||||||||||||||||||||||||||||||||||||||||||||||||||||
| Dietary protein (g/d) | 93.01±80.35 | 93.54±78.54 | 98.44±85.36 | 0.5130 | |||||||||||||||||||||||||||||||||||||||||||||||||||||||||||||||||||||||||||||||||||||||||||||||
| Dietary fat (g/d) | 123.71±97.54 | 120.09±92.38 | 127.28±103.00 | 0.7297 | |||||||||||||||||||||||||||||||||||||||||||||||||||||||||||||||||||||||||||||||||||||||||||||||
| Caloric intake (Kcal/d) | 2778.99±2046.01 | 2729.79±2052.15 | 2942.66±2154.84 | 0.4704 | |||||||||||||||||||||||||||||||||||||||||||||||||||||||||||||||||||||||||||||||||||||||||||||||
| P values were estimated by GEE to account for family relatedness | |||||||||||||||||||||||||||||||||||||||||||||||||||||||||||||||||||||||||||||||||||||||||||||||||||
A total of 1,364 distinct m/z features matching known metabolites in the current metabolomics databases was included in the present analysis. Of these, altered levels of 19 matching metabolites were significantly associated with LTL after accounting for potential confounders (including chronological age) and multiple testing (at the q-value <0.05 level). Specially, higher levels of 13 metabolites in the species of glycerol-phosphoethanolamines (PEs), glycerophospho-choline (PC), bile acids, fatty amides, L-carnitine ester, peptide, and toluene were significantly associated with longer LTL, whereas higher levels of glycerolipids, glycerophosphoglycerol, isoprenoids, and steroids were significantly associated with shorter LTL. We also estimated the joint effects of risk or protective metabolites on LTL variation using multi-marker metabolites scores comprising of all risk or protective metabolites, respectively. On average, per 10% increase in the multi-marker score comprising of all six risk metabolites was associated with 0.94% shorter in LTL (T/S ratio). By contrast, per 10% increase in the multi-marker score of all thirteen protective metabolites was associated with 0.79% longer in LTL (T/S ratio). Multivariate associations of each individual metabolite and their combined effects with LTL are shown in Table 2. For ease of visual inspection, Figure 1 shows a Manhattan plot (−log10p vs metabolic feature) of all metabolites using raw p values obtained from multivariate regression analysis. Metabolites significantly associated with LTL are shown at the level of q-value 0.05.
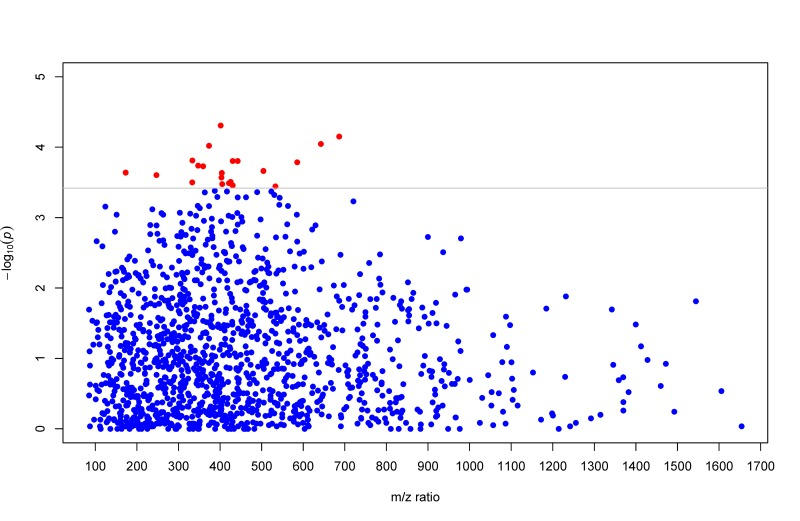
Figure 1. Manhattan plot (−log10p vs metabolic feature) showing metabolites using raw p values obtained from multivariate GEE regression. Metabolites significantly associated with LTL are highlighted in red dots at the q-value level of 0.05.
Table 2.
Association of the detected metabolites (q-value <0.05) with leukocyte telomere length by multivariate GEE*
| Matching metabolites | Class | m/z | Retention time | Effect size (95% CI)† | P-value | ||||||||||||||||||||||||||||||||||||||||||||||||||||||||||||||||||||||||||||||||||||||||||||||
|---|---|---|---|---|---|---|---|---|---|---|---|---|---|---|---|---|---|---|---|---|---|---|---|---|---|---|---|---|---|---|---|---|---|---|---|---|---|---|---|---|---|---|---|---|---|---|---|---|---|---|---|---|---|---|---|---|---|---|---|---|---|---|---|---|---|---|---|---|---|---|---|---|---|---|---|---|---|---|---|---|---|---|---|---|---|---|---|---|---|---|---|---|---|---|---|---|---|---|---|
| Protective matching metabolites | |||||||||||||||||||||||||||||||||||||||||||||||||||||||||||||||||||||||||||||||||||||||||||||||||||
| PE(O-18:0/13:0) | Glycerophosphoethanolamine | 686.501 | 439.45 | 0.48 ( 0.25, 0.71) | 9.26×10⁻⁵ | ||||||||||||||||||||||||||||||||||||||||||||||||||||||||||||||||||||||||||||||||||||||||||||||
| PE(P-16:0/12:0) | Glycerophosphoethanolamine | 642.452 | 435.46 | 0.51 ( 0.25, 0.77) | 4.92×10⁻⁴ | ||||||||||||||||||||||||||||||||||||||||||||||||||||||||||||||||||||||||||||||||||||||||||||||
| PC(O-8:0/O-8:0) | Glycerophosphocholine | 504.340 | 19.88 | 0.63 ( 0.39, 0.88) | 2.17×10⁻⁴ | ||||||||||||||||||||||||||||||||||||||||||||||||||||||||||||||||||||||||||||||||||||||||||||||
| Norchenodeoxycholic acid | Bile acids and derivatives | 401.263 | 297.93 | 0.41 ( 0.18, 0.63) | 2.71×10⁻⁴ | ||||||||||||||||||||||||||||||||||||||||||||||||||||||||||||||||||||||||||||||||||||||||||||||
| 5β-Chol-2-en-24-oic Acid | Bile acids and derivatives | 359.295 | 404.96 | 0.83 ( 0.49, 1.16) | 1.87×10⁻⁴ | ||||||||||||||||||||||||||||||||||||||||||||||||||||||||||||||||||||||||||||||||||||||||||||||
| 3α,6β,7α,12β-Tetrahydroxy-5β-cholan-24-oic Acid | Bile acids and derivatives | 425.288 | 28.14 | 0.58 ( 0.30, 0.85) | 3.10×10⁻⁴ | ||||||||||||||||||||||||||||||||||||||||||||||||||||||||||||||||||||||||||||||||||||||||||||||
| 5β-Cholestane-3α,7α,24-triol | Bile acids and derivatives | 421.365 | 508.16 | 0.65 ( 0.35, 0.94) | 3.23×10⁻⁴ | ||||||||||||||||||||||||||||||||||||||||||||||||||||||||||||||||||||||||||||||||||||||||||||||
| p-Cresol sulfate (PCS) | Toluenes | 173.029 | 20.11 | 0.56 ( 0.30, 0.82) | 1.45×10⁻⁴ | ||||||||||||||||||||||||||||||||||||||||||||||||||||||||||||||||||||||||||||||||||||||||||||||
| Dimethylallyl pyrophosphate | Isoprenoid | 247.011 | 42.92 | 0.61 ( 0.31, 0.92) | 2.48×10⁻⁴ | ||||||||||||||||||||||||||||||||||||||||||||||||||||||||||||||||||||||||||||||||||||||||||||||
| Leu-Ala-Val-Ala (LAVA) | Tetrapeptide | 373.243 | 320.09 | 0.28 ( 0.08, 0.48) | 3.19×10⁻⁴ | ||||||||||||||||||||||||||||||||||||||||||||||||||||||||||||||||||||||||||||||||||||||||||||||
| N-arachidonoyl histidine | Fatty amides | 442.309 | 345.69 | 0.68 ( 0.37, 0.98) | 1.57×10⁻⁴ | ||||||||||||||||||||||||||||||||||||||||||||||||||||||||||||||||||||||||||||||||||||||||||||||
| N-palmitoyl phenylalanine | Fatty amides | 404.318 | 518.86 | 0.72 ( 0.40, 1.05) | 2.32×10⁻⁴ | ||||||||||||||||||||||||||||||||||||||||||||||||||||||||||||||||||||||||||||||||||||||||||||||
| Hexadecanedioic acid mono-L-carnitine ester | Fatty Acid Esters | 430.314 | 575.80 | 0.64 ( 0.34, 0.95) | 3.47×10⁻⁴ | ||||||||||||||||||||||||||||||||||||||||||||||||||||||||||||||||||||||||||||||||||||||||||||||
| Combined protective effect | 0.79 ( 0.45, 1.13) | 6.54x10⁻⁵ | |||||||||||||||||||||||||||||||||||||||||||||||||||||||||||||||||||||||||||||||||||||||||||||||||
| Risk matching metabolites | |||||||||||||||||||||||||||||||||||||||||||||||||||||||||||||||||||||||||||||||||||||||||||||||||||
| MG(20:3) | Glycerolipid | 403.279 | 472.83 | −0.49 (−0.79,−0.19) | 2.87×10⁻⁴ | ||||||||||||||||||||||||||||||||||||||||||||||||||||||||||||||||||||||||||||||||||||||||||||||
| DG(18:2/14:1) | Glycerolipid | 585.443 | 556.01 | −0.33 (−0.54,−0.11) | 1.63×10⁻⁴ | ||||||||||||||||||||||||||||||||||||||||||||||||||||||||||||||||||||||||||||||||||||||||||||||
| PG(20:4) | Glycerophosphoglycerol | 533.289 | 401.75 | −0.62 (−0.90,−0.35) | 3.58×10⁻⁴ | ||||||||||||||||||||||||||||||||||||||||||||||||||||||||||||||||||||||||||||||||||||||||||||||
| (11Z)-8,18-ethanoretinal | Isoprenoid | 333.221 | 275.34 | −0.71 (−1.03,−0.39) | 1.54×10⁻⁴ | ||||||||||||||||||||||||||||||||||||||||||||||||||||||||||||||||||||||||||||||||||||||||||||||
| 5,6-epoxy-3-hydroxy-5,6-dihydro-12'-apo-β-caroten-12'-al | Isoprenoid | 405.243 | 21.45 | −0.80(−1.15, −0.45) | 3.32×10⁻⁴ | ||||||||||||||||||||||||||||||||||||||||||||||||||||||||||||||||||||||||||||||||||||||||||||||
| Corticosterone | Steroid | 347.220 | 77.58 | −0.54 (−0.76,−0.31) | 1.83×10⁻⁴ | ||||||||||||||||||||||||||||||||||||||||||||||||||||||||||||||||||||||||||||||||||||||||||||||
| Combined risk effect | −0.94 (−1.33,−0.54) | 9.57x10⁻⁵ | |||||||||||||||||||||||||||||||||||||||||||||||||||||||||||||||||||||||||||||||||||||||||||||||||
| Adjusted for age, sex, study center, waist circumference, LDL-c, total cholesterol and eGFR; | |||||||||||||||||||||||||||||||||||||||||||||||||||||||||||||||||||||||||||||||||||||||||||||||||||
| Percent change in LTL (T/S ratio) per 10% change in relative abundance of metabolites | |||||||||||||||||||||||||||||||||||||||||||||||||||||||||||||||||||||||||||||||||||||||||||||||||||
Using a multi-marker score comprising of all 19 significant metabolites, we performed sPLS-DA to examine whether these newly identified compounds can discriminate participants with different profiles of biological aging. Figure 2 clearly shows that participants with longer (top tertile) and shorter (bottom tertile) LTL were classified into two distinct groups, suggesting that these newly detected metabolites can be used as biomarkers for risk stratification. Sensitivity analyses showed that additional adjustments for lifestyle (smoking, alcohol drinking), and dietary intake of fat, protein as well as caloric intake did not change our results. Additional adjustment for batch effect in telomere assay also did not attenuate the observed associations.
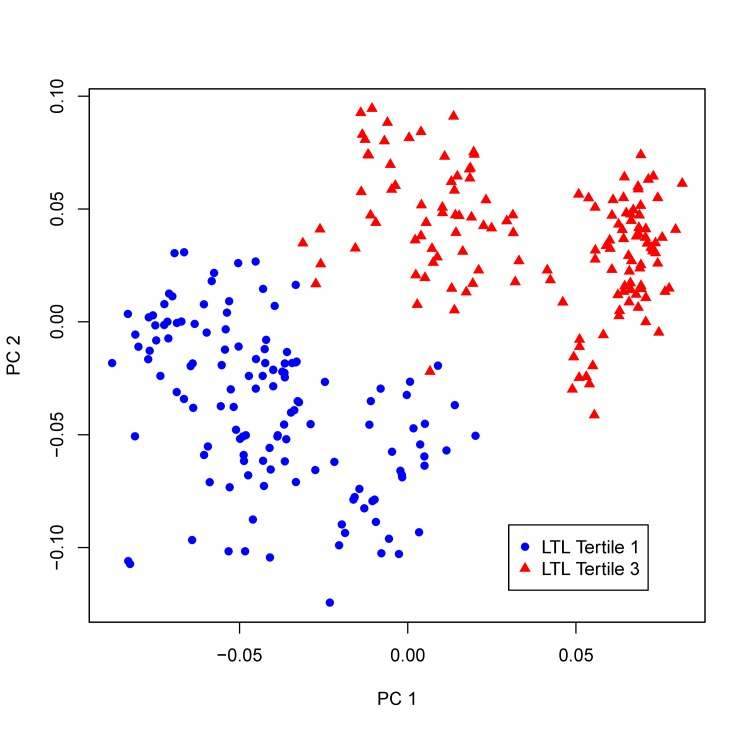
Figure 2. sPLS-DA plot. Participants whose LTL in the top tertile of LTL distribution and those in the bottom tertile are classified into two distinct groups using the multi-marker score comprising of all 19 metabolites significantly associated with LTL in the multivariate GEE model.
Discussion
Using an untargeted high resolution metabolomic approach, here we report significant association of altered metabolic profiles in fasting plasma with telomeric aging among apparently healthy American Indians in the Strong Heart Study. The observed associations were independent of chronological age and many other potential risk factors of aging, and withstood additionally adjustments for lifestyle and dietary factors, suggesting that these newly detected chemicals could be novel indicators of biological aging. As far as we are aware, this is the first study to interrogate the comprehensive metabolome of telomeric aging not only in American Indians but other ethnic groups as well. Findings of this study provide novel insights into telomere biology, and may also facilitate efforts to uncover potential therapeutic targets for anti-aging and aging-related metabolic disorders.
Glycerophosphatidylethanolamines (PEs) are ether-linked phospholipids required for normal developmental, physiological, and cognitive functions [37]. They are proposed to act as antioxidants and may also influence intracellular signaling and membrane dynamics. In the present study, we found that plasma levels of two metabolites matching PE (O-18:0/13:0) and PE (P-16:0/12:0), are positively associated with LTL, suggesting that they may protect against aging. This is in agreement with previous studies demonstrating that PE deficiency was associated with age-related disorders such as Alzheimer's disease [38]. The protective effect of these PEs on aging may be attributable to their antioxidant effects [39]. Glycerophosphocholine (GPC) has been shown to be beneficial on cognitive decline in aging, and choline alphoscerate (a cholinergic precursor) has been widely used in the treatment of neurodegenerative disorders such as Alzheimer's disease [40]. Consistently, we found that a metabolite matching PC (O-8:0/O-8:0), belonging to the class of GPC, was significantly protective on telomeric aging in our study population.
Bile acids, the oxidized derivatives of cholesterol produced in the liver, play an important role in regulating glucose, lipids, and energy metabolism. They are also steroid hormones activating specific nuclear receptors, and have been recognized as signaling molecules of metabolic homeostasis [41]. Previous studies demonstrated that bile acids extended lifespan in model organisms [42, 43], and that bile acid synthesis decreased with aging in human population [44]. Consistent with these observations, we found that higher plasma levels of four metabolites in the class of bile acids and derivatives (norchenodeoxycholic acid, 5β-chol-2-en-24-oic acid, 5β-cholestane-3α,7α,24-triol, and 3α,6β,7α,12β-tetrahydroxy-5β-cholan-24-oic acid) were significantly associated with longer LTL, lending further support for a potential beneficial effect of bile acids on aging. While the precise mechanisms through which bile acids influence aging are unknown, it is possible that they could act as endocrine regulators of aging via nuclear receptor signaling [43] or through influencing oxidative stress and genomic stability [42], all of which may be implicated in telomere maintenance and telomeric aging [45].
In this study, two compounds matching N-palmitoyl phenylalanine and N-arachidonoyl histidine are protective on telomeric aging. These two chemicals belong to fatty amides, which are increasingly recognized as an important new class of lipid signaling molecules. These endogenous signaling molecules have been reported to act as physiological regulators of pain and inflammation [46]. The observed protective effect of these two fatty amides on biological aging in our study could be attributed to their potential anti-inflammatory activities [47].
The p-Cresol sulfate (PCS) is organic solute produced by bacterial metabolism of the amino acids tyrosine in colon. The health effects of free p-Cresol and its conjugates have been inconsistent in previous studies [48, 49]. Here we found that increased level of plasma PCS was associated with longer LTL, suggesting a protective effect on biological aging. Because PCS is metabolized by bacteria in colon, the observed association of PCS with LTL may imply a possible role of gut microbiota in telomeric aging.
Monoacylglycerol (MG) and diacylglycerol (DG) are lipid intermediates believed to be the true lipotoxic culprits underlying the known detrimental effect of triacylglycerol (TG) on insulin resistance [50] and many age-related metabolic disorders, e.g., atherosclerosis and diabetes. In support of this, elevated levels of MG (20:3) and DG (18:2/14:1) were significantly associated with shorter LTL in our analysis. It is possible that these glycerolipids may function as second messengers that impair insulin [51] and/or transmembrane signaling, both of which are known to be involved in the process of aging [52].
The isoprenoid pathway is an important metabolic pathway for the production of dimethylallyl pyrophosphate (DMAPP) and isopentenyl pyrophosphate, which serve as the basis for the biosynthesis of molecules that are essential for a variety of processes such as cell membrane maintenance, hormones metabolism, protein anchoring, and steroid synthesis. The observed associations of telomeric aging with several matching isoprenoids (e.g., DMAPP, (11Z)-8,18-ethanoretinal, and 5,6-epoxy-3-hydroxy-5,6-dihydro-12'-apo-β-caroten-12'-al) in our study are consistent with a priori knowledge on the related isoprenoid pathways, though the precise mechanisms underlying these associations await further investigation.
In addition to the altered profiles of lipids, bile acids, and isoprenoids discussed above, altered levels of several metabolites matching corticosterone, mono-L-carnitine ester and tetrapeptide were also associated with LTL. While the molecular mechanisms linking these chemicals to telomere variability remain to be determined, the negative effect of corticosterone on telomere aging observed in our analysis appears to be consistent with previous evidence demonstrating that elevated cortisol levels were associated with cognitive aging in human [53]. In addition, previous studies reported that tissue L-carnitine levels decline with age [54], and feeding aged rats with acetyl-L-carnitine reversed the age-related declines of L-carnitine levels in tissue and also reversed a number of age-related changes in liver mitochondrial function [55]. These results support the beneficial effect of hexadecanedioic acid mono-L-carnitine ester on biological aging observed in our study. The protective effect of tetrapetide (LAVA) on telomere aging in our study appears to be also in line with the anti-inflammatory and antioxidant properties of bioactive peptides observed in previous research [56].
Our study has several limitations. First, although our high-resolution LC-MS detected many distinct features, it should be noted that only 18% of the ions detected had a match in the current metabolomics database. These compounds were unable to be pursed due to the large number of possible isomers and a lack of available standards, however, these currently unannotated metabolites may represent genuine metabolites associated with disease process and with the advancement of metabolomic research, we expect that majority of these unknowns will ultimately be annotated and their associations with disease will be identified. Second, although we were able to control many known risk factors related to aging, the possibility of potential confounding by other factors, such as diet and gut microbiota, cannot be entirely excluded. Third, study participants included in the current analysis are American Indians; it is unclear whether our findings could be generalized to other populations with different genetic and/or lifestyle background. Finally, our results need to be replicated in large-scale metabolomic analysis of American Indians and other ethnic populations as well.
In summary, this is the first study to interrogate the human metabolome of biological aging. Altered plasma levels of nineteen metabolites are significantly associated with interindividual variability in LTL, independent of chronological age and many other aging-related factors. These newly detected metabolites are consistent with known pathophysiological mechanisms of aging and are in agreement with previous studies, suggesting biological plausibility of our findings. Our results provide a better understanding and potential novel markers of telomeric aging. Targeting biological pathways that involve these newly detected metabolites may help to develop preventive and therapeutic strategies towards healthy aging and age-related disorders.
Methods
Study population
The Strong Heart Family Study (SHFS) is a family-based prospective cohort study to identify genetic factors for CVD, diabetes and associated risk factors in American Indians. The study was initiated in 2001-2003 by recruiting 3,665 individuals (14-93 years older) from 94 multi-generational families residing in Arizona (AZ), North and South Dakota (DK) and Oklahoma (OK). Study design and methods of the SHFS have been described previously [24]. The SHFS protocol was approved by the Institutional Review Boards from the Indian Health Service and the participating centers. All subjects gave informed consent.
The current analysis included 423 SHFS participants with complete telomere and metabolomics data. Participants with overt CVD or T2D and those on hypoglycemic (both oral and insulin) medications were excluded from this analysis. The focus on an apparently healthy population will facilitate the identification of early metabolic biomarkers and therapeutic targets for anti-aging and age-related disorders.
Assessments of risk factors
Fasting plasma glucose, insulin, lipids, lipoproteins and inflammatory biomarkers were measured by standard laboratory methods [24]. Body mass index (BMI) was calculated as weight in kilograms divided by the square of the height in meters (kg/m2). Diabetes was defined as fasting plasma glucose ≥7.0 mmol/L and/or treatment for diabetes [25]. Hypertension was defined as blood pressure levels ≥ 140/90 mm Hg or use of antihypertensive medications. Cigarette smoking was classified as current smokers, former smokers and nonsmokers. Alcohol consumption was determined by self-reported history of alcohol intake, the type of alcoholic beverages consumed, frequency of alcohol consumption, and average quantity consumed per day and per week. Participants are classified as current drinkers, former drinkers and never drinkers. Dietary intake was assessed using the block food frequency questionnaire (FFQ) [26]. Level of physical activity was estimated by the mean number of steps per day on pedometer calculated by averaging the total number of steps recorded each day during the 7-day period.
Measurement of leukocyte telomere length (LTL)
Details for the measurement of LTL have been described elsewhere [19]. Briefly, relative mean telomere length was measured using a high-throughput telomere length assay system designed by Dr. Elizabeth Blackburn's laboratory at the University of California, San Francisco. This assay determines the ratio of telomeric product/single copy gene (T/S) obtained using quantitative PCR (qPCR) according to protocols described previously [27, 28]. The rationale of this method is that the longer the telomeres are in each sample, the more PCR product will be generated in PCR reactions using primers specific for the telomeric DNA. This can be quantified by qPCR using a serially diluted standard DNA and the standard curve method. To normalize the quantity of the input DNA, a single copy gene was amplified in parallel as well. The ratio of the telomeric product versus the single copy gene reflects the average length of the telomeres. Each DNA sample was assayed three times (each time with duplicates), and the three T/S ratios were normalized to the mean of all samples and used in the analysis. For quality control, seven control DNA samples from various cancer cell lines were included in each assay plate. These control samples allowed us to create standard curves, which were then integrated into a composite standard curve used for T and S concentration calculations. In addition, 4.1% of the total sample was assayed in duplicate. Telomere length of the replicate samples were highly correlated (r = 0.95, p<0.0001). The intra-assay and inter-assay (assay-to-assay) percentage of coefficient variation were 4.6% and 6.9%, respectively. Lab technicians were blinded to sample duplication and any knowledge of clinical data.
Metabolic profiling by high resolution liquid chromatography-mass spectrometry (LC-MS)
Relative abundance of fasting plasma metabolites was determined using non-targeted metabolomic approach via high-resolution LC-MS. Detailed lab protocols have been described elsewhere [29, 30]. Briefly, 65 μL plasma sample aliquots were treated with acetonitrile, spiked with internal standard mix, and centrifuged at 13,000 x g for 10 minutes at 4°C to remove proteins. 130 μL supernatant was removed and loaded into autosampler vials. Mass spectral data were collected with a 10 minute gradient on a Thermo LTQ-Velos Orbitrap mass spectrometer (Thermo Fisher, San Diego, CA) to collect data from mass/charge ratio (m/z) 85 to 2000 in a positive ionization mode. Three technical replicates were run for each sample using dual column chromatography procedure with C18 and an anion exchange column. Peak extraction, data alignment and feature quantification were performed using the adaptive processing software (apLCMS) [31], a computer package designed for high-resolution metabolomics data analysis. Potential metabolite identities were determined by performing online search (10 ppm mass accuracy) against the Metlin database [32], the Human Metabolomics Database (HMDB)[33], and the LIPID MAPS structure database (LMSD) [34]. Data filtering, normalization, diagnostics and summarization were performed using the computer package MSPrep [35]. Missing data were imputed using the half of the minimum observed value within each metabolite across all samples. Metabolites with high analytical variance (e.g., coefficient variation > 50%) in our samples were excluded from further analyses. Batch-effect was corrected using the algorithm ComBat implemented in MSPrep[35]. Lab technicians were blinded to clinical data of study participants.
Statistical analysis
Prior to statistical analysis, metabolites data were log-transformed and standardized to unit variance and zero mean (z-scores). Continuous variables such as age, BMI, waist circumference (WC), low-density lipoprotein cholesterol (LDL-c), total cholesterol (TC), eGFR, and fasting glucose were also converted to standard normal distributions with corresponding mean and standard deviation. Tests for linear trends across LTL tertiles were conducted by using the median value in each LTL tertile as a continuous variable in the GEE regression models.
To estimate the effect of each metabolite on telomere variation, we conducted multivariate regression analysis using generalized estimating equation (GEE), which accounts for relatedness among family members. In the GEE model, the level of each matching metabolite (continuous variable) was the independent variable, and telomere length (continuous variable) was the dependent variable, adjusting for chronological age and other clinical factors that differ significantly across LTL tertiles, including WC, LDL-c, TC, and eGFR (see Table 1). Sex and study site were also included in the model. The combined effects of metabolites on telomere length variability were estimated by constructing a multi-marker score based on metabolites that are significantly associated with LTL by fitting a model according to the formula:
To identify metabolic profiles associated with telomere length, we conducted sparse partial least-squares discriminant analysis (sPLS-DA) using the computer package ‘mixOmics' implemented in the R package. The sPLS-DA is a supervised, multivariate technique to determine metabolic groups associated with disease risk. Unlike principal component analysis (PCA) which focuses on variance maximization of the predictors alone, the sPLS-DA models covariance maximization between predictors (metabolites) and disease phenotype (telomere length) when estimating the parameters of a linear regression model, thus represents a regression extension of PCA. The sPLS-DA analysis included only metabolites showing significant associations with LTL and adjusted for age, sex, study center and BMI. For ease of visualization, we presented a Manhattan plot (−log10p vs metabolic feature) showing the significance of individual metabolites associated with LTL using raw p values obtained from multivariate regression analysis (FDR at q=0.05 with a horizontal line). To examine the robustness of our results, we conducted additional analyses by further adjusting for lifestyle factors (smoking, alcohol consumption and physical activity level), diet (dietary fat, protein and caloric intake) and social economic variables.
Acknowledgments
The authors would also like to thank the Strong Heart Study participants, Indian Health Service facilities, and participating tribal communities for their extraordinary cooperation and involvement, which has contributed to the success of the Strong Heart Study. The views expressed in this article are those of the authors and do not necessarily reflect those of the Indian Health Service.
Funding
This study was supported by NIH grants R01DK091369, K01AG034259, R21HL092363 and cooperative agreement grants U01HL65520, U01HL41642, U01HL41652, U01HL41654, and U01HL65521.
Conflicts of Interest
The authors have declared that no conflict of interest exists.
References
- 1. Van Pelt RE, Jones PP, Davy KP, Desouza CA, Tanaka H, Davy BM, Seals DR. Regular exercise and the age-related decline in resting metabolic rate in women. The Journal of clinical endocrinology and metabolism. 1997; 82: 3208 -3212. [PubMed] .
- 2. Roder ME, Schwartz RS, Prigeon RL, Kahn SE. Reduced pancreatic B cell compensation to the insulin resistance of aging: impact on proinsulin and insulin levels. The Journal of clinical endocrinology and metabolism. 2000; 85: 2275 -2280. [PubMed] .
- 3. Iozzo P, Beck-Nielsen H, Laakso M, Smith U, Yki-Jarvinen H, Ferrannini E. Independent influence of age on basal insulin secretion in nondiabetic humans. European Group for the Study of Insulin Resistance. The Journal of clinical endocrinology and metabolism. 1999; 84: 863 -868. [PubMed] .
- 4. Maher P. The effects of stress and aging on glutathione metabolism. Ageing research reviews. 2005; 4: 288 -314. [PubMed] .
- 5. Barzilai N, Huffman DM, Muzumdar RH, Bartke A. The critical role of metabolic pathways in aging. Diabetes. 2012; 61: 1315 -1322. [PubMed] .
- 6. Feldser DM, Hackett JA, Greider CW. Telomere dysfunction and the initiation of genome instability. Nature reviews Cancer. 2003; 3: 623 -627. .
- 7. Levine TB and Levine AB. 2012; Telomeres. Metabolic Syndrome and Cardiovascular Disease Wiley-Blackwell .
- 8. Sahin E, Colla S, Liesa M, Moslehi J, Muller FL, Guo M, Cooper M, Kotton D, Fabian AJ, Walkey C, Maser RS, Tonon G, Foerster F, et al. Telomere dysfunction induces metabolic and mitochondrial compromise. Nature. 2011; 470: 359 -365. [PubMed] .
- 9. Gan B, Hu J, Jiang S, Liu Y, Sahin E, Zhuang L, Fletcher-Sananikone E, Colla S, Wang YA, Chin L, Depinho RA. Lkb1 regulates quiescence and metabolic homeostasis of haematopoietic stem cells. Nature. 2010; 468: 701 -704. [PubMed] .
- 10. Tomas-Loba A, Bernardes de Jesus B, Mato JM, Blasco MA. A metabolic signature predicts biological age in mice. Aging cell. 2013; 12: 93 -101. [PubMed] .
- 11. Bernardes de, Jesus B, Vera E, Schneeberger K, Tejera AM, Ayuso E, Bosch F, Blasco MA. Telomerase gene therapy in adult and old mice delays aging and increases longevity without increasing cancer. EMBO molecular medicine. 2012; 4: 691 -704. [PubMed] .
- 12. Moreno-Navarrete JM, Ortega F, Sabater M, Ricart W, Fernandez-Real JM. Telomere length of subcutaneous adipose tissue cells is shorter in obese and formerly obese subjects. Int J Obes (Lond). 2010; 34: 1345 -1348. [PubMed] .
- 13. Salpea KD and Humphries SE. Telomere length in atherosclerosis and diabetes. Atherosclerosis. 2010; 209: 35 -38. [PubMed] .
- 14. Gardner JP, Li S, Srinivasan SR, Chen W, Kimura M, Lu X, Berenson GS, Aviv A. Rise in insulin resistance is associated with escalated telomere attrition. Circulation. 2005; 111: 2171 -2177. [PubMed] .
- 15. Adaikalakoteswari A, Balasubramanyam M, Ravikumar R, Deepa R, Mohan V. Association of telomere shortening with impaired glucose tolerance and diabetic macroangiopathy. Atherosclerosis. 2007; 195: 83 -89. [PubMed] .
- 16. O'Donnell CJ, Demissie S, Kimura M, Levy D, Gardner JP, White C, D'Agostino RB, Wolf PA, Polak J, Cupples LA, Aviv A. Leukocyte telomere length and carotid artery intimal medial thickness: the Framingham Heart Study. Arterioscler Thromb Vasc Biol. 2008; 28: 1165 -1171. [PubMed] .
- 17. Harte AL, da Silva NF, Miller MA, Cappuccio FP, Kelly A, O'Hare JP, Barnett AH, Al-Daghri NM, Al-Attas O, Alokail M, Sabico S, Tripathi G, Bellary S, et al. Telomere length attrition, a marker of biological senescence, is inversely correlated with triglycerides and cholesterol in South Asian males with type 2 diabetes mellitus. Experimental diabetes research. 2012; 2012: 895185 [PubMed] .
- 18. Yang Z, Huang X, Jiang H, Zhang Y, Liu H, Qin C, Eisner GM, Jose PA, Rudolph L, Ju Z. Short telomeres and prognosis of hypertension in a chinese population. Hypertension. 2009; 53: 639 -645. [PubMed] .
- 19. Zhao J, Zhu Y, Lin J, Matsuguchi T, Blackburn E, Zhang Y, Cole SA, Best LG, Lee ET, Howard BV. Short leukocyte telomere length predicts risk of diabetes in american indians: the strong heart family study. Diabetes. 2014; 63: 354 -362. [PubMed] .
- 20. Bain JR, Stevens RD, Wenner BR, Ilkayeva O, Muoio DM, Newgard CB. Metabolomics applied to diabetes research: moving from information to knowledge. Diabetes. 2009; 58: 2429 -2443. [PubMed] .
- 21. Houtkooper RH, Argmann C, Houten SM, Canto C, Jeninga EH, Andreux PA, Thomas C, Doenlen R, Schoonjans K, Auwerx J. The metabolic footprint of aging in mice. Scientific reports. 2011; 1: 134 [PubMed] .
- 22. Takiyama N and Matsumoto K. Age-and sex-related differences of serum carnitine in a Japanese population. Journal of the American College of Nutrition. 1998; 17: 71 -74. [PubMed] .
- 23. Yu Z, Zhai G, Singmann P, He Y, Xu T, Prehn C, Romisch-Margl W, Lattka E, Gieger C, Soranzo N, Heinrich J, Standl M, Thiering E, et al. Human serum metabolic profiles are age dependent. Aging cell. 2012; 11: 960 -967. [PubMed] .
- 24. Lee ET, Welty TK, Fabsitz R, Cowan LD, Le NA, Oopik AJ, Cucchiara AJ, Savage PJ, Howard BV. The Strong Heart Study. A study of cardiovascular disease in American Indians: design and methods. Am J Epidemiol. 1990; 132: 1141 -1155. [PubMed] .
- 25. Mellitus TECotDaCoD. 2002; Report of the Expert Committee on the Diagnosis and Classification of Diabetes Mellitus. s5 -s20. .
- 26. Willett W. 1998; Food frequency methods Nutritional Epidemiology. New York, NY Oxford University Press 74 -91. .
- 27. Cawthon RM. Telomere measurement by quantitative PCR. Nucleic acids research. 2002; 30: e47 [PubMed] .
- 28. Lin J, Epel E, Cheon J, Kroenke C, Sinclair E, Bigos M, Wolkowitz O, Mellon S, Blackburn E. Analyses and comparisons of telomerase activity and telomere length in human T and B cells: insights for epidemiology of telomere maintenance. Journal of immunological methods. 2010; 352: 71 -80. [PubMed] .
- 29. Osborn MP, Park Y, Parks MB, Burgess LG, Uppal K, Lee K, Jones DP, Brantley MA Jr. Metabolome-wide association study of neovascular age-related macular degeneration. PloS one. 2013; 8: e72737 [PubMed] .
- 30. Ungvari Z, Parrado-Fernandez C, Csiszar A, de Cabo R. Mechanisms underlying caloric restriction and lifespan regulation: implications for vascular aging. Circulation research. 2008; 102: 519 -528. [PubMed] .
- 31. Yu T, Park Y, Johnson JM, Jones DP. apLCMS--adaptive processing of high-resolution LC/MS data. Bioinformatics. 2009; 25: 1930 -1936. [PubMed] .
- 32. Smith CA, O'Maille G, Want EJ, Qin C, Trauger SA, Brandon TR, Custodio DE, Abagyan R, Siuzdak G. METLIN: a metabolite mass spectral database. Therapeutic drug monitoring. 2005; 27: 747 -751. [PubMed] .
- 33. Wishart DS, Jewison T, Guo AC, Wilson M, Knox C, Liu Y, Djoumbou Y, Mandal R, Aziat F, Dong E, Bouatra S, Sinelnikov I, Arndt D, et al. HMDB 3.0--The Human Metabolome Database in 2013. Nucleic acids research. 2013; 41: D801 -807. [PubMed] .
- 34. Sud M, Fahy E, Cotter D, Brown A, Dennis EA, Glass CK, Merrill AH Jr, Murphy RC, Raetz CR, Russell DW, Subramaniam S. LMSD: LIPID MAPS structure database. Nucleic acids research. 2007; 35: D527 -532. [PubMed] .
- 35. Hughes G, Cruickshank-Quinn C, Reisdorph R, Lutz S, Petrache I, Reisdorph N, Bowler R, Kechris K. MSPrep--Summarization, normalization and diagnostics for processing of mass spectrometry-based metabolomic data. Bioinformatics. 2014; 30: 133 -134. [PubMed] .
- 36. Storey JD. A direct approach to false discovery rates. J R Stat Soc B. 2002; 64: 187 -205. .
- 37. Brites P, Waterham HR, Wanders RJ. Functions and biosynthesis of plasmalogens in health and disease. Biochimica et biophysica acta. 2004; 1636: 219 -231. [PubMed] .
- 38. Wood PL. Lipidomics of Alzheimer's disease: current status. Alzheimer's research & therapy. 2012; 4: 5 .
- 39. Lessig J and Fuchs B. Plasmalogens in biological systems: their role in oxidative processes in biological membranes, their contribution to pathological processes and aging and plasmalogen analysis. Current medicinal chemistry. 2009; 16: 2021 -2041. [PubMed] .
- 40. Amenta F, Parnetti L, Gallai V, Wallin A. Treatment of cognitive dysfunction associated with Alzheimer's disease with cholinergic precursors. Ineffective treatments or inappropriate approaches? Mechanisms of ageing and development. 2001; 122: 2025 -2040. [PubMed] .
- 41. Li T and Chiang JY. Bile Acid signaling in liver metabolism and diseases. Journal of lipids. 2012; 2012: 754067 [PubMed] .
- 42. Goldberg AA, Richard VR, Kyryakov P, Bourque SD, Beach A, Burstein MT, Glebov A, Koupaki O, Boukh-Viner T, Gregg C, Juneau M, English AM, Thomas DY, et al. Chemical genetic screen identifies lithocholic acid as an anti-aging compound that extends yeast chronological life span in a TOR-independent manner, by modulating housekeeping longevity assurance processes. Aging. 2010; 2: 393 -414. [PubMed] .
- 43. Gerisch B, Rottiers V, Li D, Motola DL, Cummins CL, Lehrach H, Mangelsdorf DJ, Antebi A. A bile acid-like steroid modulates Caenorhabditis elegans lifespan through nuclear receptor signaling. Proceedings of the National Academy of Sciences of the United States of America. 2007; 104: 5014 -5019. [PubMed] .
- 44. Bertolotti M, Gabbi C, Anzivino C, Crestani M, Mitro N, Del Puppo M, Godio C, De Fabiani E, Macchioni D, Carulli L, Rossi A, Ricchi M, Loria P, et al. Age-related changes in bile acid synthesis and hepatic nuclear receptor expression. European journal of clinical investigation. 2007; 37: 501 -508. [PubMed] .
- 45. O'Sullivan RJ and Karlseder J. Telomeres: protecting chromosomes against genome instability. Nature reviews Molecular cell biology. 2010; 11: 171 -181. .
- 46. Schmid HH and Berdyshev EV. Cannabinoid receptor-inactive N-acylethanolamines and other fatty acid amides: metabolism and function. Prostaglandins, leukotrienes, and essential fatty acids. 2002; 66: 363 -376. .
- 47. Dang HT, Kang GJ, Yoo ES, Hong J, Choi JS, Kim HS, Chung HY, Jung JH. Evaluation of endogenous fatty acid amides and their synthetic analogues as potential anti-inflammatory leads. Bioorganic & medicinal chemistry. 2011; 19: 1520 -1527. [PubMed] .
- 48. Meijers BK, de Loor H, Verbeke K, Evenepoel P. p-Cresol for better or worse: but what are we measuring? Kidney international. 2006; 70: 1 232 author reply 232 -233. [PubMed] .
- 49. Ujhelyi L, Balla G, Jeney V, Varga Z, Nagy E, Vercellotti GM, Agarwal A, Eaton JW, Balla J. Hemodialysis reduces inhibitory effect of plasma ultrafiltrate on LDL oxidation and subsequent endothelial reactions. Kidney international. 2006; 69: 144 -151. [PubMed] .
- 50. Erion DM and Shulman GI. Diacylglycerol-mediated insulin resistance. Nature medicine. 2010; 16: 400 -402. .
- 51. Itani SI, Ruderman NB, Schmieder F, Boden G. Lipid-induced insulin resistance in human muscle is associated with changes in diacylglycerol, protein kinase C, and IkappaB-alpha. Diabetes. 2002; 51: 2005 -2011. [PubMed] .
- 52. Greer EL and Brunet A. Signaling networks in aging. Journal of cell science. 2008; 121: 407 -412. [PubMed] .
- 53. Lupien SJ, de Leon M, de Santi S, Convit A, Tarshish C, Nair NP, Thakur M, McEwen BS, Hauger RL, Meaney MJ. Cortisol levels during human aging predict hippocampal atrophy and memory deficits. Nature neuroscience. 1998; 1: 69 -73. .
- 54. Costell M, O'Connor JE, Grisolia S. Age-dependent decrease of carnitine content in muscle of mice and humans. Biochemical and biophysical research communications. 1989; 161: 1135 -1143. [PubMed] .
- 55. Hagen TM, Ingersoll RT, Wehr CM, Lykkesfeldt J, Vinarsky V, Bartholomew JC, Song MH, Ames BN. Acetyl-L-carnitine fed to old rats partially restores mitochondrial function and ambulatory activity. Proceedings of the National Academy of Sciences of the United States of America. 1998; 95: 9562 -9566. [PubMed] .
- 56. Chakrabarti S, Jahandideh F, Wu J. Food-Derived Bioactive Peptides on Inflammation and Oxidative Stress. BioMed research international. 2014; 2014: 608979 [PubMed] .