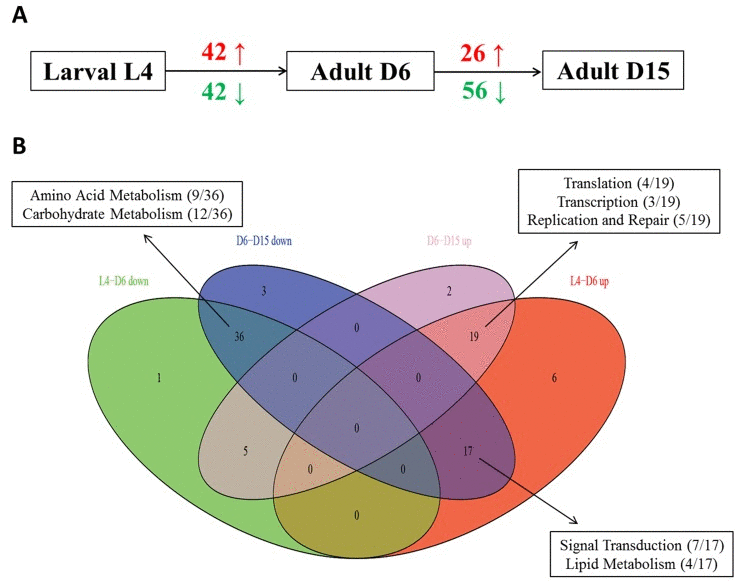
Figure 1.The summary of up- and down- regulated pathways based on GSEA during aging(A) It showed the numbers of significantly identified pathways based on GSEA in each period during aging in C. elegans (red is for up-regulated and green is for down-regulated). Obviously, there were 42 up-regulated and 42 down-regulated significantly associated pathways from the stage of L4 to D6, as well as 26 up-regulated and 56 down-regulated significantly associated pathways from the stage of D6 to D15. (B) The Venn diagram showed the comparisons of each pathway group above. L4-D6 down represents the group of identified down-regulated pathways from the stage of L4 to D6; L4-D6 up represents the group of identified up-regulated pathways from the stage of L4 to D6; D6-D15 down represents the group of identified down-regulated pathways from the stage of D6 to D15; D6-D15 up represents the group of identified up-regulated pathways from the stage of D6 to D15. The boxes showed the mainly involved functional categories (KEGG Pathway Maps) as well as the percentage of each category.