


Introduction
The nematode worm C. elegans had already been established as a useful model organism for studies of aging since it has a relatively short life span and can easily propagate populations of synchronized individuals. Aging in C. elegans has been proposed to be caused by hyperfunction, that is, overactivity during adulthood of processes particularly biosynthetic that contribute to development and reproduction. Such hyperfunction can lead to hypertrophy-associated pathologies, which cause the age increase in death [1]. Several mutated genes have been identified to extend lifespan by large-scale RNAi longevity screens in C. elegans [2]. However, there are discordant results in some of the screens which suggest that these screens have not been saturated and more single gene mutations and deletions that influence lifespan and healthspan are conceivable [3]. Together, some signaling pathways defined by each genetic factors which affect lifespan have been discovered, such as insulin/IGF-1-like signaling (IIS) pathway by a FOXO-family transcription factor DAF-16 [4]. Undoubtedly, aging involves changes in multiple genes involved in multiple processes, although some of them have not yet been known. Currently, microarray technology has been widely used in the genome wide study of gene expression changes associated with aging in C. elegans and may provide some insights into potential mechanisms [5]. A lot of genes with specific changes related to C. elegans aging have been uncovered from the statistical analysis of differentially expressed genes (DEG) in the expression profiling, including the methods of Analysis of Variance (ANOVA), Significance Analysis of Microarray (SAM) and Student t test [5-8]. However many questions remain, especially on the regulation of genetic pathways and the expression patterns as well as regulatory networks during aging. Compared to individual DEG approach, the well-established approach of Gene Set Enrichment Analysis (GSEA) may be more compatible in the interpretation of gene expression data [9, 10].
As we all know, DNA-binding proteins, especially the transcription factors (TFs), play crucial roles in many major cellular processes. Nowadays, ChIP–seq can successfully detect the binding sites of TFs in genome wide [11, 12]. From the modENCODE database, the relevant ChIP–seq data sets involved in several aging transcriptional regulators are available [13]. In order to capture the essential regulatory features behind high-throughput biological data, such as identifying potential regulatory interactions between TFs and genes involved in aging, especially in multiple pathways level, it would be necessary and possible to integrate ChIP–seq data and gene expression profiles.
Results and Discussion
Identification of significantly aging-dependent pathways
Based on the GSEA approach, we have identified several significantly related genetic pathways during aging in C. elegans. There were significantly 42 up- and 42 down-regulated pathways from the stage of L4 to D6, as well as 26 up- and 56 down-regulated pathways from the stage of D6 to D15 (Figure 1A and Additional file 1). By the comparison of each group, we have also identified some overlapping pathways significantly associated in both of these two periods, which were detailed in Table 1 and Figure 1B. In summary, there were totally 17 overlapping pathways significantly up-regulated from L4 to D6 but down-regulated from D6 to D15, and most of them were related to Signal Transduction (7/17) and Lipid Metabolism (4/17) according to KEGG pathway maps in the KEGG database (http://www.genome.jp/kegg/). Interestingly, 6 different signaling pathways were significantly par-ticipating in this dynamic regulation, including MAPK signaling pathway, mTOR signaling pathway, Wnt signaling pathway, TGF-beta signaling pathway, ErbB signaling pathway and Hedgehog signaling pathway.
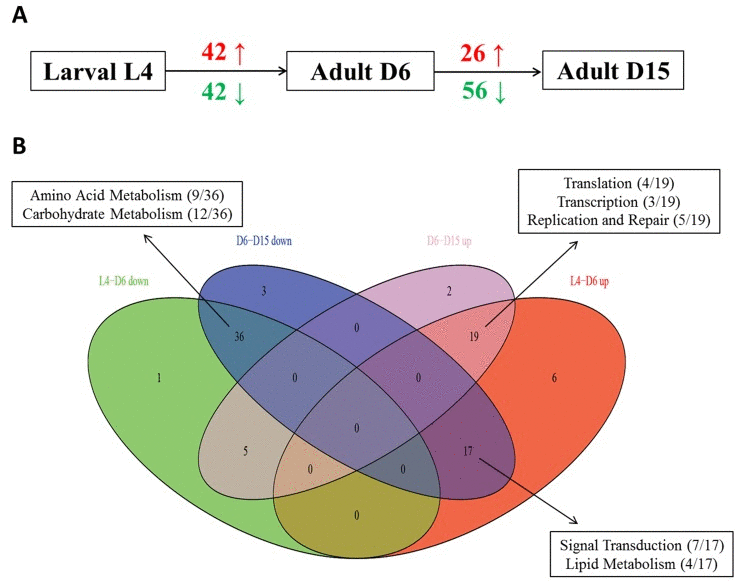
Figure 1. The summary of up- and down- regulated pathways based on GSEA during aging (A) It showed the numbers of significantly identified pathways based on GSEA in each period during aging in C. elegans (red is for up-regulated and green is for down-regulated). Obviously, there were 42 up-regulated and 42 down-regulated significantly associated pathways from the stage of L4 to D6, as well as 26 up-regulated and 56 down-regulated significantly associated pathways from the stage of D6 to D15. (B) The Venn diagram showed the comparisons of each pathway group above. L4-D6 down represents the group of identified down-regulated pathways from the stage of L4 to D6; L4-D6 up represents the group of identified up-regulated pathways from the stage of L4 to D6; D6-D15 down represents the group of identified down-regulated pathways from the stage of D6 to D15; D6-D15 up represents the group of identified up-regulated pathways from the stage of D6 to D15. The boxes showed the mainly involved functional categories (KEGG Pathway Maps) as well as the percentage of each category.
Table 1. The overlapping significantly down or up-regulated pathways during aging
| Overlapping Significant Pathways | KEGG Pathway Maps |
|---|---|
| L4-D6 up / D6-D15 down | |
| 00562 Inositol phosphate metabolism | Carbohydrate Metabolism |
| 04710 Circadian rhythm - mammal | Environmental Adaptation |
| 00511 Other glycan degradation | Glycan Biosynthesis and Metabolism |
| 04650 Natural killer cell mediated cytotoxicity | Immune System |
| 00564 Glycerophospholipid metabolism | Lipid Metabolism |
| 00590 Arachidonic acid metabolism | Lipid Metabolism |
| 00600 Sphingolipid metabolism | Lipid Metabolism |
| 00561 Glycerolipid metabolism | Lipid Metabolism |
| 00450 Selenocompound metabolism | Metabolism of Other Amino Acids |
| 04310 Wnt signaling pathway | Signal Transduction |
| 04010 MAPK signaling pathway | Signal Transduction |
| 04012 ErbB signaling pathway | Signal Transduction |
| 04350 TGF-beta signaling pathway | Signal Transduction |
| 04070 Phosphatidylinositol signaling system | Signal Transduction |
| 04150 mTOR signaling pathway | Signal Transduction |
| 04340 Hedgehog signaling pathway | Signal Transduction |
| 04144 Endocytosis | Transport and Catabolism |
| L4-D6 down / D6-D15 down | |
| 00280 Valine, leucine and isoleucine degradation | Amino Acid Metabolism |
| 00310 Lysine degradation | Amino Acid Metabolism |
| 00330 Arginine and proline metabolism | Amino Acid Metabolism |
| 00250 Alanine, aspartate and glutamate metabolism | Amino Acid Metabolism |
| 00270 Cysteine and methionine metabolism | Amino Acid Metabolism |
| 00350 Tyrosine metabolism | Amino Acid Metabolism |
| 00260 Glycine, serine and threonine metabolism | Amino Acid Metabolism |
| 00380 Tryptophan metabolism | Amino Acid Metabolism |
| 00340 Histidine metabolism | Amino Acid Metabolism |
| 00650 Butanoate metabolism | Carbohydrate Metabolism |
| 00052 Galactose metabolism | Carbohydrate Metabolism |
| 00040 Pentose and glucuronate interconversions | Carbohydrate Metabolism |
| 00010 Glycolysis / Gluconeogenesis | Carbohydrate Metabolism |
| 00051 Fructose and mannose metabolism | Carbohydrate Metabolism |
| 00640 Propanoate metabolism | Carbohydrate Metabolism |
| 00500 Starch and sucrose metabolism | Carbohydrate Metabolism |
| 00020 Citrate cycle (TCA cycle) | Carbohydrate Metabolism |
| 00630 Glyoxylate and dicarboxylate metabolism | Carbohydrate Metabolism |
| 00620 Pyruvate metabolism | Carbohydrate Metabolism |
| 00030 Pentose phosphate pathway | Carbohydrate Metabolism |
| 00053 Ascorbate and aldarate metabolism | Carbohydrate Metabolism |
| 00514 Other types of O-glycan biosynthesis | Glycan Biosynthesis and Metabolism |
| 00062 Fatty acid elongation | Lipid metabolism |
| 00910 Nitrogen metabolism | Lipid metabolism |
| 00071 Fatty acid metabolism | Lipid Metabolism |
| 01100 Metabolic pathways | Metabolism |
| 00860 Porphyrin and chlorophyll metabolism | Metabolism of Cofactors and Vitamins |
| 00670 One carbon pool by folate | Metabolism of Cofactors and Vitamins |
| 00830 Retinol metabolism | Metabolism of Cofactors and Vitamins |
| 00480 Glutathione metabolism | Metabolism of Other Amino Acids |
| 00410 beta-Alanine metabolism | Metabolism of Other Amino Acids |
| 04020 Calcium signaling pathway | Signal Transduction |
| 04145 Phagosome | Transport and Catabolism |
| 00983 Drug metabolism - other enzymes | Xenobiotics Biodegradation and Metabolism |
| 00980 Metabolism of xenobiotics by cytochrome P450 | Xenobiotics Biodegradation and Metabolism |
| 00982 Drug metabolism - cytochrome P450 | Xenobiotics Biodegradation and Metabolism |
| L4-D6 up / D6-D15 up | |
| 04914 Progesterone-mediated oocyte maturation | Endocrine System |
| 04120 Ubiquitin mediated proteolysis | Folding, Sorting and Degradation |
| 03018 RNA degradation | Folding, Sorting and Degradation |
| 00510 N-Glycan biosynthesis | Glycan Biosynthesis and Metabolism |
| 00240 Pyrimidine metabolism | Nucleotide Metabolism |
| 03420 Nucleotide excision repair | Replication and Repair |
| 03030 DNA replication | Replication and Repair |
| 03430 Mismatch repair | Replication and Repair |
| 03410 Base excision repair | Replication and Repair |
| 03440 Homologous recombination | Replication and Repair |
| 04630 Jak-STAT signaling pathway | Signal Transduction |
| 03022 Basal transcription factors | Transcription |
| 03020 RNA polymerase | Transcription |
| 03040 Spliceosome | Transcription |
| 03010 Ribosome | Translation |
| 03013 RNA transport | Translation |
| 03015 mRNA surveillance pathway | Translation |
| 03008 Ribosome biogenesis in eukaryotes | Translation |
| 04140 Regulation of autophagy | Transport and Catabolism |
| L4-D6 down / D6-D15 up | |
| 03060 Protein export | Folding, Sorting and Degradation |
| 00230 Purine metabolism | Nucleotide Metabolism |
| 00970 Aminoacyl-tRNA biosynthesis | Translation |
| 00360 Phenylalanine metabolism | Amino Acid Metabolism |
| 00290 Valine, leucine and isoleucine biosynthesis | Amino Acid Metabolism |
Moreover, there were totally 36 overlapping pathways significantly down-regulated both from L4 to D6 and from D6 to D15, and most of them were related to Amino Acid Metabolism (9/36) and Carbohydrate Metabolism (12/36); there were totally 19 overlapping pathways significantly up-regulated both from L4 to D6 and from D6 to D15, and most of them were related to Translation (4/19) and Transcription (3/19) as well as Replication and Repair (5/19). All of these data revealed the dynamic re-gulation in multiple pathways during aging in C. elegans.
Dynamic regulation in multiple signaling pathways
In the study of Youngman MJ et al. [14], a decline in PMK-1 p38 mitogen-activated protein kinase (MAPK) pathway, one of conserved pathways involved in pathogen defense, was observed by analyzing gene expression levels using unpaired t test in synchronized populations of N2 worms during mid-to-late adulthood (at Day 6 of adulthood and Day 15 of adulthood). It was consistent with our result on MAPK signaling pathway, which was identified as significantly down-regulated from D6 to D15 of adulthood (highlighted in red color in Additional file 1). Surprisingly, MAPK signaling pathway was shown to be significantly up-regulated during young-to-mid adulthood (at the late larval L4 stage and Day 6 of adulthood) in our study, which was not reported by Youngman MJ et al. study [14]. Furthermore, MAPK signaling pathway was identified as truly aging-dependent pathways based on the hierarchical clustering of both samples and involved genes (Figure 2A for the data from L4 to D6 and Fig2B from D6 to D15). Obviously, using the expression data of involved genes in MAPK signaling pathway, six samples were clustered into two groups with samples at the same stage (L4-1, L4-2 and L4-3 in group of L4; D6-1, D6-1 and D6-3 in group of D6; D15-1, D15-1 and D15-3 in group of D15). Actually, MAP kinase (MAPK)/Receptor Tyrosine Kinase (RTK)/RasGTPase signaling pathways were used repeatedly during metazoan development, which were reported to be required for larval viability and for many different developmental processes, including induction of vulval, uterine, spicule, P12 and excretory duct cell fates, control of sex myoblast migration and axon guidance, and promotion of germline meiosis [15]. The core components or regulators of C. elegans RTK/Ras/MAPK signaling pathway were also identified as the aging-dependent targets [16-18], such as LET-23, LIN-1 and LIN-45 (Figure 2 and Additional file 2). Among these candidate targets, four interesting genes, including ced-2, lin-45, ZK856.8 and F59D6.7, were significantly up-regulated from L4 to D6 and down-regulated from D6 to D15, showing dynamic expression patterns. Their significances of gene expression changes between two adjacent stages were shown in Table 2. In C. elegans, the ced-2 gene encodes a Src homology (SH) 2 and 3-containing adaptor protein, homologous to human CrkII, which is required for phagocytosis during programmed cell death and for migration of the distal tip cells of the somatic gonad. It was previously reported that ced-2 mutants may exhibit persistant corpses indicating defects in phagocytosis and distal tip cell migration defects in the gonadal arms [19]. The lin-45 gene encodes an ortholog of the vertebrate protein RAF which is required for larval viability, fertility and the induction of vulval cell fates [18]. Based on RNAi studies of three genes constituting the ERK cascade (lin-45/RAF1, mek-2/MEK1/2, andmpk-1/ERK1/2) as well as lip-1 encoding a MAPK phosphatase that inactivates MPK-1, a novel ERK-MAPK-mediated signaling pathway has been identified, which promotes longevity through two candidate transcription factors, SKN-1 and DAF-16 [20]. Additionally, the genes of ZK856.8 and F59D6.7 would be two important targets for further study of aging in MAPK signaling pathway.
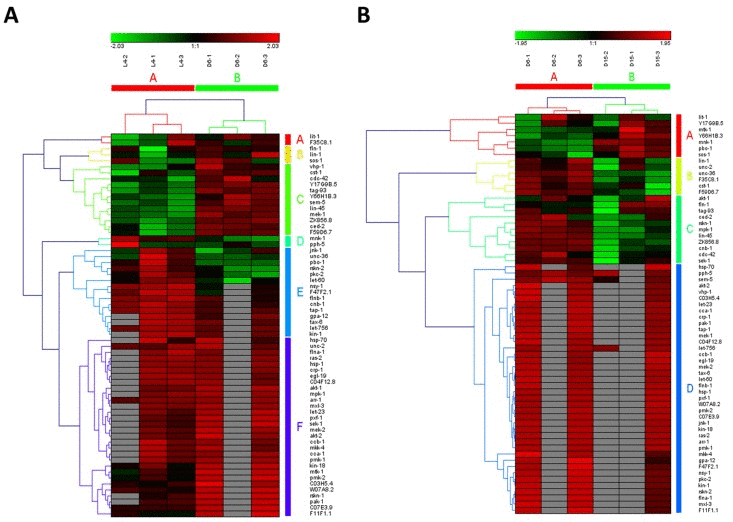
Figure 2. The heat map and hierarchical clustering in MAPK signaling pathway during aging (A) It showed the heat map and hierarchical clustering in MAPK signaling pathway from the stage of L4 to D6. The samples (column) were clustered into two groups, three replicates in the stage of L4 (L4-1, L4-2 and L4-3) were clustered together and three replicates at day 6 (D6-1, D6-2 and D6-3) were clustered together. There were 64 involved genes in MAPK signaling pathway from L4 to D6, which were clustered into 6 groups (the group from A to F).(B) It showed the heat map and hierarchical clustering in MAPK signaling pathway from the stage of D6 to D15. The samples were clustered into two groups, three replicates at day 6 (D6-1, D6-2 and D6-3) were clustered together and three replicates at day 15 (D15-1, D15-2 and D15-3) were clustered together. There were also 64 involved genes in MAPK signaling pathway from D6 to D15, which were clustered into 4 groups (the group from A to D). Red is for up-regulated and green is for down-regulated.
Table 2. The significantly associated genes with dynamic regulation pattern in signaling pathways during aging
| Genes | Related pathways | p1 (L4 to D6) | p2 (D6 to D15) |
|---|---|---|---|
| ced-2 | MAPK signaling pathway | 1.70E-02 | 3.62E-04 |
| lin-45 | MAPK signaling pathway mTOR signaling pathway ErbB signaling pathway | 1.34E-03 | 1.87E-03 |
| ZK856.8 | MAPK signaling pathway | 1.03E-03 | 7.11E-03 |
| F59D6.7 | MAPK signaling pathway | 1.41E-02 | 2.17E-02 |
| pdk-1 | mTOR signaling pathway | 4.58E-04 | 1.19E-02 |
| cyd-1 | Wnt signaling pathway | 4.50E-03 | 1.58E-03 |
| sma-4 | Wnt signaling pathway TGF-beta signaling pathway | 9.60E-03 | 5.51E-03 |
| skr-7 | Wnt signaling pathway TGF-beta signaling pathway | 3.76E-06 | 2.05E-02 |
| skr-8 | TGF-beta signaling pathway | 3.12E-05 | 4.59E-02 |
| skr-9 | Wnt signaling pathway TGF-beta signaling pathway | 1.03E-04 | 3.57E-02 |
| skr-13 | Wnt signaling pathway TGF-beta signaling pathway | 1.34E-05 | 2.27E-03 |
| skr-14 | Wnt signaling pathway TGF-beta signaling pathway | 5.99E-05 | 6.63E-03 |
The mammalian target of rapamycin (mTOR), also known as mechanistic target of rapamycin has been identified as a key modulator of ageing and age-related disease. The fact that inhibition of mTOR signaling pathway may extend lifespan in model organisms and confer protection against a growing list of age-related pathologies has been clearly approved [21]. In our study, this pathway was also identified as one of truly aging-dependent pathways with dynamic regulation, which was significantly up-regulated from L4 to D6 and down-regulated from D6 to D15 (Table 1). Like MAPK signaling pathway, based on the expression of candidate genes in mTOR signaling pathway, the samples at the same time point can be clustered together (Figure 3A for the data from L4 to D6 and Figure 3B from D6 to D15). There were 24 genes involved in mTOR signaling pathway both in the period of young-to-mid and mid-to- late adulthood, which were both clustered into 2 groups (the group of A and B in Figure 3A & 3B). Among these genes appearing in both the group of B in Figure 3A and the group A in Figure 3B, besides lin-45 mentioned above, the gene of pdk-1 was identified with dynamic expression pattern, which was significantly up-regulated from L4 to D6 (p=4.58E-04) and down-regulated from D6 to D15 (p=1.19E-02) (Table 2).In C. elegans, pdk-1 encodes the 3-phosphoinositide-dependent kinase 1 ortholog (PDK-1), which is a component of the DAF-2/insulin receptor-like signaling pathway and accordingly, functions to regulate such processes as dauer larvae formation as well as longevity [21]. The increased lifespan in daf-2 insulin/IGF-1 receptor mutants is accompanied by up-regulation of the MDL-1 Mad basic helix-loop-helix leucine zipper transcriptionfactor, which is an inhibitor of cell proliferation and growth that slows progression of an age-related pathology in C. elegans [22]. The previous studies have illustrated that mTOR signaling pathway plays the central role, whereas other pathways act on it by activating or antagonizing either at upstream or downstream [23-26].
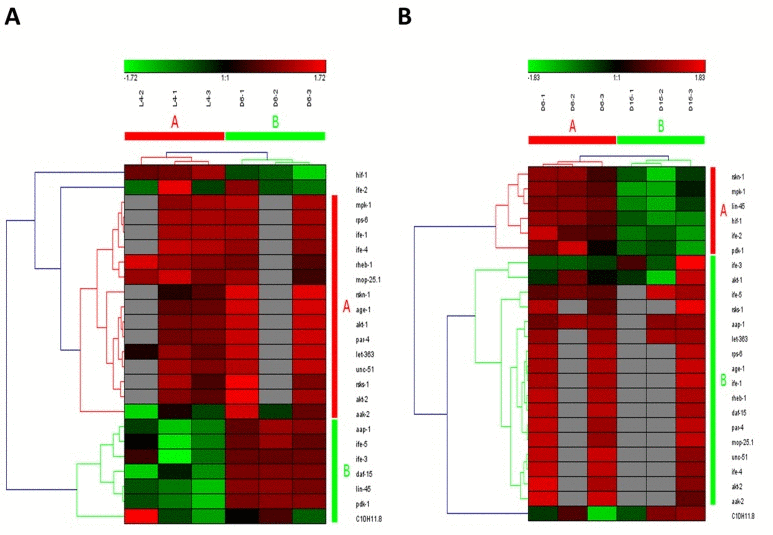
Figure 3. The heat map and hierarchical clustering in mTOR signaling pathway during aging (A) It showed the heat map and hierarchical clustering in mTOR signaling pathway from the stage of L4 to D6. The samples (column) were clustered into two groups, three replicates in the stage of L4 (L4-1, L4-2 and L4-3) were clustered together and three replicates at day 6 (D6-1, D6-2 and D6-3) were clustered together. There were 24 involved genes (row) in mTOR signaling pathway from L4 to D6, which were clustered into 2 groups (the group of A and B). (B) It showed the heat map and hierarchical clustering in mTOR signaling pathway from the stage of D6 to D15. The samples were clustered into two groups, three replicates at day 6 (D6-1, D6-2 and D6-3) were clustered together and three replicates at day 15 (D15-1, D15-2 and D15-3) were clustered together. There were also 24 involved genes in mTOR signaling pathway from D6 to D15, which were clustered into 2 groups (the group of A and B).Red is for up-regulated and green is for down-regulated.
Wnt signaling pathways have extremely diverse functions in animals, including the control of gene expression, cell behavior, cell adhesion, and cell polarity [19]. During aging in C. elegans, Wnt signaling pathway was identified as another truly aging-dependent pathway with dynamic regulation, which was significantly up-regulated from L4 to D6 and down-regulated from D6 to D15. There were 62 involved genes in Wnt signaling pathway, which were clustered into 4 groups from L4 to D6 (the group from A to D in Figure 4A) and clustered into 3 groups (the group from A to C in Figure 4B). Among these genes appearing in both the group of A in Figure 4A and the group C in Figure 4B, there were 8 dynamically regulated genes containing sma-4, cyd-1, skr-7,9,13,14,F59D6.7 and ZK856.8, which were significantly up-regulated from L4 to D6 and down- regulated from D6 to D15(Table 2).The gene of sma-4 encodes a Smad protein and a homolog of human DPC4, the protein of SMA-4 is similar to members of the vertebrate protein family of Dwarfins. During development, sma-4 functions as part of a DBL-1/SMA-6 TGF-beta-related signaling pathway that controls body size and male tail sensory ray and spicule formation as well as regulates reproductive aging via oocyte and germline quality maintenance [27]. Indeed, TGF-beta signaling pathway was one of our candidate aging-dependent pathways (Figure 5). The Smad-mediated TGF-beta signaling pathway controls numerous cellular responses from cell proliferation, differentiation and extracellular matrix remodelling to embryonic development in species ranging from worms to mammals [20]. It has been shown that TGF-beta superfamily ligands can regulate cellular or physiological processes through non-canonical pathways by the activation of other signaling molecules, e.g. Akt, MAPK, mTOR, and Src independent of Smad proteins [28]. In this study, Wnt signaling pathway would be seen as one of Smad-dependent pathways in TGF-beta family signaling based on the common regulator of SMA-4 (Table 2).
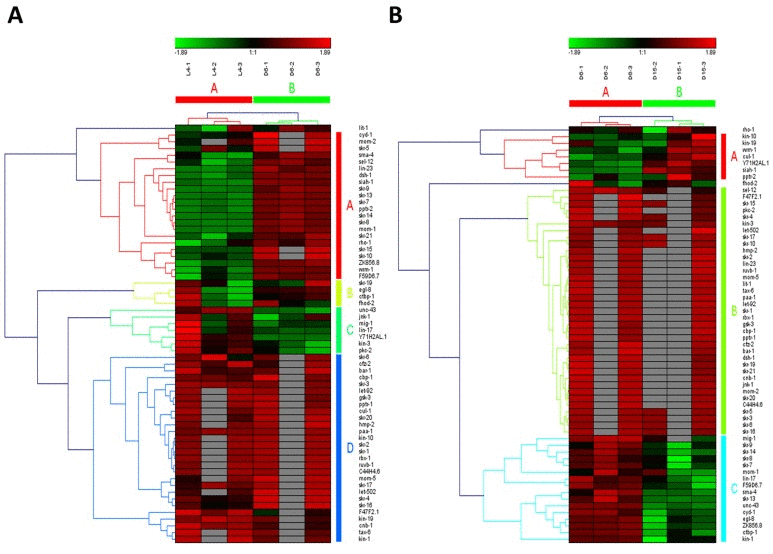
Figure 4. The heat map and hierarchical clustering in Wnt signaling pathway during aging (A) It showed the heat map and hierarchical clustering in Wnt signaling pathway from the stage of L4 to D6. The samples (column) were clustered into two groups, three replicates in the stage of L4 (L4-1, L4-2 and L4-3) were clustered together and three replicates at day 6 (D6-1, D6-2 and D6-3) were clustered together. There were 62 involved genes (row) in Wnt signaling pathway from L4 to D6, which were clustered into 4 groups (the group from A to D). (B) It showed the heat map and hierarchical clustering in Wnt signaling pathway from the stage of D6 to D15. The samples were clustered into two groups, three replicates at day 6 (D6-1, D6-2 and D6-3) were clustered together and three replicates at day 15 (D15-1, D15-2 and D15-3) were clustered together. There were also 62 involved genes in Wnt signaling pathway from D6 to D15, which were clustered into 3 groups (the group from A to C). Red is for up-regulated and green is for down-regulated.
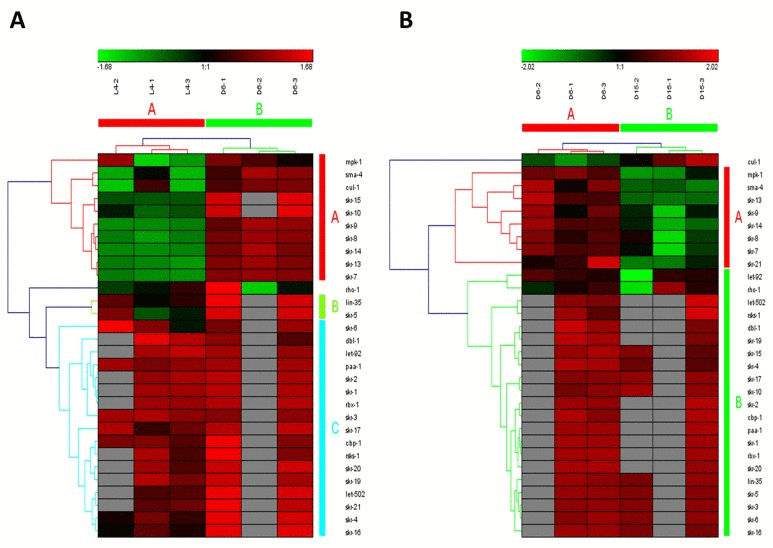
Figure 5. The heat map and hierarchical clustering in TGF-beta signaling pathway during aging (A) It showed the heat map and hierarchical clustering in TGF-beta signaling pathway from the stage of L4 to D6. The samples (column) were clustered into two groups, three replicates in the stage of L4 (L4-1, L4-2 and L4-3) were clustered together and three replicates at day 6 (D6-1, D6-2 and D6-3) were clustered together. There were 30 involved genes (row) in TGF-beta signaling pathway from L4 to D6, which were mainly clustered into 3 groups (the group from A to C). (B) It showed the heat map and hierarchical clustering in TGF-beta signaling pathway from the stage of D6 to D15. The samples were clustered into two groups, three replicates at day 6 (D6-1, D6-2 and D6-3) were clustered together and three replicates at day 15 (D15-1, D15-2 and D15-3) were clustered together. There were also 30 involved genes in TGF-beta signaling pathway from D6 to D15, which were mainly clustered into 2 groups (the group of A and B).Red is for up-regulated and green is for down-regulated.
ErbB signaling pathway was the last one of our truly aging-dependent signaling pathways with dynamic expression pattern during aging (Figure 6). The ErbB family of receptor tyrosine kinases (RTKs) couples binding of extracellular growth factor (EGF) ligands to intracellular signaling pathways regulating diverse biologic responses, including proliferation, differentiation, cell motility, and survival [29]. In this pathway, lin-45 was the only one significantly regulated gene, which also appearing in both MAPK signaling pathway and mTOR signaling pathway (Table 2). lin-45 is a component of an EGFR-mediated inductive signaling pathway that causes vulva precursor cells (VPCs) to generate the vulva [30]. Expression of LIN-45(V627E) and LIN-45(ED) was previously identified to occasionally cause the vulva to burst at the L4-to-adult molt, which may reflect defects in either the VPC specification or the resulting vulval cells [31]. Although Hedgehog signaling pathway has been identified as one of the significantly aging-dependent pathways, it was not the true one due to the unsuccessful clustering on samples from D6 to D15 by using involved genes (Additional file 3).
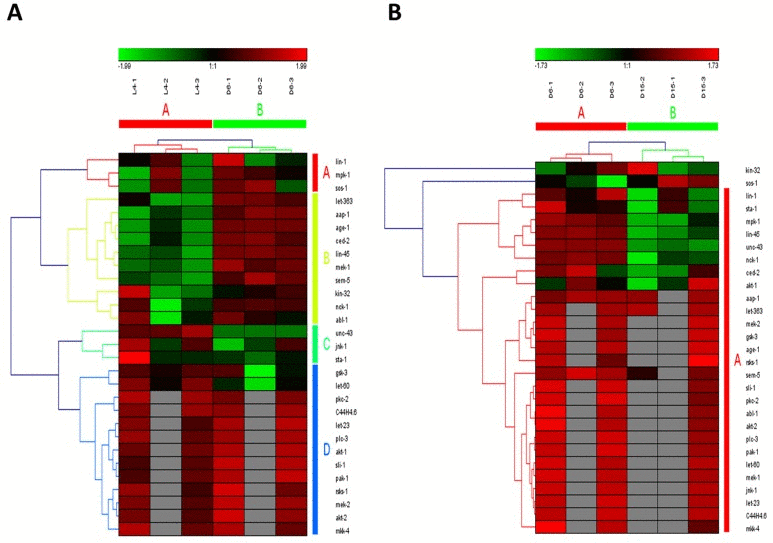
Figure 6. The heat map and hierarchical clustering in ErbB signaling pathway during aging (A) It showed the heat map and hierarchical clustering in ErbB signaling pathway from the stage of L4 to D6. The samples (column) were clustered into two groups, three replicates in the stage of L4 (L4-1, L4-2 and L4-3) were clustered together and three replicates at day 6 (D6-1, D6-2 and D6-3) were clustered together. There were 29 involved genes (row) in ErbB signaling pathway from L4 to D6, which were clustered into 4 groups (the group from A to D). (B) It showed the heat map and hierarchical clustering in ErbB signaling pathway from the stage of D6 to D15. The samples were clustered into two groups, three replicates at day 6 (D6-1, D6-2 and D6-3) were clustered together and three replicates at day 15 (D15-1, D15-2 and D15-3) were clustered together. There were also 29 involved genes in ErbB signaling pathway from D6 to D15, in which there was mainly one group (the group of A).Red is for up-regulated and green is for down-regulated.
Generally, there were 12 significant genes with dynamic regulation patterns during aging in above five truly significant signaling pathways (Figure 7). They were ced-2, lin-45, ZK856.8, F59D6.7, pdk-1, cyd-1, sma-4, andskr-7, 8, 9, 13, 14, all of which were significantly up-regulated from L4 to D6 and down-regulated from D6 to D15. The information of significances and involved pathways were shown in Table 2. These targets would be regarded as key factors in future studies of genetic mechanisms of aging. Interestingly, 5 members of skr gene family (skr-7, 8, 9, 13, 14) were included. skr-7 encodes a homolog of Skp1 that functions within a particular SCF ubiquitin-ligase (E3) complex by binding both a cullin (a homolog of S. cerevisiae Cdc53) and an F box protein (through direct interaction with an F box motif), which is required for posterior body morphogenesis, embryonic and larval development, and cell proliferation [32, 33]. The most closely related paralogs of skr-7, -8 and -9 were highly similar, but it is not clear whether these genes comprise a functionally redundant set. The function of SKR-13 is not necessarily confined to, or even partially involved with C. elegans ubiquitin-ligase complexes. In two-hybrid assays, SKR-13 does not bind to any known C. elegans cullins (CUL-1 through CUL-6) [33]. The most closely related paralogs of skr-13 in the C. elegans genome are skr-12 and skr-14.
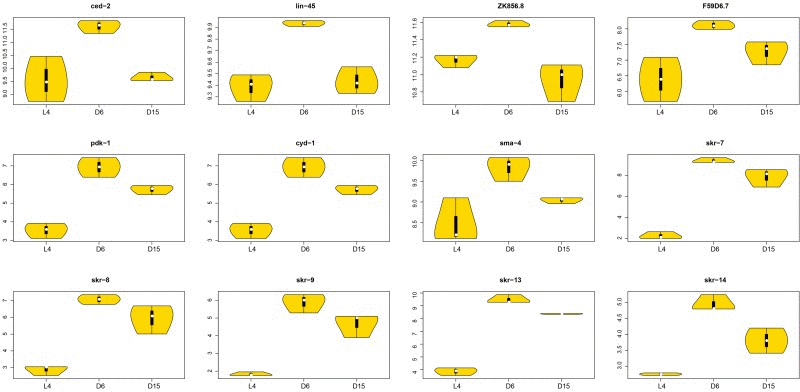
Figure 7. The violin plots of significantly associated genes in signaling pathways during aging The violin plots showed the expression distributions of the significantly associated genes with dynamic regulation pattern in signaling pathways during aging. The X-axis represents three different stages (L4, D6 and D15); The Y-axis represents the normalized gene expression value. There were 12 genes (ced-2, lin-45, ZK856.8, F59D6.7, pdk-1, cyd-1, sma-4, and skr-7, 8, 9, 13, 14), all of which were significantly up-regulated from L4 to D6 and down-regulated from D6 to D15. The significances of each gene were shown in Table 2.
Multi-level gene regulatory networks in signaling pathways during aging
There were totally 154 and 158 individual genes in above five truly significant signaling pathways, respectively from L4 to D6 and from D6 to D15. The expression profiles of these genes were shown in Additional file 4. Based on ChIP–seq data analysis to explore the binding site targets of individual factors, 2530, 5974 and 3178 target genes were identified for transcription factors (TFs) of FOS-1, NHR-28 and UNC-62, respectively (Additional file 4). To dissect the association among these regulators or between regulators and target genes in multiple signaling pathways both from L4 to D6 and from D6 to D15, multi-level gene regulatory networks were constructed for these two developmental stages. As a result, NHR-28 was commonly identified at the top of the network, which regulated UNC-62 and FOS-1, the regulator of FOS-1 was regulated by UNC-62 at the same time (Figure 8). HOX co-factor UNC-62 (Homothorax) has been identified as a developmental regulator that binds proximal to age-regulated genes and modulates lifespan by integrating RNAi and genomics approach [39]. C. elegans FOS-1 has been shown to act in uterine and vulval development, which regulates plc-1 expression in the spermatheca to control ovulation [4]. Moreover, 64 interactions between regulatory factors and target genes were identified at the first stage, including 26 genes regulated by NHR-28, 21 genes by UNC-62 and 17 genes by FOS-1. By contrast, 79 interactions between regulatory factors and target genes were identified at the second stage, including 31 genes regulated by NHR-28, 27 genes by UNC-62 and 21 genes by FOS-1 (Additional file 5). 32 common target genes were identified at both stages, but 3 genes only appears at the first stage (ruvb-1, let-60 and siah-1 in Figure 8A) and 10 genes only appears at the second stage (cdc-42, kin-19, mom-5,ife-2, mek-2, C07E3.9, gpa-12, sos-1, let-23and skr-21 in Figure 8B).
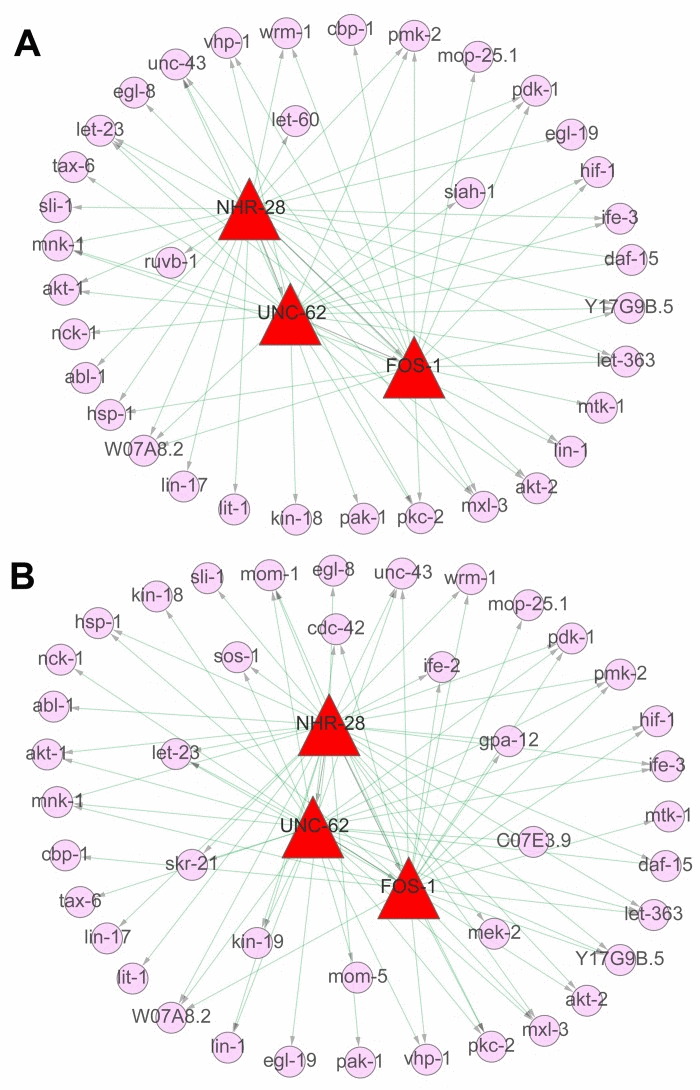
Figure 8. The regulatory networks in signaling pathways during aging The regulatory networks were constructed based on three of aging related ChIP–seq datasets (3 TFs of NHR-28, UNC-62 and FOS-1 related) and the expression matrices of 154 involved genes in identified signaling pathways above. (A) It indicated the gene regulatory networks from the stage of L4 to D6, including the TFs (NHR-28, UNC-62 and FOS-1 in red triangular frame) as well as the target genes (in pink circle). (B) It indicated the gene regulatory networks from the stage of D6 to D15, including the TFs (NHR-28, UNC-62 and FOS-1 in red triangular frame) as well as the target genes (in pink circle). The external part represents the common genes between these two periods and the inner part represents the novel targets not appearing in the other period.
In this study, we employed the gene expression datasets of three time points during aging in C. elegans and performed the approach of GSEA on each dataset between two adjacent stages. As a result, multiple genetic pathways and targets were identified as significantly down- or up-regulated. Among them, 5 truly aging-dependent signaling pathways including MAPK signaling pathway, mTOR signaling pathway, Wnt signaling pathway, TGF-beta signaling pathway and ErbB signaling pathway as well as 12 significantly associated genes were identified with dynamic expression pattern during aging. On the other hand, the continued declines in the regulation of several metabolic pathways have been demonstrated to display age-related changes. Furthermore, the reconstructed regulatory networks based on three of aging related ChIP–seq datasets and the expression matrices of 154 involved genes in above signaling pathways provided new insights into aging at the multiple pathways level. In conclusion, the identification of these genetic pathways and target genes by our integrated analysis would support the hyperfunction theory, which is a plausible alternative to the molecular damage theory to explain aging in C. elegans [1]. The combination of multiple genetic pathways and targets needs to taken into consideration in future studies of aging, in which the dynamic regulation would be uncovered.
Methods
Gene expression data collection and pre-processing
The gene expression dataset of GSE21784 related to aging was collected from the database of GEO (www.ncbi.nlm.nih.gov/geo/), which was contributed by Youngman MJ et al. [14]. In this study, RNA samples were obtained from wild type C. elegans strain Bristol N2 during aging and then prepared for hybridization to Affymetrix C. elegans Genome Array (GPL200) from synchronized populations of C. elegans at three points: the late larval L4 stage (L4, 1 day pre-adulthood), day 6 of adulthood (D6), and day 15 of adulthood (D15). There are three biological replicates for each time point: 3 for L4 (marked with L4-1, L4-2 and L4-3 in the following analysis), 3 for D6 (D6-1, D6-1 and D6-3), as well as 3 for D15 (D15-1, D15-1 and D15-3). We then divided the datasets into two subsets, including the study of period from L4 to D6 (containing 6 samples: L4-1, L4-2, L4-3, D6-1, D6-1 and D6-3) and the study of period from D6 to D15 (also containing 6 samples: D6-1, D6-1, D6-3, D15-1, D15-1 and D15-3). It aims to uncover the diverse mechanism of aging process.
To assess the influence of preprocessing on the comparison, data preprocessing was performed using software packages developed in version2.6.0 of Bioconductor and R version 2.10.1. Each Affymetrix dataset was background adjusted, normalized and log2 probe-set intensities calculated using the Robust Multichip Averaging (RMA) algorithm in Affy package [41].
The analysis of significantly enriched pathways and genes
The approaches of Gene Set Enrichment Analysis (GSEA) were performed using Category package in version 2.6.0 of Bioconductor to identify the significantly enriched pathways and genes in both above two subsets [42, 43]. In our analysis, the gene sets with less than 10 genes were excluded. The t-statistic mean of the genes was computed in each KEGG (Kyoto Encyclopedia of Genes and Genomes) pathway. Using a permutation test with 1000 times, the cutoff of significance level p value was set as 0.01 for the most significant pathways related to aging. Accordingly, the significant pathways and genes were then identified under the comparison between different time points, including from L4 to D6 and from D6 to D15. The following classification of identified pathways was based on the KEGG pathway maps br08901 of BRITE Functional Hierarchies in KEGG database (http://www.genome.jp/kegg-bin/get_htext?br08901.keg). The annotation of significant C. elegans genes in each pathway was based on the WormBase database, of version WS236 (www.wormbase.org). Next, clustering on groups and genes was performed based on the identified genes' expression in each significant pathway using the method of hierarchical clustering with Euclidean distance. The significance of associated target genes from L4 to D6 or from D6 to D15 was calculated by unpaired t test.
Construction of regulatory networks of signaling pathway genes
The tool of Constructing Multi-level Gene Regulatory Networks (CMGRN) was used to integrate NHR-28 (L4), FOS-1 (L4) and UNC-62 (YD) ChIP-seq information of transcription factor (TF) binding with expression profiling of signaling pathway genes that significantly enriched during aging. CMGRN(http://bioinfo.icts.hkbu.edu.hk/cmgrn/) is based on a methodology combining Bayesian hierarchical model with Gibbs Sampling implementation to identify correct sets of regulator-gene interactions which explore underlying network structures [47]. We aimed to dissect the association between these regulators or between regulators and genes as well as to reconstruct regulatory networks in signaling pathways involved in aging processes from L4 to D6 and from D6 to D15. Firstly, the file of sequence counts of our selected 3 regulators (NHR-28, FOS-1 and UNC-62) on the target genes was used here as the input of ChIP–seq gene counts. Secondly, the target gene symbols containing sequences of each regulator measured by ChIP–seq was used as the input of binding data. The last input file is the gene expression profile. Here, we used the gene expression values of involved genes in the significantly identified pathways by GSEA of each sample, respectively for the stages from L4 to D6 and from D6 to D15. Then the parameters were set as defaults: the minimal value of interaction was selected as 10, the probability cutoff for regulator-gene interaction was selected as 70% and the causal relationship percentage was selected as 20%.
Supplementary Materials
Acknowledgments
We acknowledge financial support by the Scientific Research Foundation and Academic & Technology Leaders Introduction Project, and 211 Project of Anhui University (10117700023) as well as the Collaborative Research Fund (CRF) of Research Grants Council (RGC) in Hong Kong and Faculty Research Grants (FRG) from Hong Kong Baptist University.
Conflicts of Interest
The authors of this manuscript have no conflict of interest to declare.
References
- 1. Gems D and de la Guardia Y. Alternative Perspectives on Aging in Caenorhabditis elegans: Reactive Oxygen Species or Hyperfunction? Antioxidants & redox signaling. 2013; 19: 321 -329. [PubMed] .
- 2. Yanos ME, Bennett CF, Kaeberlein M. Genome-Wide RNAi Longevity Screens in Caenorhabditis elegans. Curr Genomics. 2012; 13: 508 -518. [PubMed] .
- 3. McCormick MA and Kennedy BK. Genome-scale studies of aging: challenges and opportunities. Curr Genomics. 2012; 13: 500 -507. [PubMed] .
- 4. Kenyon CJ. The genetics of ageing. Nature. 2010; 464: 504 -512. [PubMed] .
- 5. Golden TR and Melov S. Gene expression changes associated with aging in C. elegans. WormBook. 2007: 1 -12. [PubMed] .
- 6. Fisher AL and Lithgow GJ. The nuclear hormone receptor DAF-12 has opposing effects on Caenorhabditis elegans lifespan and regulates genes repressed in multiple long-lived worms. Aging Cell. 2006; 5: 127 -138. [PubMed] .
- 7. Lund J, Tedesco P, Duke K, Wang J, Kim SK, Johnson TE. Transcriptional profile of aging in C. elegans. Curr Biol. 2002; 12: 1566 -1573. [PubMed] .
- 8. Viswanathan M, Kim SK, Berdichevsky A, Guarente L. A role for SIR-2.1 regulation of ER stress response genes in determining C. elegans life span. Dev Cell. 2005; 9: 605 -615. [PubMed] .
- 9. Suarez-Farinas M, Lowes MA, Zaba LC, Krueger JG. Evaluation of the psoriasis transcriptome across different studies by gene set enrichment analysis (GSEA). PLoS One. 2010; 5: e10247 [PubMed] .
- 10. Subramanian A, Tamayo P, Mootha VK, Mukherjee S, Ebert BL, Gillette MA, Paulovich A, Pomeroy SL, Golub TR, Lander ES, Mesirov JP. Gene set enrichment analysis: a knowledge-based approach for interpreting genome-wide expression profiles. Proc Natl Acad Sci U S A. 2005; 102: 15545 -15550. [PubMed] .
- 11. Robertson G, Hirst M, Bainbridge M, Bilenky M, Zhao Y, Zeng T, Euskirchen G, Bernier B, Varhol R, Delaney A, Thiessen N, Griffith OL, He A, et al. Genome-wide profiles of STAT1 DNA association using chromatin immunoprecipitation and massively parallel sequencing. Nature methods. 2007; 4651 -657. .
- 12. Johnson DS, Mortazavi A, Myers RM, Wold B. Genome-wide mapping of in vivo protein-DNA interactions. Science. 2007; 316: 1497 -1502. [PubMed] .
- 13. Celniker SE, Dillon LA, Gerstein MB, Gunsalus KC, Henikoff S, Karpen GH, Kellis M, Lai EC, Lieb JD, MacAlpine DM, Micklem G, Piano F, Snyder M, et al. Unlocking the secrets of the genome. Nature. 2009; 459: 927 -930. [PubMed] .
- 14. Youngman MJ, Rogers ZN, Kim DH. A decline in p38 MAPK signaling underlies immunosenescence in Caenorhabditis elegans. PLoS Genet. 2011; 7: e1002082 [PubMed] .
- 15. Schlessinger J. Cell signaling by receptor tyrosine kinases. Cell. 2000; 103: 211 -225. [PubMed] .
- 16. Aroian RV, Koga M, Mendel JE, Ohshima Y, Sternberg PW. The let-23 gene necessary for Caenorhabditis elegans vulval induction encodes a tyrosine kinase of the EGF receptor subfamily. Nature. 1990; 348: 693 -699. [PubMed] .
- 17. Jacobs D, Beitel GJ, Clark SG, Horvitz HR, Kornfeld K. Gain-of-function mutations in the Caenorhabditis elegans lin-1 ETS gene identify a C-terminal regulatory domain phosphorylated by ERK MAP kinase. Genetics. 1998; 149: 1809 -1822. [PubMed] .
- 18. Hsu V, Zobel CL, Lambie EJ, Schedl T, Kornfeld K. Caenorhabditis elegans lin-45 raf is essential for larval viability, fertility and the induction of vulval cell fates. Genetics. 2002; 160: 481 -492. [PubMed] .
- 19. Moon RT, Bowerman B, Boutros M, Perrimon N. The promise and perils of Wnt signaling through beta-catenin. Science. 2002; 296: 1644 -1646. [PubMed] .
- 20. Heldin CH, Miyazono K, ten Dijke P. TGF-beta signalling from cell membrane to nucleus through SMAD proteins. Nature. 1997; 390: 465 -471. [PubMed] .
- 21. Tomioka M, Adachi T, Suzuki H, Kunitomo H, Schafer WR, Iino Y. The insulin/PI 3-kinase pathway regulates salt chemotaxis learning in Caenorhabditis elegans. Neuron. 2006; 51: 613 -625. [PubMed] .
- 22. Riesen M, Feyst I, Rattanavirotkul N, Ezcurra M, Tullet JM, Papatheodorou I, Ziehm M, Au C, Gilliat AF, Hellberg J, Thornton JM, Gems D. MDL-1, a growth- and tumor-suppressor, slows aging and prevents germline hyperplasia and hypertrophy in C. elegans. Aging. 2014; 6: 98 -117. [PubMed] .
- 23. Gems D and Partridge L. Genetics of longevity in model organisms: debates and paradigm shifts. Annual review of physiology. 2013; 75: 621 -644. .
- 24. Blagosklonny MV. An anti-aging drug today: from senescence-promoting genes to anti-aging pill. Drug discovery today. 2007; 12: 218 -224. [PubMed] .
- 25. Blagosklonny MV. Aging and immortality: quasi-programmed senescence and its pharmacologic inhibition. Cell cycle (Georgetown, Tex). 2006; 5: 2087 -2102. .
- 26. Demidenko ZN, Shtutman M, Blagosklonny MV. Pharmacologic inhibition of MEK and PI-3K converges on the mTOR/S6 pathway to decelerate cellular senescence. Cell cycle (Georgetown, Tex). 2009; 8: 1896 -1900. .
- 27. Luo S, Kleemann GA, Ashraf JM, Shaw WM, Murphy CT. TGF-beta and insulin signaling regulate reproductive aging via oocyte and germline quality maintenance. Cell. 2010; 143: 299 -312. [PubMed] .
- 28. Derynck R and Zhang YE. Smad-dependent and Smad-independent pathways in TGF-beta family signalling. Nature. 2003; 425: 577 -584. [PubMed] .
- 29. Yarden Y and Sliwkowski MX. Untangling the ErbB signalling network. Nature reviews Molecular cell biology. 2001; 2: 127 -137. .
- 30. Sundaram MV. RTK/Ras/MAPK signaling. WormBook. 2006: 1 -19. [PubMed] .
- 31. de la, Cova C, Greenwald I. SEL-10/Fbw7-dependent negative feedback regulation of LIN-45/Braf signaling in C. elegans via a conserved phosphodegron. Genes & development. 2012; 26: 2524 -2535. [PubMed] .
- 32. Yamanaka A, Yada M, Imaki H, Koga M, Ohshima Y, Nakayama K. Multiple Skp1-related proteins in Caenorhabditis elegans: diverse patterns of interaction with Cullins and F-box proteins. Curr Biol. 2002; 12: 267 -275. [PubMed] .
- 33. Nayak S, Santiago FE, Jin H, Lin D, Schedl T, Kipreos ET. The Caenorhabditis elegans Skp1-related gene family: diverse functions in cell proliferation, morphogenesis, and meiosis. Curr Biol. 2002; 12: 277 -287. [PubMed] .
- 34. Van Voorhies WA and Ward S. Genetic and environmental conditions that increase longevity in Caenorhabditis elegans decrease metabolic rate. Proc Natl Acad Sci U S A. 1999; 96: 11399 -11403. [PubMed] .
- 35. Braeckman BP, Houthoofd K, Brys K, Lenaerts I, De Vreese A, Van Eygen S, Raes H, Vanfleteren JR. No reduction of energy metabolism in Clk mutants. Mech Ageing Dev. 2002; 123: 1447 -1456. [PubMed] .
- 36. Braeckman BP, Houthoofd K, De Vreese A, Vanfleteren JR. Assaying metabolic activity in ageing Caenorhabditis elegans. Mech Ageing Dev. 2002; 123: 105 -119. [PubMed] .
- 37. Chamoli M, Singh A, Malik Y, Mukhopadhyay A. A novel kinase regulates dietary restriction-mediated longevity in Caenorhabditis elegans. Aging Cell. 2014; .
- 38. Dai DF, Karunadharma PP, Chiao YA, Basisty N, Crispin D, Hsieh EJ, Chen T, Gu H, Djukovic D, Raftery D, Beyer RP, Maccoss MJ, Rabinovitch PS. Altered proteome turnover and remodeling by short-term caloric restriction or rapamycin rejuvenate the aging heart. Aging Cell. 2014; .
- 39. Van Nostrand EL, Sanchez-Blanco A, Wu B, Nguyen A, Kim SK. Roles of the developmental regulator unc-62/Homothorax in limiting longevity in Caenorhabditis elegans. PLoS Genet. 2013; 9: e1003325 [PubMed] .
- 40. Hiatt SM, Duren HM, Shyu YJ, Ellis RE, Hisamoto N, Matsumoto K, Kariya K, Kerppola TK, Hu CD. Caenorhabditis elegans FOS-1 and JUN-1 regulate plc-1 expression in the spermatheca to control ovulation. Molecular biology of the cell. 2009; 20: 3888 -3895. [PubMed] .
- 41. Gautier L, Cope L, Bolstad BM, Irizarry RA. affy--analysis of Affymetrix GeneChip data at the probe level. Bioinformatics. 2004; 20: 307 -315. [PubMed] .
- 42. Chiaretti S, Li X, Gentleman R, Vitale A, Vignetti M, Mandelli F, Ritz J, Foa R. Gene expression profile of adult T-cell acute lymphocytic leukemia identifies distinct subsets of patients with different response to therapy and survival. Blood. 2004; 103: 2771 -2778. [PubMed] .
- 43. He K, Chen Z, Ma Y, Pan Y. Identification of high-copper-responsive target pathways in Atp7b knockout mouse liver by GSEA on microarray data sets. Mamm Genome. 2011; 22: 703 -713. [PubMed] .
- 44. Van Nostrand EL and Kim SK. Integrative analysis of C. elegans modENCODE ChIP–seq data sets to infer gene regulatory interactions. Genome Res. 2013; .
- 45. Langmead B and Salzberg SL. Fast gapped-read alignment with Bowtie 2. Nature methods. 2012; 9: 357 -359. [PubMed] .
- 46. Zhang Y, Liu T, Meyer CA, Eeckhoute J, Johnson DS, Bernstein BE, Nusbaum C, Myers RM, Brown M, Li W, Liu XS. Model-based analysis of ChIP–Seq (MACS). Genome biology. 2008; 9: R137 [PubMed] .
- 47. Guan D, Shao J, Deng Y, Wang P, Zhao Z, Liang Y, Wang J, Yan B. CMGRN: a web server for constructing multilevel gene regulatory networks using ChIP–seq and gene expression data. Bioinformatics. 2014; Epub ahead of print .