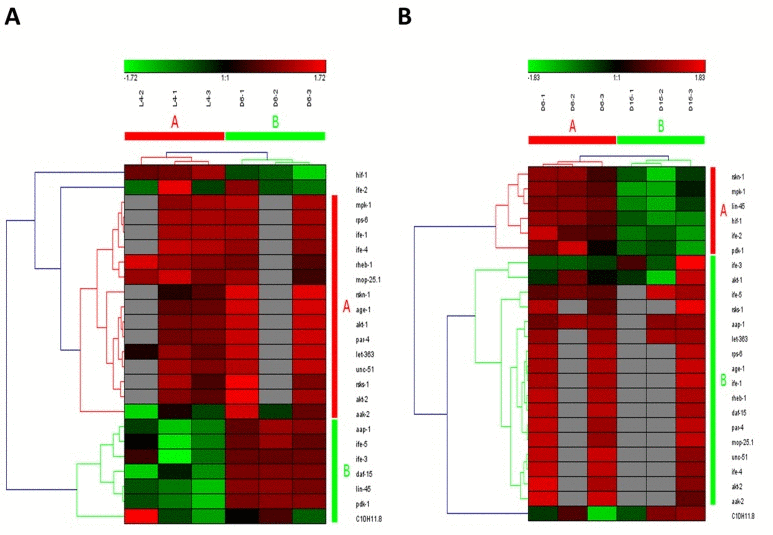
Figure 3.The heat map and hierarchical clustering in mTOR signaling pathway during aging(A) It showed the heat map and hierarchical clustering in mTOR signaling pathway from the stage of L4 to D6. The samples (column) were clustered into two groups, three replicates in the stage of L4 (L4-1, L4-2 and L4-3) were clustered together and three replicates at day 6 (D6-1, D6-2 and D6-3) were clustered together. There were 24 involved genes (row) in mTOR signaling pathway from L4 to D6, which were clustered into 2 groups (the group of A and B). (B) It showed the heat map and hierarchical clustering in mTOR signaling pathway from the stage of D6 to D15. The samples were clustered into two groups, three replicates at day 6 (D6-1, D6-2 and D6-3) were clustered together and three replicates at day 15 (D15-1, D15-2 and D15-3) were clustered together. There were also 24 involved genes in mTOR signaling pathway from D6 to D15, which were clustered into 2 groups (the group of A and B).Red is for up-regulated and green is for down-regulated.