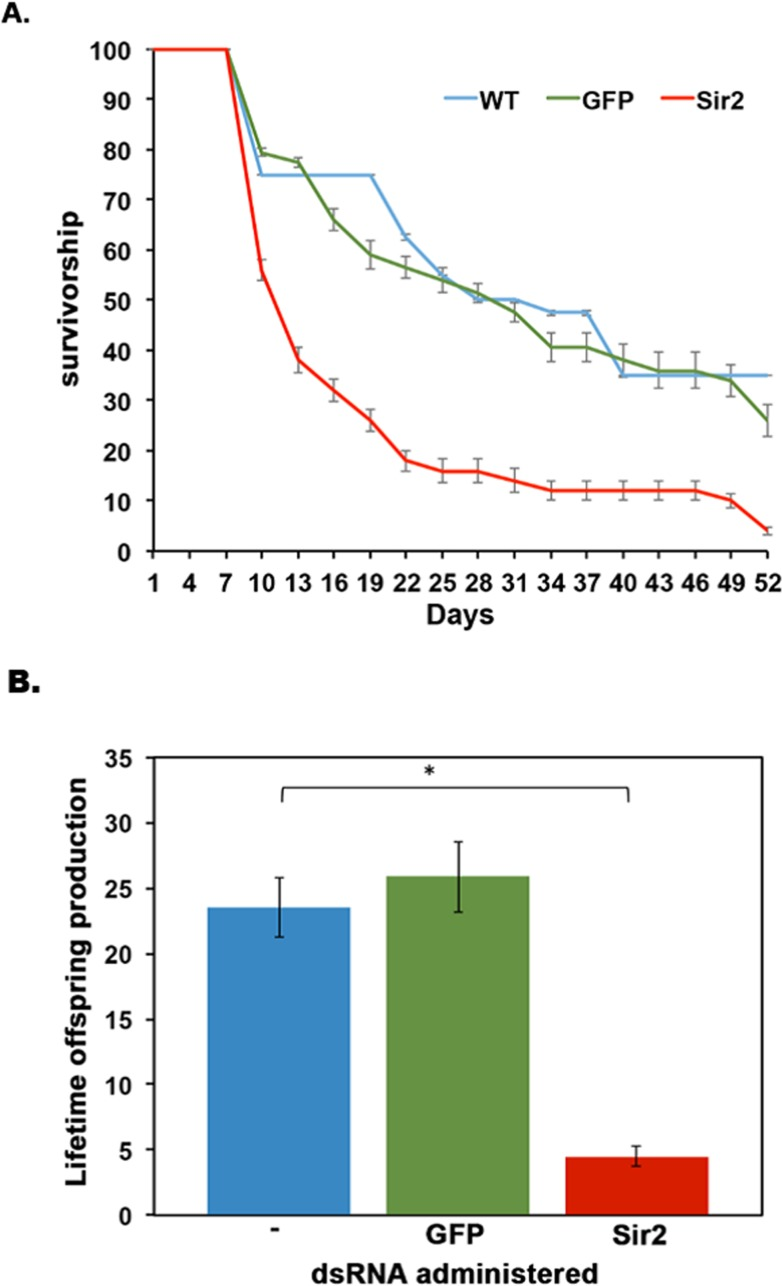
Figure 7.Sir2 knockdown in D. pulicaria results in reduced lifespan and lifetime offspring production(A) Survivorship curves. The survivorship curves of untreated (blue line), GFP dsRNA-treated (green line), and Sir2 dsRNA-treated (red line) Daphnia are represented. Ten Daphnia placed in 100 ml of COMBO were fed daily on bacteria containing the knockdown constructs. RNAi was performed in a total of 4 different biological replicates. Each plotted point is average survivorship on that day (collectively from our 4 biological replicates) and error bars depict standard error of the mean. No bacteria (untreated) (n=40), GFP (dsRNA control) (n=44), Sir2 (n=60). To determine statistical significance, a nonparametric log rank test was performed and the results are as follows: X2=19.1, p-value=1.2×10⁻⁵ comparing Sir2 to WT, X2=18.098, p-value=2.1×10⁻⁵ comparing Sir2 to GFP. (B) Average number of offspring per Daphnia mother. The average number of progeny per mother over the course of its lifespan was calculated by dividing the total number of offspring produced in an experimental set by the total number of adult Daphnia mothers in that set. Blue bar is WT control, green bar is GFP dsRNA-treated, and red bar is Sir2 dsRNA-treated. A Student T-test was performed on the lifetime offspring production and the associated p-values are as follows: *:0.015. Error bars represent standard deviations. An ANOVA was performed (F: 93, df: 2,6, p: 3.02×10⁻⁵) followed by a post hoc Tukey test. The post hoc analysis revealed that – and Sir2 means were statistically different from one another as are GFP to Sir2, * indicate p<0.05. Means – to GFP were not statistically significant in their difference (ns).