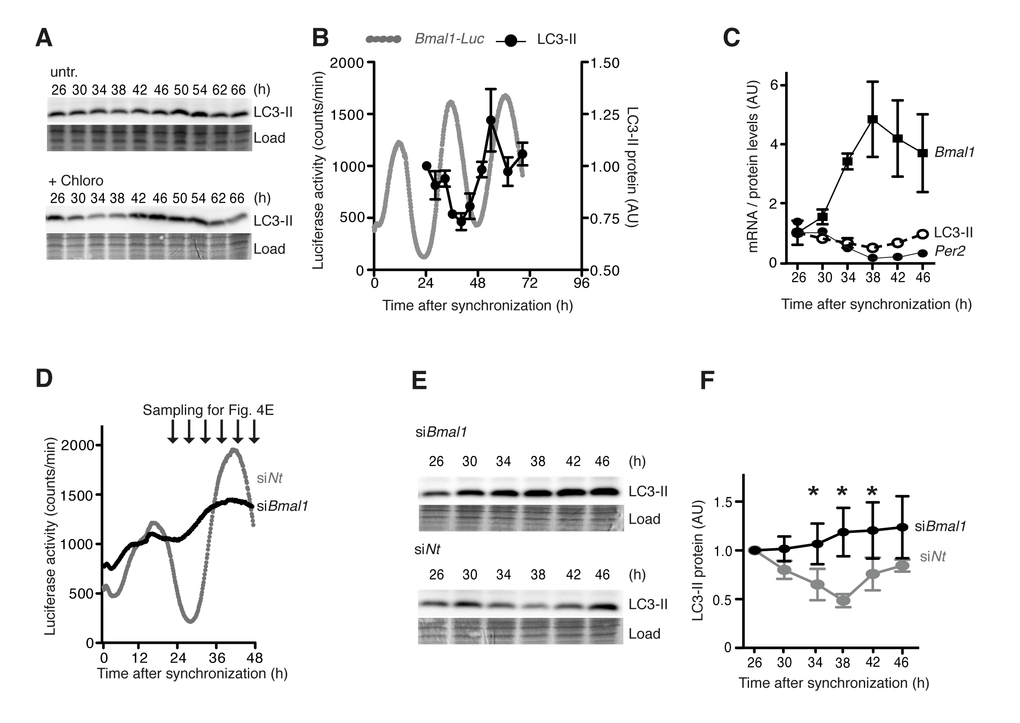
Figure 4.Cell-autonomous regulation of autophagy in mouse fibroblasts. (A) Western blots of LC3-II without (upper panel) or with (lower panel) the lysosome inhibitor Chloroquine in synchronised NIH 3T3 Bmal1-Luc fibroblasts. The time after Dexamethasone treatment is indicated on top. (B) Quantification of LC3-II protein levels (black) and Bmal1-Luc reporter gene activity (grey). (C) Levels of endogenous Bmal1 mRNA (squares), Per2 mRNA (closed circles) and LC3-II protein (open circles). Data are normalised to the respective mean value at 26 h. (D) Circadian luciferase activity in NIH 3T3 Bmal1-Luc fibroblasts after transfection with Bmal1-specific siRNA (black) or an equivalent dose of Non-target (Nt) siRNA (grey). (E) Expression of LC3-II protein at time points indicated in (D). (F) Quantification of LC3-II protein levels. Data are normalised to the mean value at 26 h. Asterisks designate statistically significant differences between siBmal1 and siNt (unpaired t-test, two-tailed). All data are shown as mean values ± SEM, n=4.