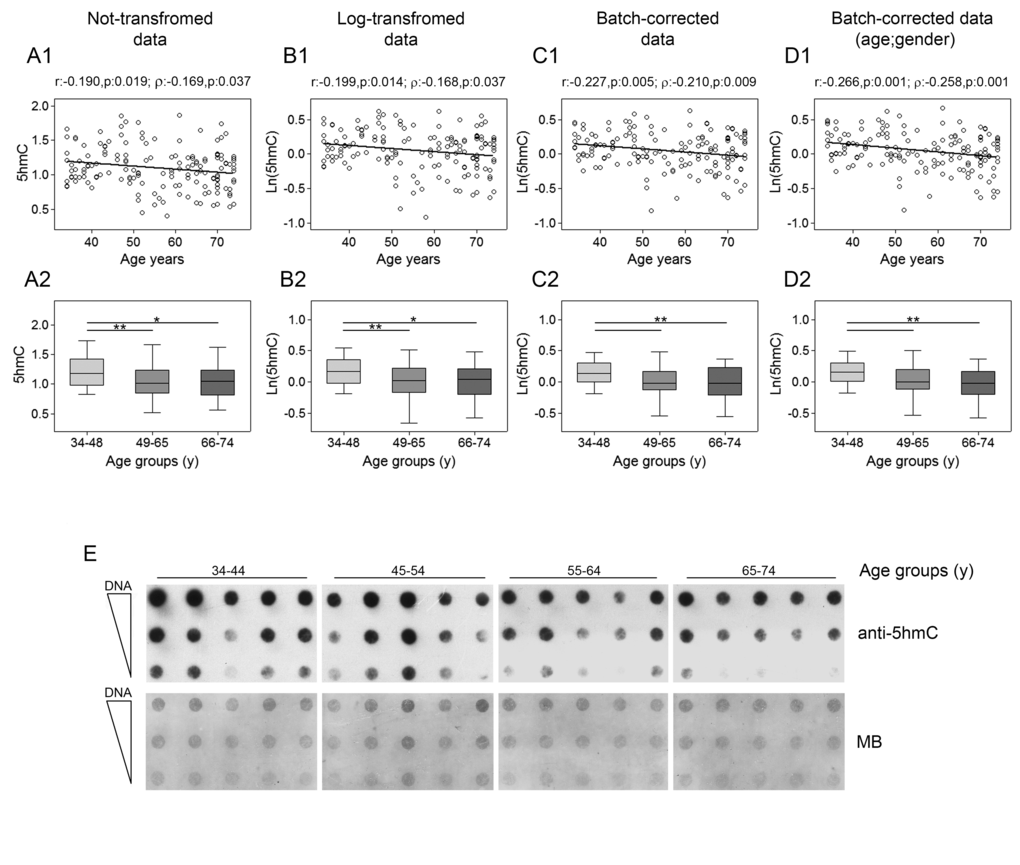
Figure 6.Age-related changes of 5hmC levels in PBMC. Upper panels show scatter plots representing the linear correlation between 5hmc levels and age in PBMC calculated from (A1) non-transformed 5hmC data, (B1) log-transformed 5hmC data, (C1) batch-corrected 5hmC data, (D1) batch-corrected 5hmC data retaining age and gender differences. Parametric (Pearson r) and non-parametric (Spearman’s ρ) correlation coefficients and statistical significance are given above each graph. Lower panels show bar graphs reporting the levels of 5hmC in three different age classes calculated from (A2) non-transformed 5hmC data, (B2) log-transformed 5hmC data, (C2) batch-corrected 5hmC data, (D2) batch-corrected 5hmC data retaining age and gender differences. Boxplots show the median, the interquartile range (boxes) and the 5–95% data range (whisker caps). Comparisons between groups were performed by the Kruskal-Wallis test followed by the post-hoc Bonferroni test (*P < 0.05; **P < 0.01). (E) Representative dot blot performed on DNA from 20 individuals by using anti-5hmC antibody and methylene blue (MB) staining to control DNA loading. (y)= years.